The main category of Forex News.
You can use the search box below to find what you need.
[wd_asp id=1]
The main category of Forex News.
You can use the search box below to find what you need.
[wd_asp id=1]
Brazil is the world’s largest producer and exporter of green coffee, but its domestic consumption of caffeine-free decaf coffee is only beginning to move beyond a marginal category. The market context is shaped by a paradox: the country grows abundant high-quality arabica beans suited for decaffeination, yet the processing infrastructure for decaf—especially premium chemical-free methods—remains underdeveloped within its borders. As a result, Brazil’s decaf market is import-driven, supplied largely by roasters and processors in Germany, Switzerland, and Mexico that specialize in Swiss Water, CO₂ supercritical, or ethyl acetate processes.
The product range covers whole bean, ground, single-serve pods, and instant formats, with ground coffee currently the dominant segment by volume. The buyer base is broadening from older, health-constrained traditional consumers to include younger urban professionals seeking late-day coffee options, foodservice operators expanding their menus, and workplace procurement managers catering to employee wellness preferences.
The market operates under Brazil’s food safety regulation (ANVISA RDC № 43/2011 and follow-on standards), which aligns with international norms requiring a minimum 97% caffeine removal and strict limits on solvent residues for chemical processes. As health and wellness trends deepen and specialty coffee culture spreads, the decaf category in Brazil is evolving from a functional substitute into a deliberate choice.
Although Brazil’s total roasted coffee consumption exceeds 1.1 million tonnes per year (green bean equivalent), decaf coffee accounts for a disproportionately small share. Market estimates place decaf’s volume share at 2–4% of the total, translating to roughly 25,000–45,000 tonnes per year in roasted decaf product turnover. This low share is a function both of supply constraints and of a cultural preference for full-caffeine coffee that remains stronger than in North America or Northern Europe.
Growth over the 2026–2035 forecast horizon is projected to run in the mid-to-high single digits annually, driven by three structural trends. First, the number of Brazilian consumers reporting “caffeine reduction” as a health priority has risen sharply—survey data from 2023–2025 indicate 20–25% of coffee drinkers now moderate caffeine intake at least part of the time. Second, the specialty coffee boom has legitimized decaf as a craft category; roasters offering premium single-origin or Swiss Water decaf are seeing 10–15% annual volume growth from a low base.
Third, the expansion of coffee pod systems (Nespresso, Dolce Gusto, and local brands) has created a convenient decaf format that lowers the taste-perception barrier. By 2035, decaf volume could roughly double from current levels, but even then it would represent only 5–7% of total coffee consumption in Brazil—still well below the 8–12% share seen in mature markets like Germany or the United States. The value growth will be slightly faster than volume, as the mix shifts toward premium and specialty SKUs commanding higher shelf prices.
Segment demand in Brazil’s decaf market is best understood by format and consumption context. By format, ground decaf coffee retains roughly 55–60% of volume, driven by traditional drip and French press preparation in households. Whole bean decaf accounts for an estimated 10–15%, concentrated in specialty roasters and foodservice outlets that grind on-site. Single-serve pods and capsules represent a fast-growing 18–22% of volume and a higher share of value (28–32%), propelled by the installed base of pod machines in Brazilian households and offices. Instant/soluble decaf makes up the balance, a category in slow decline as consumers upgrade to fresh-brewed options.
By end-use, at-home consumption dominates at 70–75% of total decaf volume. Household grocery shoppers are the primary buyer group, with purchase decisions influenced by price promotion, brand trust, and increasingly by process claims (Swiss Water, organic). Foodservice (restaurants, cafés, hotels) accounts for 15–20%, a share that is rising as cafés add decaf espresso and filter options to cater to evening and non‑caffeine-seeking patrons. Office and workplace provisioning, while still a smaller channel (~5–10%), is growing as corporate wellness programs encourage caffeine reduction. Within these end-use sectors, the mass/value tier (private label and entry-level mainstream brands) commands the largest volume share (45–50%), but the premium/specialty tier is gaining share fastest, lifting overall category value.
Pricing in Brazil’s decaf coffee market is layered and shaped by both global green bean costs and local decaffeination premiums. At the base, high-quality Brazilian arabica green beans suitable for decaf transaction in the range of USD 2.50–4.00/kg (FOB), depending on grade and certification. The cost of decaffeination adds a substantial premium: Swiss Water Process commands an estimated USD 1.50–3.00/kg over green bean cost, while conventional solvent-based (ethyl acetate or methylene chloride) processing adds USD 0.80–1.50/kg. CO₂ supercritical extraction is comparable to Swiss Water in cost.
Since the majority of Brazil’s decaf volume is imported as already-processed beans or roasted product, the landed cost includes ocean freight, warehousing, and import duties (which are typically zero under Mercosur tariffs for roasted coffee, though administrative costs apply).
Retail pricing reflects these upstream costs plus brand and format premiums. In mainstream grocery channels, a 250 g pack of ground decaf coffee retails at BRL 12–18 (approx. USD 2.20–3.30), while a private-label equivalent sits 15–25% lower. Specialty decaf whole bean or ground (e.g., single-origin, Swiss Water, organic) ranges from BRL 25–40 per 250 g. Single-serve pods cost BRL 0.80–1.50 per capsule, roughly 20–30% more per gram than bulk ground formats. Price sensitivity is highest in the value tier, where promotional discounts of 20–30% are common during monthly coffee rotations.
Meanwhile, the premium tier is relatively inelastic, as buyers are willing to pay for process integrity and flavor quality. The decaf process premium itself is a key cost driver that cannot be eliminated at scale—unlike regular coffee, where the bulk of cost is green bean commodity price, decaf’s processing step is a hard, value-added cost that passes through to end consumers.
The competitive landscape in Brazil’s decaf coffee market is a blend of global multi-category food and beverage corporations, national full-line roasters, and specialist craft coffee companies. Nestlé (through its Nescafé and Nespresso brands) and JDE Peet’s (through Pilão, Café do Ponto, and Kenco) are the largest participants, offering decaf variants across ground, instant, and pod formats. Their market reach is underpinned by extensive distribution networks, strong brand equity, and the ability to source decaffeinated beans through their global supply chains, often using their own decaf processing plants in Europe.
Brazilian national roasters—such as 3 Corações, Melitta Brasil, and Maratá—also compete in the decaf space, primarily at the mainstream and value price points. These companies typically import decaffeinated green beans (or roasted decaf) from contracted processors abroad, then blend, roast, and pack domestically. They rely on private-label contracts and supermarket shelf presence. On the specialty side, a growing number of craft roasters—including Cafeína, Sofá Café, and smaller independent roasters in São Paulo and Minas Gerais—offer premium decaf options using Swiss Water or CO₂ processed beans sourced directly from importers.
These players compete on taste quality, process transparency, and single-origin storytelling. The category also includes dedicated decaf importers and brand owners, such as Decaf BR and Caffeine Free Co., that act as channel partners between overseas decaffeination facilities and Brazilian retailers and foodservice operators. Competition is intensifying as private-label programs expand, forcing national brands to invest in better decaf blends, certifications, and marketing.
Brazil’s own decaffeination capacity is limited and concentrated in solvent-based processes (ethyl acetate and methylene chloride). A small number of industrial facilities—operated by large coffee roasters or independent processors—offer decaf services, but their combined throughput is estimated at less than 5,000–8,000 tonnes of green bean equivalent per year, far short of domestic demand. No large-scale Swiss Water or CO₂ supercritical plant operates inside Brazil, largely because the capital investment (USD 15–25 million for a moderate facility) and the need for specialized technical know-how have not yet been justified by domestic decaf volume.
Instead, most of the green coffee destined for the Brazilian decaf market is exported for processing abroad. Brazilian high-grown arabica beans are shipped to decaffeination hubs in Germany, Switzerland, Mexico, and Canada, where they are treated using chemical-free or solvent methods, then re-imported as decaffeinated green beans or roasted decaf. This round-trip logistics chain adds 4–8 weeks to lead times and increases the cost base by 15–25% relative to processing locally.
Supply is also constrained by the limited number of specialty decaf processing slots; Swiss Water plants run at 85–95% capacity globally, meaning Brazilian buyers must book production slots well in advance. As a result, domestic supply relies heavily on importers’ inventory management and the willingness of overseas processors to prioritize Brazilian orders. Some larger roasters in Brazil have attempted to develop in-house decaf capability, but the economic scale for a dedicated high-quality decaf plant remains a barrier.
Trade flows in Brazil’s decaf coffee market are asymmetrical: Brazil exports enormous volumes of green caffeinated coffee but is a net importer of processed decaf coffee. In 2025, imports of decaf coffee under HS 090122 were estimated at 20,000–30,000 tonnes, representing 70–80% of domestic decaf consumption. Germany is the single largest origin, supplying roughly 35–40% of imports (via Swiss Water and CO₂ processed beans), followed by Switzerland (20–25%) and Mexico (15–20%). Smaller volumes come from Canada, Colombia, and the United States.
Exports of decaf coffee from Brazil are negligible—typically under 500 tonnes per year—because the country lacks a competitive decaf processing industry to serve foreign roasters. Brazil does export green beans that are later decaffeinated abroad and shipped to third markets, but those volumes are registered as green coffee exports, not decaf. The trade balance for decaf is structurally deficit‑ridden, but this has no negative impact on the national coffee trade surplus because decaf imports are small relative to Brazil’s total coffee export value of over USD 5 billion.
Tariff treatment is benign: roasted coffee including decaf enters Brazil duty‑free under Mercosur’s common external tariff (zero rate for HS 090122), so import cost is driven by logistics and processing premiums rather than trade barriers. The import dependency is not expected to diminish significantly over the forecast period unless a major decaf plant is built in Brazil—a scenario that is unlikely before 2030 given current capacity and investment appetite.
Distribution of decaf coffee in Brazil mirrors the broader coffee market, with retail supermarket and hypermarket channels accounting for 60–65% of sales. Within this, the grocery format is the primary point of purchase for household shoppers. National brands and private-label decaf are both sold through these chains, with the latter often placed adjacent to branded SKUs to capture price-sensitive consumers. Convenience stores and small format retailers contribute a further 10–12% of volume, dominated by pods and instant decaf sachets.
Foodservice distribution is handled by specialized wholesale distributors serving cafés, restaurants, hotels, and workplace cafeterias. Major coffee roasters often have dedicated foodservice sales teams that supply decaf whole bean or ground coffee in bulk packages (1 kg, 2 kg) along with equipment (brewing machines, grinders). The office provisioning segment is increasingly served by online subscription models and direct-from-roaster e‑commerce platforms, which now represent 5–8% of decaf volume and are growing at 15–20% annually.
Buyer groups break down as: household grocery shoppers (65–70% of volume), foodservice procurement managers (15–20%), office managers (5–8%), online subscription buyers (3–5%), and gift givers (2–3% – seasonal). The online subscription buyer is becoming more important as DTC roasters offer curated decaf blends with recurring delivery, effectively bypassing retail shelf‑space constraints.
Decaf coffee sold in Brazil must comply with ANVISA (Agência Nacional de Vigilância Sanitária) regulations, particularly RDC № 43/2011 and subsequent technical standards for coffee products. The core requirement is a caffeine removal rate of at least 97% from the original bean content, measured on a dry weight basis—a standard harmonized with the Codex Alimentarius and most international food safety codes. For solvent-based decaffeination processes, Brazil enforces maximum residue limits (MRLs) for methylene chloride (not more than 2 mg/kg in roasted beans) and ethyl acetate (not more than 10 mg/kg). These limits are consistent with EU and FDA norms and are periodically audited by ANVISA’s laboratory network.
Organic certification (under the Brazilian Organic Conformity Assessment System, SisOrg) imposes additional constraints: organic decaf must use only permitted processes (Swiss Water, CO₂, or water‑extraction methods; ethyl acetate derived from natural sources is allowed under specific conditions). The presence of organic decaf SKUs requires traceability audits from farm to decaf plant, which further favors imported processed beans because Brazil lacks certified organic decaf facilities.
Labeling must indicate the decaffeination method if claimed, and the declaration “caffeine-free” requires the 97% removal threshold to be maintained throughout shelf life. Imported decaf products must also present proof of origin and process certification to Brazilian customs and ANVISA. The regulatory environment is stable and non‑discriminatory, but the cost of compliance for small‑scale importers can be a barrier, particularly for maintaining organic and solvent‑residue documentation.
Over the 2026–2035 decade, Brazil’s caffeine-free decaf coffee market is expected to grow at a compound annual rate of 5–7% in volume and 6–8% in value, adjusting for inflation. By 2035, total decaf volume could reach 50,000–70,000 tonnes per year, doubling from the current estimated range. The primary growth drivers are demographic and lifestyle: an aging Brazilian population, rising awareness of caffeine’s impact on sleep and anxiety, and a deepening of café culture that normalizes decaf consumption among younger, urban cohorts. The specialty tier—Swiss Water, CO₂ processed, single‑origin, organic—will outgrow the mainstream segment, potentially representing 20–25% of volume but 35–40% of value by 2035.
Pod/capsule formats are set to gain share at the expense of ground coffee, especially as Nespresso-compatible and Dolce Gusto-compatible systems proliferate. Decaf pods will likely reach 30% of category volume by 2035, up from about 20% today. At-home consumption will remain the dominant end-use, but foodservice share could rise to 22–25% as more Brazilian cafés invest in decaf espresso programs.
Import dependence will persist at around 70–80% because no large-scale Swiss Water or CO₂ plant is anticipated within Brazil before 2030; however, if a major roaster or a global decaf processor were to invest in a local facility post‑2030, the structure could shift materially. Price trends will be moderately upward, driven by rising green bean commodity costs (climate‑related supply pressure) and the mix shift toward premium processes. Private-label penetration may reach 30–35% of retail volume, keeping mainstream pricing competitive.
Overall, the decaf category in Brazil will remain a growth niche but will become increasingly visible in coffee aisles, foodservice menus, and e‑commerce catalogs.
Several clear opportunities exist for participants in Brazil’s decaf market. The largest white‑space is domestic decaffeination infrastructure. Establishing a mid‑scale Swiss Water or CO₂ facility in Brazil (with a capacity of 5,000–10,000 tonnes/year) would serve the local market with lower lead times, lower cost (eliminating round‑trip shipping), and enable a “product of Brazil” origin story for export to other South American markets. Investment interest from global decaf technology licensors and Brazilian coffee cooperatives remains plausible within the forecast period.
A second opportunity lies in the foodservice channel: tailor‑made decaf blends for coffee‑shop chains and hotels that are currently underserved by generic imported products. A roaster capable of offering single‑origin Brazilian decaf, with traceability back to a specific farm, could create a strong premium proposition at BRL 5–8 per cup. Third, the e‑commerce and subscription model offers a direct path to bypass retail shelf constraints; brands that build a loyal online following for decaf can achieve higher margins and recurring revenue.
Fourth, private‑label partnerships with supermarket chains (GPA, Carrefour, Assaí) that are expanding their own‑brand coffee lines represent a volume growth play. Finally, educational marketing—blind taste tests, barista workshops, and health professional endorsements—can accelerate consumer adoption by breaking the taste‑compromise stigma. The decaf market in Brazil, while small, is underserved relative to consumer interest, offering above‑average growth rates for those who invest in quality, transparency, and channel specificity.
This report is an independent strategic category study of the market for caffeine free decaf coffee in Brazil. It is designed for brand owners, general managers, category leaders, trade-marketing teams, e-commerce teams, retail partners, distributors, investors, and market entrants that need a clear read on where growth sits, which brands control the category, how pricing and promotion shape demand, and which channels matter most for scale and margin.
The framework is built for Packaged Food & Beverage markets within consumer goods, where performance is driven by need states, shopper missions, brand hierarchies, price-pack architecture, retail execution, promotional intensity, and route-to-market control rather than by a narrow technical specification alone. It defines caffeine free decaf coffee as Coffee that has undergone a decaffeination process to remove at least 97% of its caffeine content, targeting consumers seeking the taste and ritual of coffee without caffeine’s stimulant effects and maps the market through category boundaries, consumer segments, usage occasions, channel structure, brand and private-label positions, supply and availability logic, pricing and promotion mechanics, and country-level commercial roles. Historical analysis typically covers 2012 to 2025, with forward-looking scenarios through 2035.
This report is designed to answer the questions that matter most to brand, category, channel, and strategy teams in consumer-goods markets.
At its core, this report explains how the market for caffeine free decaf coffee actually works as a consumer category. It is built to show where demand comes from, which need states and shopper missions matter most, which brands and private-label players shape the category, which channels control visibility and conversion, and where pricing power, repeat purchase, and margin are actually created.
Rather than framing the category through narrow technical attributes, the study breaks it into decision-grade commercial layers: product format, benefit platform, shopper segment, purchase occasion, pack-price architecture, channel environment, promotional intensity, route-to-market control, and company archetype. It is therefore useful both for teams shaping portfolio strategy and for teams executing growth through Household Grocery Shopper, Foodservice Procurement Manager, Office Manager, Online Subscription Buyer, and Gift Giver.
The report also clarifies how value pools differ across Morning/Evening beverage ritual, Social drinking occasions, Office/Workplace consumption, and Restaurant & café menu item, how premiumization and private label reshape category economics, how retail concentration and route-to-market design affect scale, and which countries matter most for brand building, sourcing, packaging, and channel expansion.
The report is based on an independent market-intelligence methodology that combines category reconstruction, public company evidence, retail and channel mapping, pricing review, and multi-layer triangulation. It is built for consumer categories where no single public dataset captures the real structure of demand, brand power, promotion, and channel control.
The evidence stack typically combines company disclosures, investor materials, brand and retailer product pages, e-commerce assortment checks, packaging and claims analysis, public pricing references, trade statistics where relevant, regulatory and labeling guidance, and observable route-to-market evidence from distributors, retailers, merchandisers, and marketplace ecosystems.
The analytical model then reconstructs the category across the layers that matter commercially: category scope, shopper need states, consumer segments, pack-price ladders, brand and private-label hierarchy, channel power, promotional intensity, route-to-market design, and country role differences.
Special attention is given to Health-conscious consumption (caffeine reduction), Evening/afternoon consumption occasions, Doctor/practitioner recommendations, Aging population preferences, Pregnancy and nursing guidelines, and Anxiety and sleep sensitivity trends. The objective is not only to size the market, but to explain where value pools sit, which segments drive mix and repeat purchase, which channels shape growth, and how leading brands defend or expand their positions across Household Grocery Shopper, Foodservice Procurement Manager, Office Manager, Online Subscription Buyer, and Gift Giver.
The report does not rely on survey-based opinion as its core evidence base. Instead, it uses observable commercial signals and structured public evidence to build a decision-grade view for brand, category, retail, e-commerce, investment, and market-entry teams.
This report defines caffeine free decaf coffee as Coffee that has undergone a decaffeination process to remove at least 97% of its caffeine content, targeting consumers seeking the taste and ritual of coffee without caffeine’s stimulant effects and treats it as a branded consumer category rather than as a narrow technical product class. The objective is to capture the real commercial market that category, brand, trade-marketing, and channel teams are managing.
Scope is determined by how the category is sold, merchandised, priced, and chosen in market. That means the report follows product formats, claims, price tiers, pack architecture, need states, and retail environments that shape Morning/Evening beverage ritual, Social drinking occasions, Office/Workplace consumption, and Restaurant & café menu item.
The study deliberately separates the category from adjacent baskets when they distort the economics or shopper logic of the market being measured. Typical exclusions therefore include Naturally low-caffeine coffee varieties (e.g., Laurina), Coffee substitutes (e.g., chicory, barley, dandelion root), Caffeinated coffee products, Ready-to-drink (RTD) decaf coffee beverages, Decaf tea or other decaffeinated products, Herbal teas, Caffeine-free sodas and beverages, Decaf espresso machines or brewers, Coffee flavorings and syrups, and Nutritional supplements or caffeine pills.
The report provides focused coverage of the Brazil market and positions Brazil within the wider global consumer-goods industry structure.
The geographic analysis explains local consumer demand conditions, brand and private-label balance, retail concentration, pricing tiers, import dependence, and the country’s strategic role in the wider category.
This study is designed for strategic and commercial users across brand-led consumer categories, including:
In many brand-driven, channel-sensitive, and consumer-demand-led markets, official trade and production statistics are not sufficient on their own to describe the true market. Product boundaries may cut across multiple tariff codes, several product categories may be bundled into the same official classification, and a meaningful share of activity may take place through customized services, captive supply, platform relationships, or technically specialized channels that are not directly visible in standard statistical datasets.
For this reason, the report is designed as a modeled strategic market study. It uses official and public evidence wherever it is reliable and scope-compatible, but it does not force the market into a purely statistical framework when doing so would reduce analytical quality. Instead, it reconstructs the market through the logic of demand, supply, technology, country roles, and company behavior.
This makes the report particularly well suited to products that are innovation-intensive, technically differentiated, capacity-constrained, platform-dependent, or commercially structured around specialized buyer-supplier relationships rather than standardized commodity trade.
The report typically includes:
Exchange Rates UK Research’s latest May 2026 survey of major investment banks shows the USD/JPY exchange rate is expected to gradually decline from current levels near 159.00 towards the 145–150 region through 2027, signalling expectations for a broader Japanese yen recovery after several years of sustained weakness.
The latest poll also suggests banks increasingly believe the peak in USD/JPY may already have passed, although most institutions still expect the pair to remain historically elevated compared with pre-2022 levels.
The majority of forecasts in the latest Exchange Rates UK Research poll point towards a steady decline in USD/JPY over the coming quarters.
Banks including Citi, RBC Capital Markets, Scotiabank and Rabobank all expect the pair to move below 150 during 2027, while some forecasts extend towards the low-140s longer term.
Even institutions that remain more constructive on the US dollar, such as Goldman Sachs and CIBC, still project USD/JPY drifting lower from current levels.
Overall, the survey suggests banks increasingly expect the Japanese yen to regain some ground after a prolonged period of depreciation.
That outlook follows a remarkable multi-year rise in USD/JPY.
The pair traded below 130 as recently as 2022 before surging above 160 during 2025 and 2026 as widening interest rate differentials heavily favoured the US dollar.
Although USD/JPY remains close to multi-decade highs, recent price action suggests momentum has started to slow. April saw the pair retreat from above 160 towards the mid-150s before rebounding modestly during May.
Bank of Japan Policy Shift Remains Central Theme
The latest survey highlights how heavily the USD/JPY outlook continues to depend on monetary policy divergence between the Federal Reserve and Bank of Japan.
For several years, ultra-low Japanese interest rates encouraged investors to fund trades in yen and buy higher-yielding assets elsewhere, contributing to sustained yen weakness.
However, markets increasingly expect the Bank of Japan to continue gradually normalising policy after ending negative interest rates last year.
At the same time, investors are beginning to anticipate a slower US economy and eventual Federal Reserve rate cuts during 2026 and 2027.
That combination has started to narrow yield differentials slightly, helping stabilise the yen after years of sharp losses.
Markets also remain highly sensitive to the risk of Japanese government intervention whenever USD/JPY approaches or moves above the 160 level, which has helped limit further upside in recent months.
The latest Exchange Rates UK Research survey suggests the broader trend in USD/JPY is gradually turning lower, with most banks expecting further yen recovery through 2026 and 2027.
However, forecasts still remain well above historical averages.
Even many of the more bearish USD/JPY projections imply the pair will remain significantly above the 110–130 trading ranges that dominated before the global inflation and interest rate cycle began.
For now, the survey points to gradual yen appreciation rather than a rapid reversal.
But with markets increasingly focused on Bank of Japan policy normalisation and the possibility of eventual US rate cuts, sentiment towards the yen appears to be improving for the first time in several years.
China’s unsweetened cold brew coffee market sits at the intersection of three powerful consumer‑goods currents: the rapid expansion of the domestic coffee culture, the broad‑based shift toward reduced‑sugar and functional beverages, and the premiumization of everyday refreshment. Unlike traditional hot‑brewed coffee or sweetened RTD coffee lattes, unsweetened cold brew is positioned as a purer, smoother, less acidic caffeine delivery format that appeals to coffee purists and health‑oriented drinkers alike.
The product is structurally distinct from iced coffee (which is hot‑brewed and cooled) because cold extraction yields a different chemical profile, creating a naturally sweeter perception without added sugar. In China, where tea has historically dominated the hot‑beverage landscape, cold brew has found an enthusiastic reception among urban millennials and Gen Z consumers who value convenience, ingredient transparency and a “clean label” proposition.
The market is still early in its adoption curve relative to mature markets such as the US or Japan, with estimated per‑capita consumption of unsweetened cold brew at fewer than 0.8 litres annually in 2026, but the trajectory points to rapid category expansion driven by distribution widening, format innovation and rising household penetration.
While absolute total market value cannot be stated with precision, the China unsweetened cold brew coffee category exhibited retail‑value growth in the range of 22–30% year‑on‑year over 2024–2025, and available market evidence points to sustained expansion at 18–25% CAGR from 2026 through 2030 before moderating to high‑single‑digit or low‑double‑digit growth in the 2031–2035 period as the category matures. Volume growth is slightly higher than value growth because average unit prices are under mild compression from private‑label entry and scale‑driven cost reduction in packaging and logistics.
The category’s expansion is being propelled by three macro‑demand engines: the steady increase in China’s urban coffee‑drinker population (estimated at over 200 million regular coffee consumers in 2026), the sugar‑reduction regulatory and consumer push that benefits unsweetened products, and the proliferation of chilled‑RTD shelves in convenience stores, which grew by roughly 12–15% annually in store count across tier‑1 and tier‑2 cities during 2023–2025.
Relative to the broader China RTD coffee market, unsweetened cold brew accounted for an estimated 10–14% of total RTD coffee volume in 2026, up from approximately 5–7% in 2022, indicating a structural share shift that is expected to continue. The category’s growth is not uniform across formats: concentrated cold brew (intended for dilution at home) and multi‑serve bottles are growing at 12–18% per year, while single‑serve RTD cans and bottles are expanding faster at 20–28% per year due to on‑the‑go convenience.
Segmentation by product type reveals that RTD unsweetened cold brew in single‑serve format constitutes the largest sub‑segment, capturing an estimated 55–65% of total category volume in 2026. Concentrates, typically sold in 500 mL to 1 L bottles for home refrigeration or office use, account for approximately 20–25% of volume, while nitro‑infused cold brew—served from kegs or packaged in cans with a widget—makes up the remaining 10–15% but is the fastest‑growing format. By application context, on‑the‑go consumption dominates at 60–70% of demand, driven by convenience store purchases, workplace chillers and university campus retail.
At‑home consumption contributes an estimated 20–25%, largely through concentrate purchases and subscription delivery of RTD multipacks. The office and workplace segment, while currently modest at 10–15%, is showing above‑average growth as corporate purchasers adopt cold‑brew dispensers and partner with specialty suppliers to offer free‑flow unsweetened coffee to employees. By value‑chain tier, branded CPG products hold the largest share at roughly 55–65% of retail value, followed by specialty and craft brands at 20–25% and private‑label/store‑brand products at 10–15%.
Private‑label share is rising rapidly from a low base as major retail chains (including Hema, Sam’s Club and Yonghui) launch their own unsweetened cold brew SKUs, capitalizing on co‑packing capacity and consumer willingness to trade down on brand for a lower price point in a category perceived as commodity‑adjacent.
Pricing in China’s unsweetened cold brew market spans four distinct tiers. The private‑label/value tier retails at ¥8–12 per 300 mL can or bottle, typically sold in hypermarket multipacks and discount e‑commerce channels. Mainstream brand tier products, offered by national CPG coffee players and major beverage corporations, are priced at ¥12–18 per 300 mL single serve. Premium/specialty tier items, from roaster‑owned brands and dedicated cold‑brew pure‑plays, command ¥18–28 per 300 mL. The ultra‑premium/craft tier, comprising nitro‑infused cans and limited‑batch single‑origin cold brews, reaches ¥28–42 per 300 mL.
The wholesale price for a generic unsweetened cold brew concentrate sold to foodservice operators is estimated at ¥35–55 per litre, depending on coffee origin concentration and packaging format. The principal cost driver is green arabica bean cost, which historically represents 30–40% of total raw‑material cost for a cold‑brew producer in China. Global arabica prices have shown elevated volatility in the 2024–2026 period, fluctuating in a range of plus or minus 20–25% year‑on‑year due to climate‑driven supply concerns in Brazil and Colombia.
Other significant cost elements include refrigerated logistics (15–25% of landed cost), specialized aseptic or nitrogen‑infusion packaging (12–18%), and co‑packing toll fees (10–15%). China’s import structure means that most high‑quality arabica beans incur a most‑favoured‑nation tariff of 8–12% on green beans and 12–15% on roasted beans, though beans from certain origins (e.g., Ethiopia under the Belt and Road trade facilitation framework) may benefit from reduced rates.
The competitive landscape in China’s unsweetened cold brew market is fragmented but consolidating around three archetypes. Global brand owners and category leaders—including Starbucks (via its RTD partnership with Nestlé), Nestlé’s Nescafé and Blue Bottle units, and Coca‑Cola’s Costa Coffee brand—compete through distribution scale, cold‑chain infrastructure and established retail relationships. Starbucks’ RTD unsweetened cold brew is widely available in convenience stores and e‑commerce platforms, often serving as the category reference point for mainstream consumers.
Large coffee‑focused CPG companies such as Luckin Coffee’s retail arm, Tim Hortons China (owned by Cartesian Capital) and Manner Coffee have launched unsweetened RTD cold brew products, leveraging their roastery networks and brand equity from café operations. Specialty and craft cold‑brew pure‑plays—including domestic brands such as Seesaw Coffee, M Stand and a growing number of DTC‑focused digital‑native brands like Yongpu Coffee and Sanrio Coffee—compete on bean origin stories, brewing technique and premium packaging.
These brands typically command the ultra‑premium price tier and distribute heavily through Tmall, JD.com and Douyin livestream. Value and private‑label specialists, including major retail banners’ own brands and regional co‑packers, are gaining share by offering unsweetened cold brew at ¥8–12 per unit, often using a blend of Yunnan arabica and imported robusta to manage cost. Competition is intensifying on two fronts: distribution access to limited chilled shelf space in convenience stores, and brand storytelling around “no added sugar,” “single origin” and “cold extraction” attributes that command higher margins.
China possesses a modest but growing base of domestic cold‑brew production capacity, concentrated in manufacturing clusters in Jiangsu (Suzhou and Wuxi), Guangdong (Shenzhen and Guangzhou) and Shanghai’s surrounding industrial parks. These facilities are mostly contract manufacturers (co‑packers) that serve both branded CPG clients and private‑label programs, with total estimated cold‑brew production capacity of approximately 120–180 million litres per year as of early 2026, of which 60–70% is utilized.
The cold‑brewing process in China uses dedicated extraction equipment—cold steep tanks with temperature control, fine‑mesh filtration systems, and nitrogen infusion rigs for nitro variants—that represent a capital investment of ¥8–15 million per production line for a mid‑scale co‑packer. Domestic production relies heavily on imported green arabica beans because Yunnan’s annual output (roughly 120,000–140,000 tonnes of green coffee, mostly robusta and lower‑grade arabica) supplies only an estimated 20–30% of the input needed for the unsweetened cold brew category; the balance is imported.
Yunnan’s share is expected to rise as the provincial government promotes fine‑flavor arabica planting, but variety and cup‑quality limitations mean that premium cold‑brew producers will continue to rely on imported beans for the foreseeable future. Water quality, energy costs and wastewater treatment compliance are operational factors that influence production economics, with food‑safety certification (HACCP, ISO 22000) becoming a baseline requirement for co‑packer selection by major retail and CPG buyers.
China’s unsweetened cold brew coffee market is structurally import‑dependent for raw material—green coffee beans—rather than for finished cold‑brew products. Finished RTD unsweetened cold brew is imported in relatively small volumes, primarily from South Korea, Japan and the United States, with total finished‑product import volumes estimated at 8–12 million litres in 2025, equivalent to roughly 10–15% of domestic consumption.
These imports serve the premium and ultra‑premium tiers, with brands such as Starbucks Japan’s unsweetened cold brew, Blue Bottle’s RTD line and US‑based Stumptown and Chameleon Cold‑Brew available in specialty grocery stores and imported‑food e‑commerce platforms. Green coffee bean imports (HS 090111) provide the structural backbone of supply, with China importing approximately 190,000–220,000 tonnes of green coffee annually in 2024–2025, of which an estimated 15–20% is used for cold‑brew production, the rest for hot‑brew and soluble coffee.
The primary origins are Brazil (30–35%), Ethiopia (15–20%), Colombia (12–15%), Vietnam (10–12%, mostly robusta) and Yunnan domestic supply (10–12%). Import duties on green coffee beans are approximately 8% MFN, with preferential rates available under the Regional Comprehensive Economic Partnership (RCEP) for ASEAN‑origin beans. Finished RTD coffee beverages (HS 210111) face a higher MFN tariff of 12–15%, plus a 13% VAT, making import of finished unsweetened cold brew significantly more expensive than domestic production.
Export of unsweetened cold brew from China is negligible as of 2026, though a small volume of concentrate is shipped to Chinese diaspora markets in Southeast Asia and Australia.
Distribution of unsweetened cold brew in China follows a dual‑track model. The primary track for mainstream and value‑tier products is the convenience store channel, which accounts for an estimated 35–45% of category volume. The top five chains—China Convenience Store (Meiyijia), FamilyMart, Lawson, 7‑Eleven and Suning—collectively operate over 35,000 stores in tier‑1 and tier‑2 cities, each typically allocating 2–4 chilled facings to cold coffee. E‑commerce is the second major channel at 40–50% of value, led by Tmall Supermarket, JD.com’s cold‑chain delivery service and Douyin livestream flash sales.
E‑commerce is particularly important for premium and craft brands that cannot secure convenience‑store shelf space, and for concentrate/subscription models. Hypermarkets and large‑format grocery stores (Hema, Sam’s Club, Walmart, Carrefour) contribute an estimated 10–15% of volume, primarily through multipack and value‑size bottles. Foodservice accounts for a smaller share (3–5%) but is growing as independent cafés and corporate offices adopt cold‑brew taps and single‑serve nitro cans.
Key buyer groups include end consumers (health‑conscious urban professionals, coffee purists seeking low‑acid options, and younger drinkers exploring coffee culture), retail buyers (category managers at convenience chains and e‑commerce platforms who manage chilled‑aisle planograms), foodservice operators (café chains, restaurant groups, hotel beverage programs) and corporate purchasers (HR and procurement managers contracting office coffee services). Retail buyers exert significant influence over category growth by deciding shelf allocation, listing fees and promotional calendar slots, making trade marketing a critical success factor.
The regulatory framework governing unsweetened cold brew in China centers on the national food‑safety standard GB 2760 for food additives (which heavily restricts sweeteners in a product labeled “unsweetened”), GB 7718 for pre‑packaged food labeling, and the general beverage standard GB 7101 for RTD coffee products. Importantly, GB 28050 (nutrition labeling) requires that any product marketed as “unsweetened” must meet the definition of “free of added sugar” meaning less than 0.5 g of sugar per 100 mL from added sources, and the nutritional‑facts panel must clearly declare sugar content.
Caffeine content labeling is not yet mandatory for RTD coffee in China, but industry practice and regulatory guidance (from the National Health Commission’s 2023 advisory on high‑caffeine beverages) encourage disclosure for products exceeding 200 mg of caffeine per serving, which applies to some concentrated cold‑brew formats. Products must also comply with GB 19296 for coffee beverage quality standards, which specify minimum coffee solids content (≥2.5% for RTD coffee) and permissible extraction methods. Organic certification follows GB/T 19630, and fair‑trade labeling is voluntary but carries credibility with the premium buyer segment.
Imported finished cold brew must undergo CNCA registration for overseas production facilities and CIQ inspection at port of entry, with random testing for pesticide residues, ochratoxin A and heavy metals. Domestic producers must hold a food‑production license (SC certification) and are subject to local market‑regulation bureau inspections. The regulatory environment is generally supportive of clean‑label, unsweetened products, aligning with the government’s Healthy China 2030 initiative that encourages reduced sugar consumption.
Over the 2026–2035 forecast period, China’s unsweetened cold brew coffee market is expected to follow an S‑curve adoption pattern. The high‑growth phase (2026–2030) will see annual volume expansion in the 18–25% range, driven by distribution deepening in tier‑2 and tier‑3 cities, increased household penetration of refrigeration, and continued sugar‑reduction regulation that favors unsweetened products. By 2030, category volume is projected to reach roughly 2.5–3.5 times the 2026 level.
The maturation phase (2031–2035) will see growth moderate to 7–12% annually as the category reaches wider consumer acceptance and retail availability approaches saturation in the top‑tier cities. During this later phase, value growth is likely to exceed volume growth as premiumization intensifies—consumers trade up to single‑origin, nitro‑infused and specialty craft offerings—and private‑label share stabilizes at an estimated 20–25% of volume. The segment mix will shift: nitro‑infused cold brew is forecast to capture 20–25% of volume by 2035, up from 10–15% in 2026, while concentrates may lose share to ready‑to‑drink convenience formats.
By 2035, unsweetened cold brew could represent 25–35% of total China RTD coffee volume, a significant increase from the 2026 estimate of 10–14%. E‑commerce is projected to remain the largest single channel at 35–40% of value, while convenience stores moderate to 30–35% as fresh‑food retail and vending‑machine channels expand. The overall market trajectory is upward but not without risk: any significant arabica price shock, regression in consumer health preferences, or regulatory tightening on caffeine marketing could temper the growth rate by 3–5 percentage points in any given year.
Several structural opportunities define the forward landscape for unsweetened cold brew in China. The first is the “white space” in tier‑3 and lower‑tier cities, where cold‑brew awareness and availability are minimal but coffee‑culture adoption is accelerating through social media and domestic café chains. Early‑moving brands that invest in cold‑chain distribution to these markets and price competitively (¥10–14 per unit) can capture first‑mover advantages before private‑label and legacy CPG competitors scale.
The second opportunity lies in product format innovation beyond the current RTD/concentrate/nitro triad: cold‑brew sachets for home carbonation, single‑serve cold‑brew pods compatible with existing water‑dispenser systems, and functional cold‑brew variants (e.g., added collagen, adaptogens, or electrolytes) that target specific wellness occasions while maintaining a no‑added‑sugar claim. The third opportunity is the convergence of unsweetened cold brew with China’s rapidly growing foodservice and office‑coffee segments.
Corporate wellness programs and office coffee services are expanding at 15–20% annually in the largest cities, and unsweetened cold‑brew kegs or bulk dispensers offer a higher‑margin, lower‑effort alternative to hot‑brew drip systems. Fourth, the private‑label opportunity for major retail chains remains underexploited: while Hema and Sam’s Club have introduced own‑label unsweetened cold brew, most provincial grocery chains, convenience store banners and membership‑club retailers have not yet launched a private‑label SKU, creating a window for co‑packers to pitch turnkey programs.
Finally, export opportunities for Chinese‑produced unsweetened cold brew concentrate to Southeast Asia and Australia are underappreciated, particularly as Chinese co‑packers achieve scale and cost competitiveness that could undercut regional producers in those markets. Each of these opportunities requires targeted investment in cold‑chain logistics, co‑packing partnerships, and consumer education that emphasizes the taste and digestive benefits of unsweetened cold extraction.
This report is an independent strategic category study of the market for unsweetened cold brew coffee in China. It is designed for brand owners, general managers, category leaders, trade-marketing teams, e-commerce teams, retail partners, distributors, investors, and market entrants that need a clear read on where growth sits, which brands control the category, how pricing and promotion shape demand, and which channels matter most for scale and margin.
The framework is built for Ready-to-Drink (RTD) Coffee markets within consumer goods, where performance is driven by need states, shopper missions, brand hierarchies, price-pack architecture, retail execution, promotional intensity, and route-to-market control rather than by a narrow technical specification alone. It defines unsweetened cold brew coffee as Ready-to-drink coffee beverages made by steeping ground coffee in cold water for an extended period, resulting in a concentrated, smooth, and less acidic coffee extract, packaged without added sugar or sweeteners and maps the market through category boundaries, consumer segments, usage occasions, channel structure, brand and private-label positions, supply and availability logic, pricing and promotion mechanics, and country-level commercial roles. Historical analysis typically covers 2012 to 2025, with forward-looking scenarios through 2035.
This report is designed to answer the questions that matter most to brand, category, channel, and strategy teams in consumer-goods markets.
At its core, this report explains how the market for unsweetened cold brew coffee actually works as a consumer category. It is built to show where demand comes from, which need states and shopper missions matter most, which brands and private-label players shape the category, which channels control visibility and conversion, and where pricing power, repeat purchase, and margin are actually created.
Rather than framing the category through narrow technical attributes, the study breaks it into decision-grade commercial layers: product format, benefit platform, shopper segment, purchase occasion, pack-price architecture, channel environment, promotional intensity, route-to-market control, and company archetype. It is therefore useful both for teams shaping portfolio strategy and for teams executing growth through End Consumers (Health-conscious, Coffee Purists), Retail Buyers (Category Managers), Foodservice Operators, and Corporate Purchasers (for offices).
The report also clarifies how value pools differ across Immediate consumption, Caffeine delivery, Refreshment, and Meal accompaniment, how premiumization and private label reshape category economics, how retail concentration and route-to-market design affect scale, and which countries matter most for brand building, sourcing, packaging, and channel expansion.
The report is based on an independent market-intelligence methodology that combines category reconstruction, public company evidence, retail and channel mapping, pricing review, and multi-layer triangulation. It is built for consumer categories where no single public dataset captures the real structure of demand, brand power, promotion, and channel control.
The evidence stack typically combines company disclosures, investor materials, brand and retailer product pages, e-commerce assortment checks, packaging and claims analysis, public pricing references, trade statistics where relevant, regulatory and labeling guidance, and observable route-to-market evidence from distributors, retailers, merchandisers, and marketplace ecosystems.
The analytical model then reconstructs the category across the layers that matter commercially: category scope, shopper need states, consumer segments, pack-price ladders, brand and private-label hierarchy, channel power, promotional intensity, route-to-market design, and country role differences.
Special attention is given to Health & wellness trends (sugar reduction), Convenience of RTD format, Premiumization of coffee, Growth of at-home coffee occasions, and Consumer perception of ‘smoother’ and less acidic coffee. The objective is not only to size the market, but to explain where value pools sit, which segments drive mix and repeat purchase, which channels shape growth, and how leading brands defend or expand their positions across End Consumers (Health-conscious, Coffee Purists), Retail Buyers (Category Managers), Foodservice Operators, and Corporate Purchasers (for offices).
The report does not rely on survey-based opinion as its core evidence base. Instead, it uses observable commercial signals and structured public evidence to build a decision-grade view for brand, category, retail, e-commerce, investment, and market-entry teams.
This report defines unsweetened cold brew coffee as Ready-to-drink coffee beverages made by steeping ground coffee in cold water for an extended period, resulting in a concentrated, smooth, and less acidic coffee extract, packaged without added sugar or sweeteners and treats it as a branded consumer category rather than as a narrow technical product class. The objective is to capture the real commercial market that category, brand, trade-marketing, and channel teams are managing.
Scope is determined by how the category is sold, merchandised, priced, and chosen in market. That means the report follows product formats, claims, price tiers, pack architecture, need states, and retail environments that shape Immediate consumption, Caffeine delivery, Refreshment, and Meal accompaniment.
The study deliberately separates the category from adjacent baskets when they distort the economics or shopper logic of the market being measured. Typical exclusions therefore include Sweetened, flavored, or dairy-added RTD coffee drinks, Hot coffee beverages, Instant coffee products, Coffee beans and ground coffee for home brewing, Foodservice/fountain cold brew sold by the cup, Energy drinks, Kombucha, Sparkling water, RTD tea, and Plant-based milk beverages.
The report provides focused coverage of the China market and positions China within the wider global consumer-goods industry structure.
The geographic analysis explains local consumer demand conditions, brand and private-label balance, retail concentration, pricing tiers, import dependence, and the country’s strategic role in the wider category.
This study is designed for strategic and commercial users across brand-led consumer categories, including:
In many brand-driven, channel-sensitive, and consumer-demand-led markets, official trade and production statistics are not sufficient on their own to describe the true market. Product boundaries may cut across multiple tariff codes, several product categories may be bundled into the same official classification, and a meaningful share of activity may take place through customized services, captive supply, platform relationships, or technically specialized channels that are not directly visible in standard statistical datasets.
For this reason, the report is designed as a modeled strategic market study. It uses official and public evidence wherever it is reliable and scope-compatible, but it does not force the market into a purely statistical framework when doing so would reduce analytical quality. Instead, it reconstructs the market through the logic of demand, supply, technology, country roles, and company behavior.
This makes the report particularly well suited to products that are innovation-intensive, technically differentiated, capacity-constrained, platform-dependent, or commercially structured around specialized buyer-supplier relationships rather than standardized commodity trade.
The report typically includes:
This report is an independent strategic category study of the market for organic whole bean coffee in China. It is designed for brand owners, general managers, category leaders, trade-marketing teams, e-commerce teams, retail partners, distributors, investors, and market entrants that need a clear read on where growth sits, which brands control the category, how pricing and promotion shape demand, and which channels matter most for scale and margin.
The framework is built for packaged food & beverage markets within consumer goods, where performance is driven by need states, shopper missions, brand hierarchies, price-pack architecture, retail execution, promotional intensity, and route-to-market control rather than by a narrow technical specification alone. It defines organic whole bean coffee as Whole coffee beans sold in retail packaging, roasted from organically certified green coffee, targeting at-home consumption and maps the market through category boundaries, consumer segments, usage occasions, channel structure, brand and private-label positions, supply and availability logic, pricing and promotion mechanics, and country-level commercial roles. Historical analysis typically covers 2012 to 2025, with forward-looking scenarios through 2035.
This report is designed to answer the questions that matter most to brand, category, channel, and strategy teams in consumer-goods markets.
At its core, this report explains how the market for organic whole bean coffee actually works as a consumer category. It is built to show where demand comes from, which need states and shopper missions matter most, which brands and private-label players shape the category, which channels control visibility and conversion, and where pricing power, repeat purchase, and margin are actually created.
Rather than framing the category through narrow technical attributes, the study breaks it into decision-grade commercial layers: product format, benefit platform, shopper segment, purchase occasion, pack-price architecture, channel environment, promotional intensity, route-to-market control, and company archetype. It is therefore useful both for teams shaping portfolio strategy and for teams executing growth through Grocery shopper (primary), E-commerce shopper, Foodservice buyer, Corporate procurement, and Gift purchaser.
The report also clarifies how value pools differ across Drip/Pour-over brewing, Espresso brewing, and French press/Cold brew, how premiumization and private label reshape category economics, how retail concentration and route-to-market design affect scale, and which countries matter most for brand building, sourcing, packaging, and channel expansion.
The report is based on an independent market-intelligence methodology that combines category reconstruction, public company evidence, retail and channel mapping, pricing review, and multi-layer triangulation. It is built for consumer categories where no single public dataset captures the real structure of demand, brand power, promotion, and channel control.
The evidence stack typically combines company disclosures, investor materials, brand and retailer product pages, e-commerce assortment checks, packaging and claims analysis, public pricing references, trade statistics where relevant, regulatory and labeling guidance, and observable route-to-market evidence from distributors, retailers, merchandisers, and marketplace ecosystems.
The analytical model then reconstructs the category across the layers that matter commercially: category scope, shopper need states, consumer segments, pack-price ladders, brand and private-label hierarchy, channel power, promotional intensity, route-to-market design, and country role differences.
Special attention is given to Health & wellness trends, Premiumization & experience-seeking, Sustainability & ethical sourcing, Home café culture, and Brand storytelling & provenance. The objective is not only to size the market, but to explain where value pools sit, which segments drive mix and repeat purchase, which channels shape growth, and how leading brands defend or expand their positions across Grocery shopper (primary), E-commerce shopper, Foodservice buyer, Corporate procurement, and Gift purchaser.
The report does not rely on survey-based opinion as its core evidence base. Instead, it uses observable commercial signals and structured public evidence to build a decision-grade view for brand, category, retail, e-commerce, investment, and market-entry teams.
This report defines organic whole bean coffee as Whole coffee beans sold in retail packaging, roasted from organically certified green coffee, targeting at-home consumption and treats it as a branded consumer category rather than as a narrow technical product class. The objective is to capture the real commercial market that category, brand, trade-marketing, and channel teams are managing.
Scope is determined by how the category is sold, merchandised, priced, and chosen in market. That means the report follows product formats, claims, price tiers, pack architecture, need states, and retail environments that shape Drip/Pour-over brewing, Espresso brewing, and French press/Cold brew.
The study deliberately separates the category from adjacent baskets when they distort the economics or shopper logic of the market being measured. Typical exclusions therefore include Ground coffee, Instant coffee, Coffee pods/capsules, Ready-to-drink (RTD) coffee, Non-organic whole bean coffee, Coffee brewing equipment, Coffee syrups/flavorings, Coffee substitutes (chicory, barley), and Tea and other hot beverages.
The report provides focused coverage of the China market and positions China within the wider global consumer-goods industry structure.
The geographic analysis explains local consumer demand conditions, brand and private-label balance, retail concentration, pricing tiers, import dependence, and the country’s strategic role in the wider category.
This study is designed for strategic and commercial users across brand-led consumer categories, including:
In many brand-driven, channel-sensitive, and consumer-demand-led markets, official trade and production statistics are not sufficient on their own to describe the true market. Product boundaries may cut across multiple tariff codes, several product categories may be bundled into the same official classification, and a meaningful share of activity may take place through customized services, captive supply, platform relationships, or technically specialized channels that are not directly visible in standard statistical datasets.
For this reason, the report is designed as a modeled strategic market study. It uses official and public evidence wherever it is reliable and scope-compatible, but it does not force the market into a purely statistical framework when doing so would reduce analytical quality. Instead, it reconstructs the market through the logic of demand, supply, technology, country roles, and company behavior.
This makes the report particularly well suited to products that are innovation-intensive, technically differentiated, capacity-constrained, platform-dependent, or commercially structured around specialized buyer-supplier relationships rather than standardized commodity trade.
The report typically includes:
Copper started activating profit-taking attempts after recently stabilizing below the 100% Fibonacci extension level at $6.5400, as it is currently drifting toward $6.3000.
We note that the formation of $6.5400 as an additional resistance level, along with the stochastic indicator showing negative momentum by exiting overbought territory, may push the price to continue corrective trading, potentially targeting $6.2400 soon, with initial support located at $6.1000.
The expected trading range for today is between $6.2400 and $6.500
Trend forecast: Bearish
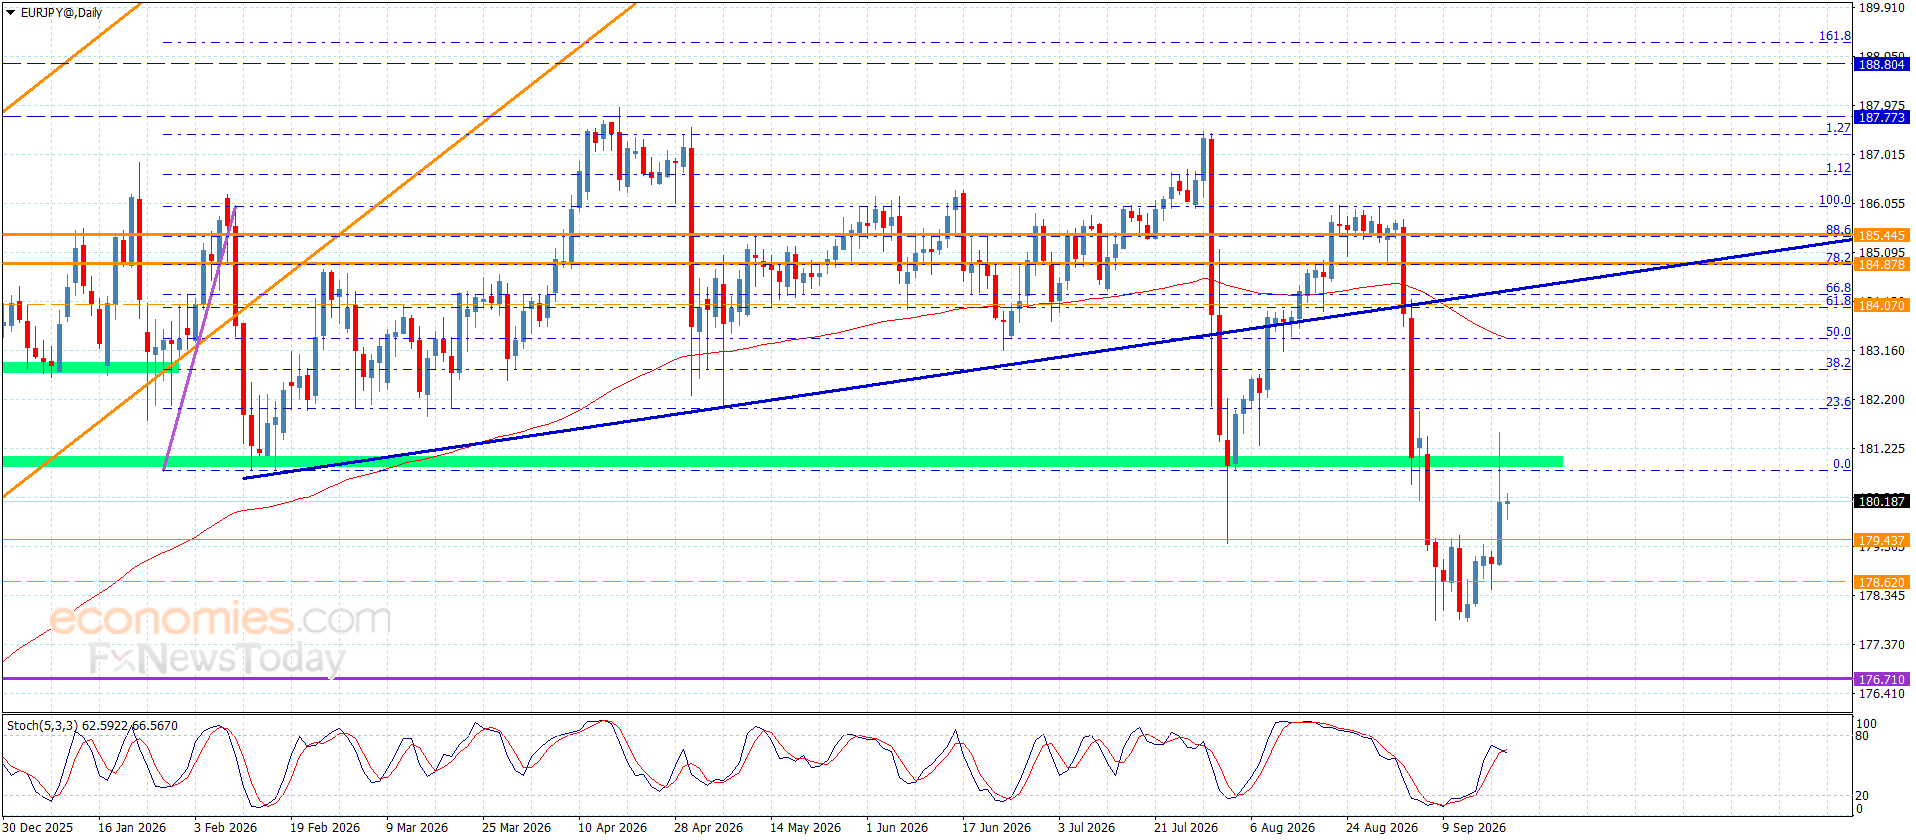
EUR/JPY continues its losing streak for the fourth successive day, trading around 184.40 during the European hours on Friday. The technical analysis of the daily chart indicates the currency cross is positioned slightly below the upper boundary of an emerging descending wedge pattern. The pattern shows lower highs and lower lows; the narrowing price range indicates that selling momentum is losing steam.
The EUR/JPY cross keeps a bearish near-term tone as it holds below both the nine-period and 50-period Exponential Moving Averages (EMAs), respectively. The currency cross has retreated from recent highs, and the 14-day Relative Strength Index (RSI) at 44.70 leans slightly to the downside, suggesting fading bullish momentum rather than an oversold condition.
The EUR/JPY cross may test the immediate barrier at the nine-day EMA of 184.78, followed by the 50-day EMA at 184.87 and the upper boundary of the descending wedge. A successful break above the confluence resistance zone around the wedge would support the EUR/JPY cross to explore the region around the all-time high of 187.95, which was recorded on April 17.
On the downside, the EUR/JPY cross may navigate the region around the 12-week low of 181.87, recorded on March 16, followed by a five-month low of 180.81, which was reached on February 12.
(The technical analysis of this story was written with the help of an AI tool.)
The table below shows the percentage change of Euro (EUR) against listed major currencies today. Euro was the weakest against the Japanese Yen.
| USD | EUR | GBP | JPY | CAD | AUD | NZD | CHF | |
|---|---|---|---|---|---|---|---|---|
| USD | 0.23% | 0.27% | -0.02% | 0.18% | 0.72% | 0.77% | 0.13% | |
| EUR | -0.23% | 0.03% | -0.24% | -0.07% | 0.49% | 0.57% | -0.09% | |
| GBP | -0.27% | -0.03% | -0.25% | -0.09% | 0.46% | 0.52% | -0.13% | |
| JPY | 0.02% | 0.24% | 0.25% | 0.19% | 0.71% | 0.78% | 0.13% | |
| CAD | -0.18% | 0.07% | 0.09% | -0.19% | 0.52% | 0.56% | -0.05% | |
| AUD | -0.72% | -0.49% | -0.46% | -0.71% | -0.52% | 0.07% | -0.58% | |
| NZD | -0.77% | -0.57% | -0.52% | -0.78% | -0.56% | -0.07% | -0.64% | |
| CHF | -0.13% | 0.09% | 0.13% | -0.13% | 0.05% | 0.58% | 0.64% |
The heat map shows percentage changes of major currencies against each other. The base currency is picked from the left column, while the quote currency is picked from the top row. For example, if you pick the Euro from the left column and move along the horizontal line to the US Dollar, the percentage change displayed in the box will represent EUR (base)/USD (quote).
Domestic coffee prices
The price of raw coffee beans in the Central Highlands region in the morning session of May 14, 2026 recorded a very strong simultaneous increase of 1,000 VND per kg in all key localities.
According to market records, the average purchase price for the whole region has now been pushed to the threshold of 88,900 VND per kg. This is an impressive growth momentum that helps the market regain everything lost in the first fluctuating sessions of the week, exceeding the 87,900 VND recorded on May 13, 2026 and the 87,000 VND mark of May 11, 2026.
In Dak Nong province (old), the purchase price has reached the threshold of 89,000 VND per kg, continuing to maintain the position of the locality with the highest price in the region.
Dak Lak and Gia Lai provinces also strongly broke through to 88,900 VND per kg, while the Lam Dong area listed at 88,300 VND per kg after recovering an additional 1,000 VND compared to yesterday’s session.
The excitement of the coffee market takes place in the context that pepper prices still remain stable at 143,000 VND per kg and the USD exchange rate listed at Vietcombank slightly increased by 3 VND to 26,102 VND.
World coffee prices
Bright green covered international futures exchanges in the nearest closing session as the actual shortage of goods became the main driving force for prices.
On the London exchange, Robusta coffee futures for July 2026 delivery surged by another 78 USD, equivalent to 2.24%, closing the session at 3,560 USD per ton, officially setting the highest level in the past 7 weeks.
At the same pace of growth, the New York exchange witnessed Arabica futures for July 2026 delivery edge up another 0.60 cent, equivalent to 0.21%, reaching 280.75 cents per pound. The main impetus for the breakthrough came from Robusta inventories monitored by ICE falling to a record low in the past 2 years with only 3,642 lots on Wednesday, while Arabica inventories also anchored at a 2.5-month low of 471,831 bags.
In addition, the latest report from Cecafe shows that Brazil’s green coffee exports in April decreased by 1.3% compared to the same period last year, reaching 2.76 million bags, further increasing concerns about short-term supply shortages.
The continued closure of the Strait of Hormuz due to geopolitical tensions between the US and Iran is still seriously disrupting the global supply chain, increasing sea transportation costs, insurance and fertilizer prices to very high levels.
Coffee price assessment and forecast
From a market analysis perspective, although coffee prices are in a short-term fever due to technical tightening, long-term surplus factors are still a ghost weighing on price prospects.
Reputable organizations such as Marex Group Plc and StoneX continuously make forecasts about a record crop season for Brazil in the 2026 crop year. 2027 with output possibly reaching 75.9 million sacks, leading to a global surplus scenario of up to 10 million sacks in 2026.
In Vietnam, the export momentum in the first 4 months of the year grew impressively by 15.8%, reaching 810,000 tons, along with forecasts for the 2025 crop year to increase by 6.2% to 30.8 million bags from the USDA, which are still barriers preventing prices from breaking too far from the current resistance zones.
It is predicted that in the coming sessions, coffee prices will continue to be in a state of fierce tug-of-war as speculators balance between the actual inventory shortage and the psychological pressure from the new South American crop line about to flood the market.
The Great British Pound is the oldest currency with European roots in circulation. The Bank of England has been responsible for issuing the notes and coins for more than 300 years, but the story of the pound sterling began even further in the past, in 1489. In 1660, machinery minting was implemented to simplify coin production.
The price of GBP is quite high — the currency is the fifth most valuable in the world. The inflation rate in the UK is low. The country exports machinery, precious metals and minerals, pharmaceuticals, and many other things. These two factors make GBP one of the strongest currencies in the modern world. On Forex, 12,8% of daily trading is performed in GBP.
The US dollar is considered to be the most important currency in the world. You can’t imagine international trade and finance without USD. Many countries have an exchange regime of their own currency anchored to the US dollar.
The most valuable banknote ever known was a $10,000 note. We bet you have seen the famous phrase “In God We Trust.” It was first printed on coins during the American Civil War, and since 1955 you can find it on every coin.
Have you ever seen a “bison nickel” or a five-cent coin? The animal depicted on it was an actual bison living in the Bronx Zoo. In case you need to trace the serial number of a note, the website “Where’s George?” can help you. The two main materials used in USD production are linen (25%) and cotton (75%).
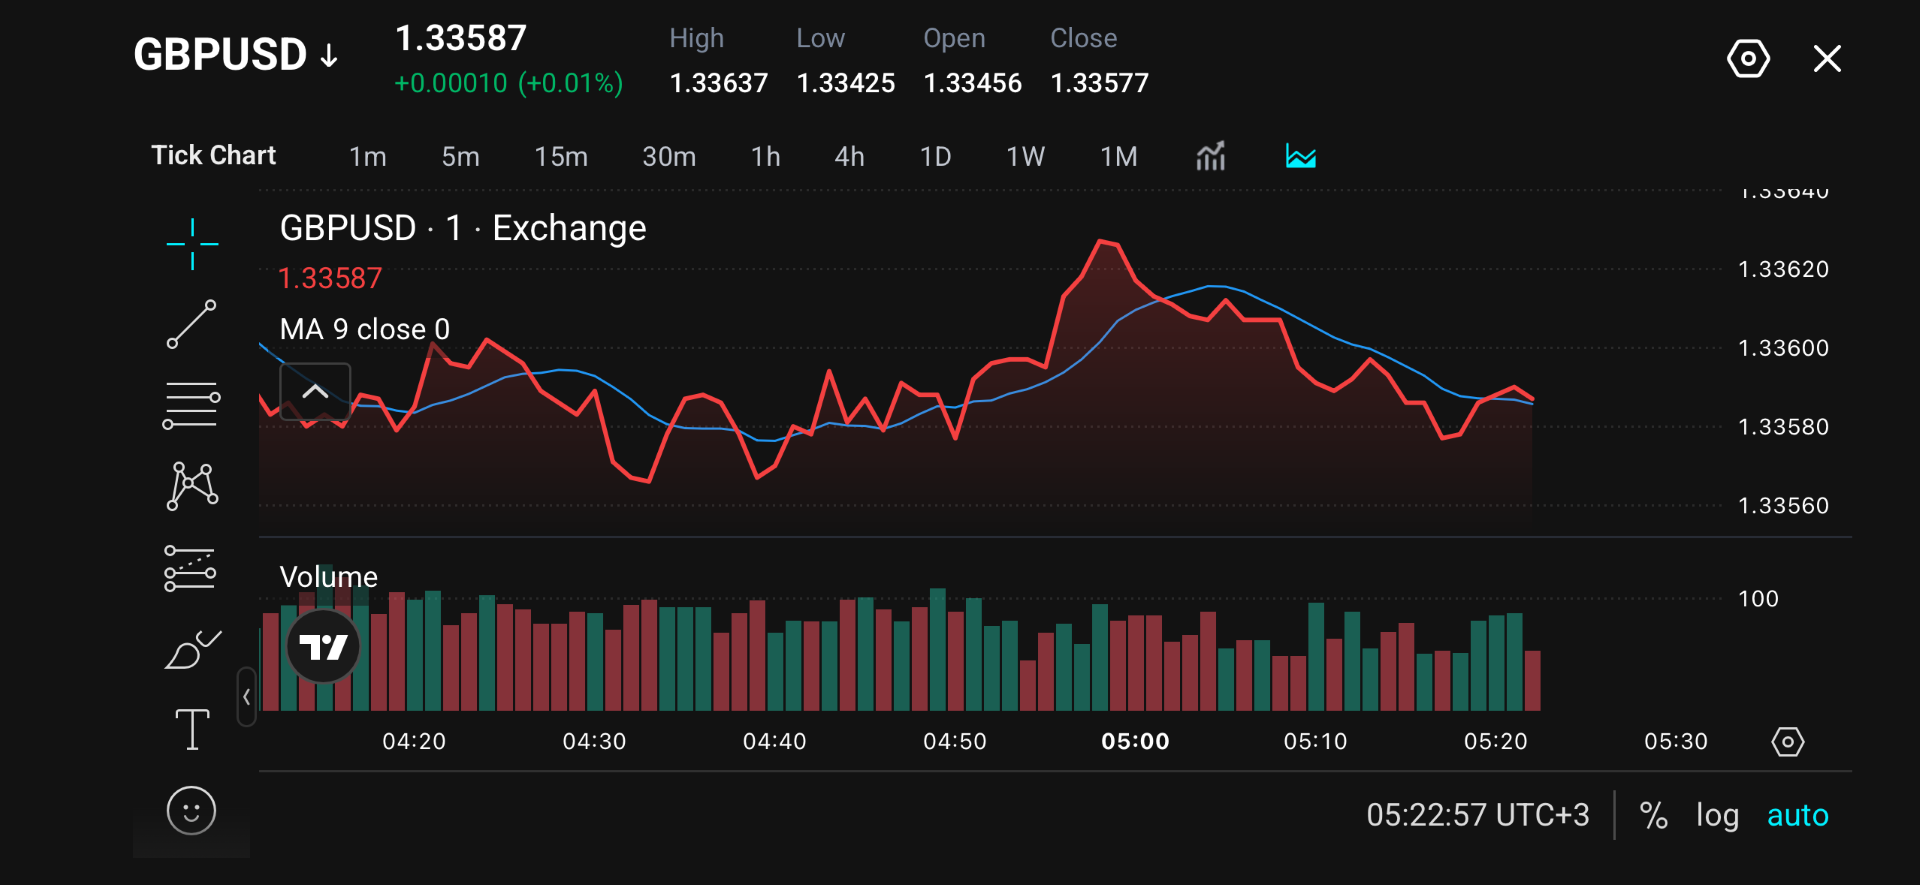
The GBP to USD is the oldest pair in Forex trading history. The GBP/USD rate may be referred to as the cable rate. In the 1880s, the first successfully functioning submarine telegraph cable was placed. It connected the United States and Great Britain.
The best time to trade the pair is during the European and American trading sessions, as well as well as from 15:00 to 19:00 (GMT+3, indicated in LiteFinance trading platform).
Silver (XAG/USD) plunges on Friday, erasing all gains recorded earlier this week as hawkish Federal Reserve (Fed) expectations push US Treasury yields and the US Dollar (USD) higher. At the time of writing, XAG/USD is trading around $76.65, down nearly 8% on the day and hovering near its lowest level in over a week.
The sharp decline comes as the latest US economic data, including stronger-than-expected inflation and resilient consumer spending, strengthened expectations that the Fed could raise interest rates later this year as higher Oil prices linked to ongoing Middle East disruptions continue to fuel inflationary pressures.
According to the CME FedWatch Tool, traders now expect the US central bank to keep interest rates unchanged in the coming months, while pricing in a roughly 42% probability of a rate hike at the December meeting.
Against this backdrop, Silver is expected to maintain a bearish near-term bias as a higher interest rate environment reduces the appeal of non-yielding assets like Silver, while technical indicators suggest bears remain in control.
In the daily chart, XAG/USD retains a capped tone as price holds beneath both the 50-day Simple Moving Average (SMA) at $76.99 and the 100-day SMA at $81.28. The 200-day SMA at $65.04 remains well below the market, suggesting the broader trend is still constructive, but the current pullback is pressuring the short- and medium-term structure.
The Relative Strength Index (14) at 47.37 hovers just below the neutral line, while the Moving Average Convergence Divergence (MACD) indicator stays in positive territory around 0.66 but has eased from recent highs, hinting that bullish momentum is waning rather than strengthening.
On the topside, immediate resistance is located at the 50-day SMA at $76.99, where a sustained break would be needed to alleviate near-term downside pressure, with the next bullish hurdle emerging at the 100-day SMA at $81.28.
On the downside, the main structural support is much lower at the 200-day SMA near $65.04, leaving the metal vulnerable to further corrective slippage if sellers maintain control below the overhanging cluster of shorter-term moving averages.
(The technical analysis of this story was written with the help of an AI tool.)
Silver is a precious metal highly traded among investors. It has been historically used as a store of value and a medium of exchange. Although less popular than Gold, traders may turn to Silver to diversify their investment portfolio, for its intrinsic value or as a potential hedge during high-inflation periods. Investors can buy physical Silver, in coins or in bars, or trade it through vehicles such as Exchange Traded Funds, which track its price on international markets.
Silver prices can move due to a wide range of factors. Geopolitical instability or fears of a deep recession can make Silver price escalate due to its safe-haven status, although to a lesser extent than Gold’s. As a yieldless asset, Silver tends to rise with lower interest rates. Its moves also depend on how the US Dollar (USD) behaves as the asset is priced in dollars (XAG/USD). A strong Dollar tends to keep the price of Silver at bay, whereas a weaker Dollar is likely to propel prices up. Other factors such as investment demand, mining supply – Silver is much more abundant than Gold – and recycling rates can also affect prices.
Silver is widely used in industry, particularly in sectors such as electronics or solar energy, as it has one of the highest electric conductivity of all metals – more than Copper and Gold. A surge in demand can increase prices, while a decline tends to lower them. Dynamics in the US, Chinese and Indian economies can also contribute to price swings: for the US and particularly China, their big industrial sectors use Silver in various processes; in India, consumers’ demand for the precious metal for jewellery also plays a key role in setting prices.
Silver prices tend to follow Gold’s moves. When Gold prices rise, Silver typically follows suit, as their status as safe-haven assets is similar. The Gold/Silver ratio, which shows the number of ounces of Silver needed to equal the value of one ounce of Gold, may help to determine the relative valuation between both metals. Some investors may consider a high ratio as an indicator that Silver is undervalued, or Gold is overvalued. On the contrary, a low ratio might suggest that Gold is undervalued relative to Silver.