The main category of Forex News.
You can use the search box below to find what you need.
[wd_asp id=1]
The main category of Forex News.
You can use the search box below to find what you need.
[wd_asp id=1]
In my view, bets on more BoJ rate hikes, threats of yen intervention, and expectations of Fed rate cuts suggest a negative price outlook. However, the BoJ neutral interest rate and incoming US economic data will be pivotal, given the focus on US-Japan rate differentials.
A higher neutral interest rate level would signal multiple BoJ rate hikes and a narrower US-Japan interest rate differential. A narrower rate differential would likely trigger a yen carry unwind, sending USD/JPY toward 140 over the longer term.
However, upside risks to the bearish outlook include:
These events would send USD/JPY higher. However, the threat of yen interventions is likely to cap the upside at the 158 level, based on the latest communication.
Read the full USD/JPY forecast, including chart setups and trade ideas.
In summary, the USD/JPY trends will hinge on the BoJ’s neutral rate and the Fed rate path.
A neutral rate in the range of 1.5% to 2.5% would suggest a more hawkish BoJ rate path. Additionally, dovish Fed chatter would support expectations of narrower rate differentials, reinforcing the bearish outlook for USD/JPY.
Crucially, a sharply stronger yen could kickstart an unwinding of yen carry trades, which would likely push USD/JPY toward 140 over the longer 6-12 month time horizon.
For more in-depth analysis, review today’s USD/JPY trading setups in our latest reports and consult the economic calendar.
Natural gas fell below the long-term trend indicator, the 200-day average, on Monday and closed below it thereby confirming the breakdown. Today’s clear bearish response shows the sellers continue to dominate despite a potential bullish hammer candle that formed yesterday. A low-end target is at the lower long-term uptrend line, currently at approximately $3.01. Failure of the 200-day average shows selling pressure at a degree that could see the lower uptrend line eventually reached and possibly lower levels.
However, the next lower target zone is around $3.26 to $3.24 (D), consisting of a 78.6% projected target for a falling ABCD pattern and a 78.6% Fibonacci retracement of the full upswing from the August low. Given weakness today, it looks like that target will likely be reached before the bulls take back control. If it fails, then the lower trendline becomes a target. And if that line fails to reverse the descent a 100% projection for the ABCD pattern shows a potential target below the long-term uptrend line at $2.89.
It is interesting to note that the 20-month moving average is at $3.31 currently, near the next potential support zone. That means that the monthly chart also indicates potential support around the next lower price zone and therefore enhances the potential significance of that price zone.
On the upside, a rally above Monday’s high of $3.53 heads towards the 200-day average, now at $3.56. A daily close above the 200-day line would be needed to confirm strength, while Friday’s high of $3.70 being the first upside target, followed by a swing low at $3.80 (B). The 10-day average would then be next. It is now at $3.92 and falling.
For a look at all of today’s economic events, check out our economic calendar.
ASML Holding N.V. (ASML) stock price recorded further gains in its latest intraday trading, confirming a breakout above the key resistance level at $1,141.70. This move comes amid the dominance of the main medium-term upward trend, with price action moving along both major and minor supportive trend lines, alongside dynamic support from trading above its SMA50. In addition, positive signals continue to flow from the RSI, all accompanied by a noticeable increase in trading volumes.
Therefore we expect the stock price to continue rising in upcoming trading, as long as it remains stable above the $1,141.70 level, to target the first resistance at $1,300.
Today’s price forecast: Bullish
Spot Gold extends its advance on Tuesday, hovering around $4,480 a troy ounce in the American afternoon. The XAU/USD pair advanced despite the better market mood, as reflected by the positive tone of global equities. Investors were cautiously optimistic after the release of tepid, yet encouraging growth-related data and ahead of the first batch of United States (US) employment data scheduled for Wednesday.
Throughout the day, S&P Global, alongside local banks, released the Services and Composite Purchasing Manager’s Indexes (PMIs) for major economies, which showed expansion continued in the Eurozone, the United Kingdom, and the US. Nevertheless, the preliminary estimates of the December Composite PMIs were slightly lower than the final November readings.
The EU index eased to 51.5 from 52.8 in November, while in the US, the Composite PMI fell to 52.7 from 54.2 in the previous month. Slower growth rates may not be an immediate concern given continued expansion, yet if the picture persists, it could prompt some fresh concerns among policymakers, and hence, affect monetary policies.
The US calendar will include the December ADP report on Employment Change and November JOLTS Job Openings on Wednesday. Given that the Federal Reserve (Fed) made clear that employment is its major concern, the data will likely shake the USD ahead of the Nonfarm Payrolls (NFP) report on Friday.
In the meantime, Australia will release the November Consumer Price Index (CPI) in the upcoming Asian session. Afterwards, German Retail Sales and the preliminary estimate of the EU HICP will precede US employment reports.
From a technical point of view, XAU/USD is bullish. The 4-hour chart shows the pair holds on to modest intraday gains while advancing above all its moving averages. The 20-period 20 Simple Moving Average (SMA) at $4,404 provides relevant support while rallying beyond the longer ones, in line with the dominant trend. At the same time, the Momentum holds above its midline and advances, reflecting strengthening buying interest. Finally, the Relative Strength Index (RSI) indicator stands at 64.10, keeping room for further upside before the risk of a pause emerges. Should pullbacks occur, the 100 SMA at $4,385.02 would cushion declines, while sustained strength could keep the bias pointed higher toward fresh highs.
In the daily chart, XAU/USD keeps finding buyers on pullbacks to the 20-day SMA, which advances above the 100- and 200-day SMAs, with all three rising as price holds above them, reinforcing a bullish structure. The 20-day SMA stands at $4,357.69, offering immediate dynamic support. Meanwhile, the Momentum indicator advances above its midline, while the RSI also aims north at around 65, hinting at higher highs ahead.
(The technical analysis of this story was written with the help of an AI tool)
Image © Adobe Images
The pound to euro exchange rate (GBP/EUR) has broken above a key resistance level to register its highest level since October at 1.1490.
The new two-month peak follows the Christmas period of consolidation that saw GBP/EUR struggle to advance above the 100-day exponential moving average (EMA), presently located at 1.1470.
The 100-day EMA held the pound’s year-end advance, and we said last week that a break through this resistance barrier would open the door to 1.1520, which is the next major technical zone of interest.
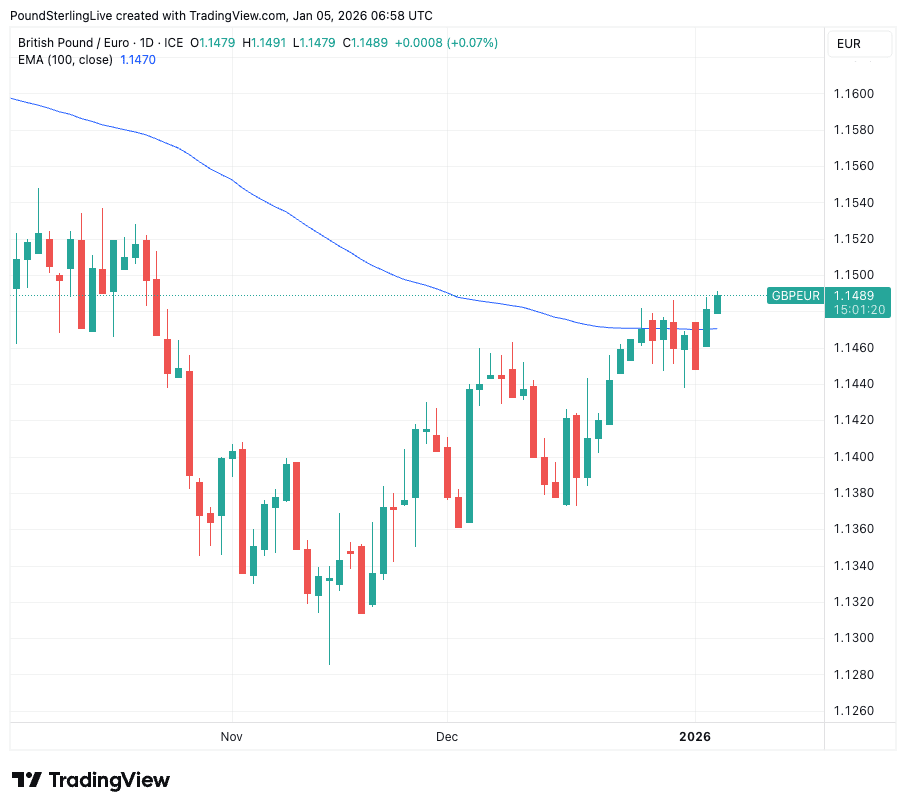
That breakout now looks to be in train. The technical setup is constructive with the pair comfortably cocooned in a short-term uptrend, helped by constructive global market conditions.
Those with payment requirements in the new year should consider setting an automatic buying order to trigger purchases at your desired levels, which our partners at Horizon Currency are able to assist with.
Year-end was characterised by rising stock markets, with the UK’s FTSE 100 hitting a new record above 10K last Friday. With no domestic data to bother pound sterling, GBP/EUR drifted higher in tandem with the upbeat mood music.
Find out how much you could save on your international transfer
Estimated saving compared to high street banks:
£25.00
Compare Rates from Leading Providers →
Free • No obligation • Takes 2 minutes
Should this continue to play out in the coming days, then GBP/EUR can achieve 1.1520 and perhaps go even higher.
It’s a quiet week data-wise in the UK, but the Eurozone will offer up some CPI inflation numbers.
Here, any strength would reinforce the notion that the European Central Bank (ECB) won’t cut interest rates any further while raising the odds that the next move will be a rate hike.
This should bolster short-term Eurozone bond yields, which are heavily influenced by the ECB’s base rate. Firm Eurozone bond yields, in turn, offer support to euro exchange rates.
The Eurozone CPI inflation release comes on Wednesday, and the consensus expects 2.4% y/y, confirming inflation is anchored above the ECB’s 2.0% target.
However, we would expect some market reaction to German CPI inflation, due on Tuesday, as the German data often gives a strong clue as to where the Eurozone’s figures will land the following day.
With ECB policy expectations deeply entrenched, we doubt the market reaction to the inflation data will be long-lived, meaning any GBP/EUR setbacks would be temporary.
Our bet is that global sentiment will stay in charge, and further gains in world stock markets will assist GBP/EUR higher.
– Written by
David Woodsmith
STORY LINK Pound Sterling to Dollar Forecast: GBP/USD “Neutral” as Markets Turn Cautious
The Pound to US Dollar exchange rate (GBP/USD) eased back from recent highs on Monday as rising geopolitical tensions encouraged investors to favour traditional safe-haven assets.
At the time of writing, GBP/USD was trading near $1.3461, little changed from the start of the session.
The US Dollar (USD) found modest support at the beginning of the week as investor caution increased following developments in Venezuela over the weekend.
Reports of US military action in Caracas and the detention of Venezuelan President Nicolás Maduro and his wife, Cilia Flores, prompted a shift toward more defensive positioning in early trade.
While the immediate reaction across currency markets was relatively muted, investors remain alert to the risk of further escalation, which could drive volatility if broader geopolitical consequences begin to unfold.
There are also concerns that President Donald Trump’s hardline approach to regime change in Venezuela could set a wider precedent, potentially increasing instability elsewhere and reinforcing demand for safe-haven currencies such as the US Dollar.
That said, gains in USD were capped by ongoing expectations that the Federal Reserve will continue easing monetary policy through 2026.
Get better rates and lower fees on your next international money transfer.
Compare TorFX with top UK banks in seconds and see how much you could save.
The Pound (GBP) held its ground on Monday, trading within a narrow range after comments from Prime Minister Keir Starmer hinted at a more conciliatory approach toward post-Brexit relations with the European Union.
In an interview with the BBC, Starmer suggested that closer alignment with the EU single market could be pursued where it benefits the UK, while stopping short of endorsing a full customs union.
Markets interpreted the remarks as signalling a more pragmatic trade strategy in the year ahead, with improved EU relations seen by many investors as a potential positive for UK growth and investment prospects.
Looking ahead, movement in the Pound to US Dollar exchange rate is likely to remain uneven as investors continue to monitor developments in Latin America and assess the risk of further US intervention.
Speculation around possible escalation involving Venezuela — or indications of action in neighbouring countries — could sustain demand for the US Dollar via heightened risk aversion.
In the UK, attention will also turn to the final services PMI for December, due on Tuesday. A downward revision could weigh on Sterling, particularly if it mirrors last month’s disappointing manufacturing data and reinforces concerns over the UK’s growth outlook.

According to FX analysts at Scotiabank, “The pound is up a fractional 0.1% vs. the USD and outperforming all of the G10 currencies with the exception of JPY.
“Domestic releases have been limited to second-tier credit/lending data, suggesting that the pound’s resilience is likely being driven by flows related to geopolitics and reflects the market’s assessment of the strength of the US/UK relationship.
“Risk reversals are little changed, offering little in terms of sentiment-driven movement.
“We are neutral awaiting a break of the two week range roughly bound between 1.34 and the mid1.35s.”
International Money Transfer? Ask our resident FX expert a money transfer question or try John’s new, free, no-obligation personal service! ,where he helps every step of the way,
ensuring you get the best exchange rates on your currency requirements.
TAGS: Pound Dollar Forecasts
New York, Jan 6, 2026, 06:31 EST — Premarket
The United States Natural Gas Fund slipped again in premarket trading on Tuesday as U.S. natural gas futures fell amid forecasts for warmer-than-normal weather. UNG was down 2.2% at $11.37 before the open. StockAnalysis
U.S. natural gas futures were down 2.7% at $3.427 per million British thermal units (mmBtu), a common benchmark unit for gas pricing. The pullback keeps pressure on natural-gas-linked funds that trade like stocks. Investing
The move matters now because winter weather is the main swing factor for U.S. heating demand, and traders have been repricing the balance as temperature models change. UNG is designed to track daily percentage moves tied to Henry Hub natural gas via near-term futures. Hellenicshippingnews
On Monday, front-month natural gas futures for February delivery on the New York Mercantile Exchange (NYMEX) fell 5.7% to $3.41 per mmBtu, marking a fourth straight session of losses, as of mid-morning. Hellenicshippingnews
Meteorologists are calling for warmer-than-average temperatures across the nation through Jan. 20, Reuters reported. Heating Degree Days (HDDs) — a gauge of how much energy is needed to heat buildings — were projected well below the 30-year normal. Hellenicshippingnews
Supply is still running high. LSEG forecast average gas demand, including exports, in the Lower 48 states at 133.0 billion cubic feet per day (bcfd) this week, rising to 134.2 bcfd next week; output averaged 109.2 bcfd so far in January, still below December’s record, it said. Hellenicshippingnews
LNG, or liquefied natural gas, remains the key offset for bulls. Gas flows to the eight large U.S. LNG export plants averaged 18.8 bcfd so far in January, above December’s record of 18.4 bcfd, LSEG said. Hellenicshippingnews
“This market is dropping into fresh new low territory this morning,” consultancy Ritterbusch & Associates said in a note, adding that downside risk in nearby futures extends to the $3.00 area without weather support. Hellenicshippingnews
For investors looking for alternatives, UNG’s sister fund, the United States 12 Month Natural Gas Fund (UNL), spreads exposure across 12 consecutive NYMEX contract months, rather than concentrating in the front month. USCF Investments
The US dollar did initially rally against the Japanese yen during trading on Monday, but has since fallen in what has been a little bit of lackluster performance by the dollar, more than anything else.
When you look at the technical analysis, this is a market that has been consolidating after a big move to the upside, and the recent pullback of the last couple of weeks makes sense because, at this juncture, it appears to me very obvious that the 158 level is an area that you are going to have to watch closely.
If we can break above 158, then there is a world where we start to see a lot of upward activity. At that juncture, I’m looking at a move to the 160 yen level pretty quickly. That being said, we did pull back during the trading session on Monday, and I think this just reiterates the idea of consolidation between the 158 level on the top and the 154.50 yen level on the bottom.
The fundamentals for this pair are driven by the carry trade, the interest rate differential, as per usual, as the Federal Reserve currently has a policy between 3.5% and 3.75% after a rate cut in December. Markets expect maybe one more cut in the first quarter, but the rate remains relatively high in comparison to Japan, which only has a 0.75% rate after a hike.
This is a 30-year high. Even with the BOJ hiking and the Federal Reserve cutting, the gap is still roughly 3%. So, investors will more likely than not continue to sell the yen to buy the dollar and pick up the differential. That being said, the US dollar has struggled a bit, so this may not be the first place traders are looking to short the yen by another currency.

That being said, the Bank of Japan is still suggesting that it will raise rates if inflation targets are met. We’ll have to see. The slow and gradual rate hike situation in Tokyo is disappointing for those who are hoping for the yen to recover. The Federal Reserve is easing, but the US economy remains extraordinarily resilient, possibly even boosted by new fiscal spending and government bills mentioned in recent forecasts, preventing a dollar sell-off en masse.
We are getting pretty close to the 160 yen level, relatively speaking. In that scenario, the Japanese have, of course, defended. Geopolitics could drive money back into the yen as well. But all things being equal, I look at this as a bullish but cautious situation. The primary trend is up, fueled by the interest rate differential, but you also probably have somewhat limited upside at 160 yen.
The Bank of Japan has a meeting January 23. Any surprise hike could break this trend, but we’ll just have to see where this is. I remain more buy-on-the-dip here in a short-term back-and-forth type of environment.
Ready to trade our Forex daily analysis and predictions? Here are the best regulated trading brokers to choose from.
The euro went back and forth on Monday, as traders continued to digest the news over the weekend out of Caracas. Risk sentiment is likely to be in flux at best.
The euro was back and forth during the trading session on Monday as we initially tested the 50-day EMA. I think at this point in time, it is obvious that the buyers are still willing to stick with the euro despite the fact that it has not been able to break above a significant resistance barrier. That resistance barrier is the 1.18 level, which could extend all the way to the 1.19 level. I think it is going to take pretty hefty bullish pressure to finally break above there.
But there is a little bit of policy divergence here between these two central banks as the Federal Reserve is expected to cut rates further into 2026, and as a result, it is likely that the US dollar will face some pressure there. That being said, the ECB is expected to be less aggressive with its cuts, although cutting is still possible. At this point, the European growth is projected to be modest, somewhere right around 1.2%, but steady and supported by fiscal stimulus in Germany. The United States growth outlook is expected to slow in the beginning part of 2026 but then take off.
All things being equal, I think this is also a market that is trying to determine whether or not inflation is going to be sticky in America. If it is, that is dollar positive. Ultimately, I think this is a situation where traders look at this through the eyes of a consolidation range with more of a buy on the dip mentality. Breaking below the 1.14 level smashes this narrative to pieces, but right now, this has held steady for several months.
Ready to trade our daily Forex analysis? We’ve made this forex brokers list for you to check out.
Christopher Lewis has been trading Forex and has over 20 years experience in financial markets. Chris has been a regular contributor to Daily Forex since the early days of the site. He writes about Forex for several online publications, including FX Empire, Investing.com, and his own site, aptly named The Trader Guy. Chris favours technical analysis methods to identify his trades and likes to trade equity indices and commodities as well as Forex. He favours a longer-term trading style, and his trades often last for days or weeks.
Gold (XAU/USD) increased to about $4,440. As the Venezuela crisis introduces geopolitical uncertainty, the precious metal continues to rise and reaches a one-week high due to demand for safe havens.

Traders will keenly watch US economic data, such as Nonfarm Payrolls (NFP), for hints about the direction of monetary policy. After the US Army’s Delta Force attacked Venezuela and captured its President Nicolás Maduro and his wife on Saturday, tensions between the US and Venezuela reached a new high
Maduro began an extraordinary legal battle with significant geopolitical ramifications on Monday when he entered a not guilty plea to US charges in a narco-terrorism case against him. Traditional safe-haven assets are fueled by increased geopolitical tensions and uncertainty in this area.
The upside of the yellow metal is partly due to dovish expectations of the US Federal Reserve (Fed). According to the most recent Federal Open Market Committee (FOMC) Minutes, the majority of Fed officials agreed that additional interest rate cuts were necessary as long as inflation decreased.
Still, they couldn’t agree on when or how much. Lower interest rates could support the non-yielding precious metal by lowering the opportunity cost of holding gold. On Friday, everyone will be watching the US employment report for December.
55,000 new jobs are anticipated to be added to the US economy in December, while the unemployment rate is predicted to drop to 4.5 percent. In the short term, this could strengthen the US dollar (USD) and weaken the price of commodities denominated in USD if the reports indicate a better-than-expected result.
Olumide Adesina
Financial Market Writer
Olumide Adesina is a French-born Nigerian financial writer. He tracks the financial markets with over 15 years of working experience in investment trading.


