The main category of Forex News.
You can use the search box below to find what you need.
[wd_asp id=1]
The main category of Forex News.
You can use the search box below to find what you need.
[wd_asp id=1]
– Written by
David Woodsmith
STORY LINK GBP/USD Price Forecast: Pound Sterling Gains as Healey Reassures Bond Markets
The Pound US Dollar (GBP/USD) exchange rate edged higher on Monday, with the pairing finding some support as markets assessed comments from UK Chancellor John Healey on the economy.
At the time of writing, GBP/USD was trading at $1.3536, around 0.15% higher on the day.
The Pound (GBP) strengthened modestly on Monday following comments from UK Chancellor John Healey.
Healey reiterated his commitment to fiscal discipline, aiming to reassure markets after recent turbulence in the UK bond market.
His speech also placed considerable emphasis on supporting economic growth, with government investment, innovation, devolution and reducing red tape identified as measures that could help drive activity.
Sterling received a mildly favourable response to the Chancellor’s remarks, although the reaction was relatively muted.
The Pound gained ground against several of its peers, but remained some way from making significant advances.
Get better rates and lower fees on your next international money transfer.
Compare TorFX with top UK banks in seconds and see how much you could save.
Meanwhile, the US Dollar (USD) lacked momentum on Monday, with US markets shut for the Labor Day federal holiday.
The closure appeared to dampen demand for the currency.
The ‘Greenback’ also struggled to gain traction as mixed conditions across financial markets restricted movement in the safe-haven currency.
Asian markets had started the week on a positive footing after reports that Beijing would provide $54bn to state-owned banks and insurers.
Risk appetite cooled during the European session, although the resulting uncertainty did little to lift USD.
The currency remained subdued as a result.

Looking ahead, the economic calendar is relatively quiet for both GBP and USD on Tuesday, which could leave the Pound to US Dollar exchange rate more exposed to broader market movements.
Risk appetite may prove crucial for the pairing.
A further escalation in Middle East tensions could prompt investors to turn more cautious, potentially increasing demand for the safe-haven ‘Greenback’.
Geopolitical uncertainty in Europe could have a similar effect, while a worsening trade dispute between the US and Canada may also encourage risk aversion and strengthen the appeal of the US Dollar.
International Money Transfer? Ask our resident FX expert a money transfer question or try John’s new, free, no-obligation personal service! ,where he helps every step of the way,
ensuring you get the best exchange rates on your currency requirements.
TAGS: Pound Dollar Forecasts
Silver (XAG/USD) nudges lower on Monday, hitting session lows in the mid-$65.00s after a reversal from the $68.00 area. Precious metals are struggling on Monday, as US Nonfarm Payrolls (NFP) figures beat expectations last Friday, boosting hopes that the US Federal Reserve (Fed) will hike rates next week, although the market awaits Friday’s Consumer Price Index (CPI) release for confirmation.
US NFP figures showed a 162K increase in net employment in August, well above the 57K forecasted by market analysts, easing concerns about a softening labour market. The data prompted investors to ramp up bets on a Fed rate hike at the September 15-16 monetary policy meeting to a 58% chance, from around 50% before the release, according to data from the CME FedWatch Tool.
Analysts at ING point to Friday’s August CPI release as the main focus this week, where they see “month-on-month readings at 0.4% and 0.2% for headline and core (inflation) should be enough to sway the Fed towards a 25bp rate hike on 16 September,” a move they note is “just priced with a 58% probability at the moment.”
XAG/USD trades at $65.79, keeping a bearish near-term tone as it holds well below the 200-day simple moving average (SMA). Friday’s reversal from $68.00 looks like the second shoulder of a bearish Head & Shoulders (H&S) formation, while momentum indicators in the daily chart highlight growing bearish pressure.
The 14-period Relative Strength Index (RSI) is hovering near a neutral 52 zone, and the Moving Average Convergence Divergence (MACD) stays in negative territory, which suggests that upside attempts could remain capped.
On the downside, the pair might find support at Friday’s low near $64.75, although the key level is the September 2 low, at $63.30, which would confirm the H&S pattern and add pressure toward the August 6 low, near $61.00.
On the topside, initial resistance emerges at a previous support area around $67.50, which held bulls on Friday. Further up, the mid-June highs around $71.60 and the 200-day SMA at $72.90 are likely to pose a significant challenge for bulls.
(The technical analysis of this story was written with the help of an AI tool. Know more.)
Silver is a precious metal highly traded among investors. It has been historically used as a store of value and a medium of exchange. Although less popular than Gold, traders may turn to Silver to diversify their investment portfolio, for its intrinsic value or as a potential hedge during high-inflation periods. Investors can buy physical Silver, in coins or in bars, or trade it through vehicles such as Exchange Traded Funds, which track its price on international markets.
Silver prices can move due to a wide range of factors. Geopolitical instability or fears of a deep recession can make Silver price escalate due to its safe-haven status, although to a lesser extent than Gold’s. As a yieldless asset, Silver tends to rise with lower interest rates. Its moves also depend on how the US Dollar (USD) behaves as the asset is priced in dollars (XAG/USD). A strong Dollar tends to keep the price of Silver at bay, whereas a weaker Dollar is likely to propel prices up. Other factors such as investment demand, mining supply – Silver is much more abundant than Gold – and recycling rates can also affect prices.
Silver is widely used in industry, particularly in sectors such as electronics or solar energy, as it has one of the highest electric conductivity of all metals – more than Copper and Gold. A surge in demand can increase prices, while a decline tends to lower them. Dynamics in the US, Chinese and Indian economies can also contribute to price swings: for the US and particularly China, their big industrial sectors use Silver in various processes; in India, consumers’ demand for the precious metal for jewellery also plays a key role in setting prices.
Silver prices tend to follow Gold’s moves. When Gold prices rise, Silver typically follows suit, as their status as safe-haven assets is similar. The Gold/Silver ratio, which shows the number of ounces of Silver needed to equal the value of one ounce of Gold, may help to determine the relative valuation between both metals. Some investors may consider a high ratio as an indicator that Silver is undervalued, or Gold is overvalued. On the contrary, a low ratio might suggest that Gold is undervalued relative to Silver.
EUR/USD gained some ground despite the disappointing Industrial Production report from Germany. The report showed that Industrial Production decreased by -1.1% month-over-month in July, compared to analyst forecast of +0.1%.
Traders also focused on the results of elections in Germany’s Saxony-Anhalt, which ended in a massive win for the anti-immigration Alternative for Germany. The AfD party reached its best result ever, raising worries about its potential success at a federal level.
AfD’s victory in Saxony-Anhalt is a big deal for Germany’s political scene, but I do not think that it will have a material impact on the dynamics of the European currency in the near term. That said, political shifts in Europe are always worth watching.
In case EUR/USD stays above the 1.1615 level, it will head towards the next resistance level, which is located in the 1.1685 – 1.1700 range.
Domestic coffee prices
Coffee prices today in the domestic market simultaneously unexpectedly remained unchanged compared to the previous session. According to giacaphe. com, the average coffee price on September 7 remained at 94,800 VND/kg.
In Gia Lai and Dak Lak, coffee prices were recorded at 94,700 VND/kg.
In Lam Dong, the listed coffee price is at 94. 200 VND/kg.
The old Dak Nong area still maintained the highest price in the whole region, recording 95,000 VND/kg.
The USD/VND exchange rate according to Vietcombank was recorded at 25,840 VND/USD, down 5 VND/USD.
World coffee prices
In the world market, coffee prices fluctuated in the same direction as all terms did not adjust.
According to Barchart, the September 2026 Robusta contract remained unchanged, anchored at the $3,344/ton mark. The November 2026 term was listed at $3,430/ton. The term from January 2027 to May 2027 saw an increase from $55-57/ton, to $3,383 – $3,415/ton.
Similarly, the September 2026 Arabica futures contract closed the session at 324.25 cents/lb. The December 2026 term held the price at 295.60 cents/lb. Further forwards were anchored in the 287.4 – 283.4 cents/lb range.
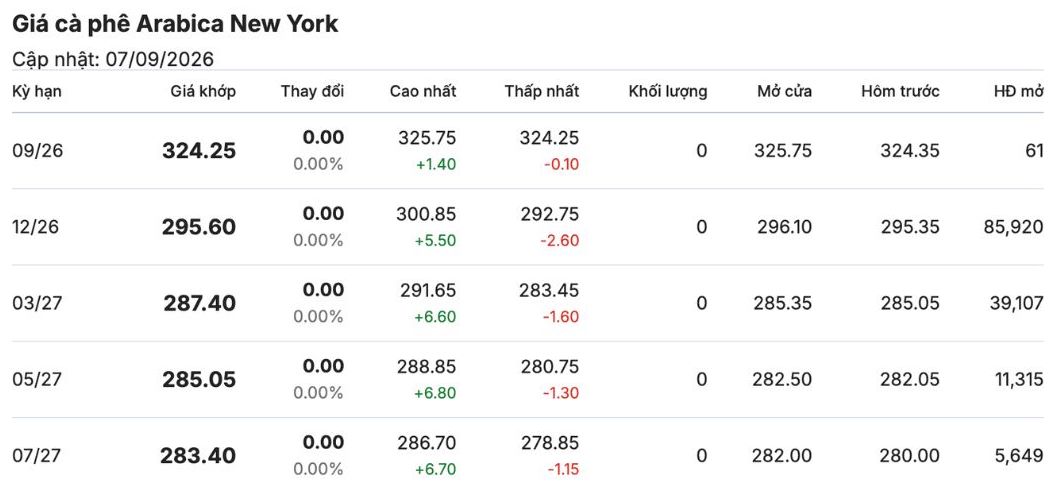
Assessments and forecasts
The London and New York exchanges entered the first trading session of the new week with the foundation being a slight technical recovery from the previous week’s closing session. The 3,400 USD/ton zone of Robusta for November 2026 futures temporarily played a good role as a short-term psychological support level.
Meanwhile, weather factors continue to dominate the New York Stock Exchange. The rainfall diễn biến in Minas Gerais and São Paulo (Brazil) states in the early days of September is still not thick enough to completely relieve concerns about drought for the main flowering stage. This helps New York limit the deep decline, fluctuating accumulation around the 295 cent/lb mark.
Supply and demand keep domestic pepper prices stable above the 94,000 VND/kg mark. According to statistics, the volume of coffee exports in the first 8 months of 2026 reached about 1.3 million tons with a value of 6 billion USD, an increase of 13.1% in volume but a decrease of 9.1% in value compared to the same period in 2025. The average export price reached 4,538 USD/ton, down 19.7%, showing that price decreases are significantly impacting turnover even though export volume is increasing.
The British Pound (GBP) has resumed its bearish trend against a stronger Japanese Yen (JPY) on Monday, as comments from Japanese officials hinting at a steeper Bank of Japan (BoJ) monetary tightening cycle have provided a fresh boost to the Yen. The GBP/JPY pair shows a whopping 3.3% decline in the last four trading days and is testing key support above 209.00 at the time of writing.
Analysts at Danske Bank highlight a notable shift in domestic policy expectations, pointing out that in Japan, “Takuji Aida, economic adviser to PM Takaichi and seen as one of the most vocal opponents of BoJ rate hikes, now expects the Bank of Japan to raise rates at its 17-18 September meeting, followed by another hike by January next year.”
Danske adds that “at the same time, Aida warns that a faster tightening pace could weigh on the economy,” underscoring the delicate balance policymakers face as markets move to price a more hawkish BoJ path.
These remarks follow similar ones by BoJ committee member Hajime Takata last week and rather unambiguous pressures by US Treasury Secretary Scott Bessent to tighten monetary policy to support the Yen
GBP/JPY trades at 209.38, maintaining a bearish near-term bias with price action holding just above the neckline of a Head & Shoulders (H&S) pattern, a common figure to spot trend shifts. Momentum indicators in the daily chart are deeply negative, with the Relative Strength Index (14) entering oversold territory near 26, with the Moving Average Convergence Divergence (MACD) well below zero, suggesting persistent downside pressure even as the pair risks short-lived corrective bounces.
A confirmation below the 209.20 level would expose the February 27 low at the 207.30 area. The downtrend, on the other hand, looks overextended, which might lead to some correction. In this case, previous support areas at 210.45 (April 30 low) and 211.50 (August 7 low) are likely to test bulls.
(The technical analysis of this story was written with the help of an AI tool. Know more.)
The table below shows the percentage change of Japanese Yen (JPY) against listed major currencies today. Japanese Yen was the strongest against the New Zealand Dollar.
| USD | EUR | GBP | JPY | CAD | AUD | NZD | CHF | |
|---|---|---|---|---|---|---|---|---|
| USD | -0.06% | -0.09% | -0.96% | -0.11% | -0.14% | 0.09% | -0.06% | |
| EUR | 0.06% | -0.03% | -0.90% | -0.08% | -0.08% | 0.14% | 0.00% | |
| GBP | 0.09% | 0.03% | -0.88% | -0.04% | -0.06% | 0.17% | 0.03% | |
| JPY | 0.96% | 0.90% | 0.88% | 0.87% | 0.84% | 1.09% | 0.95% | |
| CAD | 0.11% | 0.08% | 0.04% | -0.87% | -0.04% | 0.19% | 0.04% | |
| AUD | 0.14% | 0.08% | 0.06% | -0.84% | 0.04% | 0.24% | 0.07% | |
| NZD | -0.09% | -0.14% | -0.17% | -1.09% | -0.19% | -0.24% | -0.16% | |
| CHF | 0.06% | -0.01% | -0.03% | -0.95% | -0.04% | -0.07% | 0.16% |
The heat map shows percentage changes of major currencies against each other. The base currency is picked from the left column, while the quote currency is picked from the top row. For example, if you pick the Japanese Yen from the left column and move along the horizontal line to the US Dollar, the percentage change displayed in the box will represent JPY (base)/USD (quote).
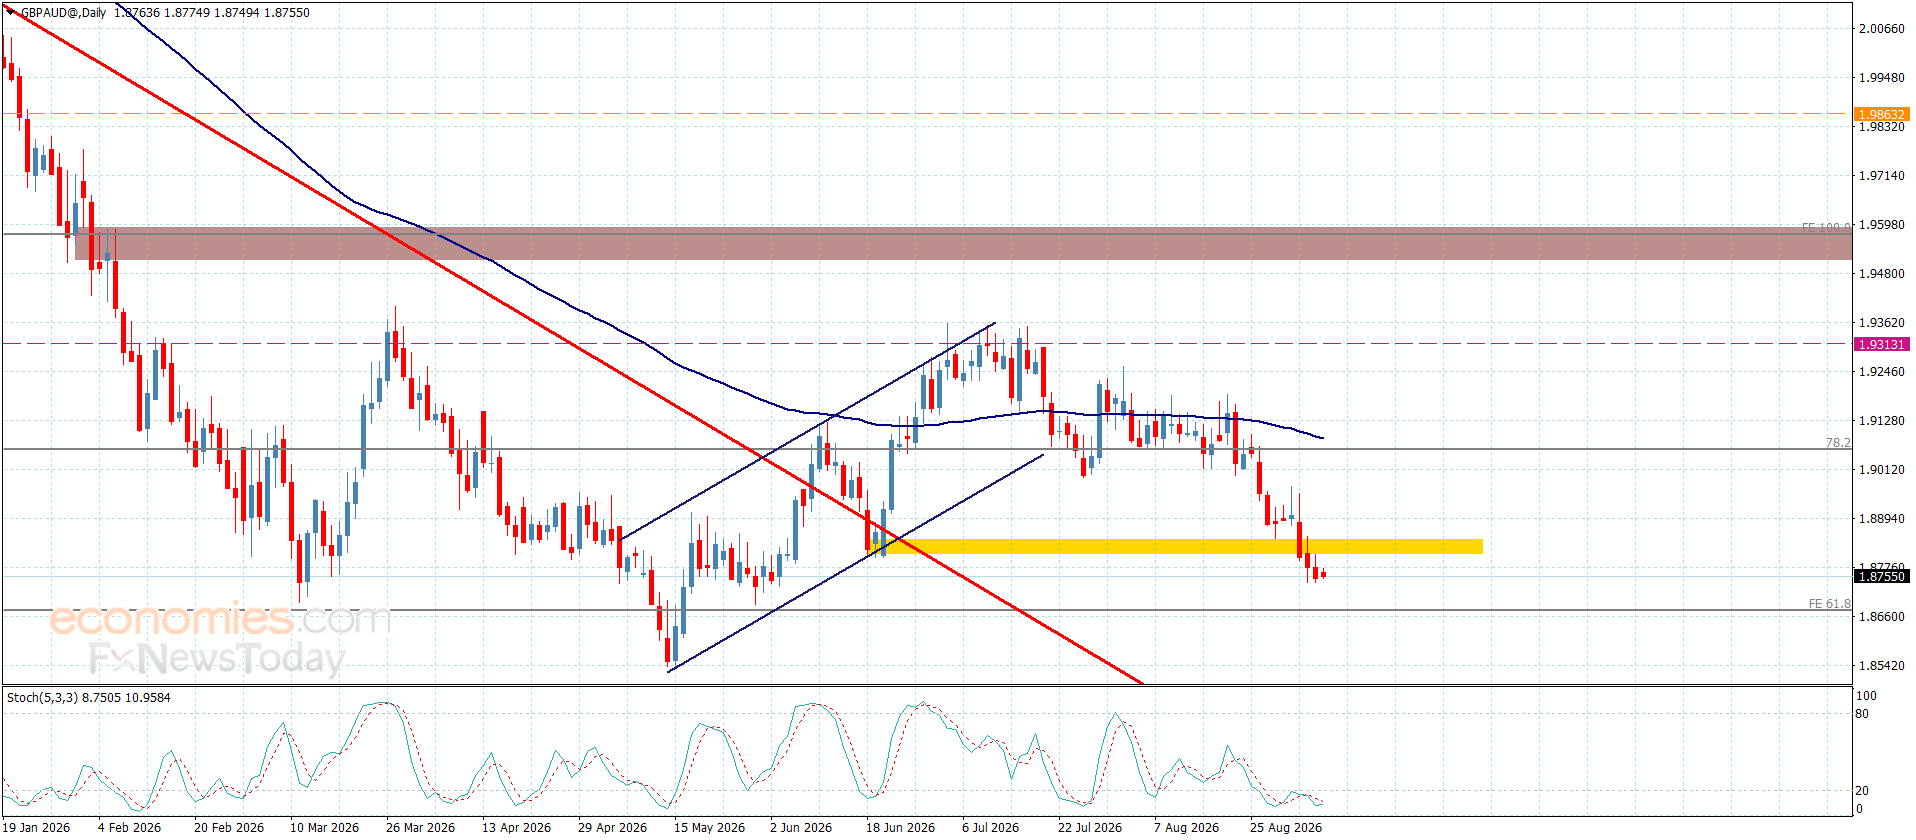
GBPAUD faced new bearish pressures due to the stability of stochastic stability within the oversold level, to push it to break the support level at 1.8830 and providing negative closes, to suffer new losses by reaching 1.8740 level.
The stability below the broken support will increase the efficiency of the bearish scenario in the near trading, to expect reaching 1.8675 and surpassing this barrier might extend the trading towards the next station that is represented by 1.8585.
The expected trading range for today is between 1.8675 and 1.8810
Trend forecast: Bearish
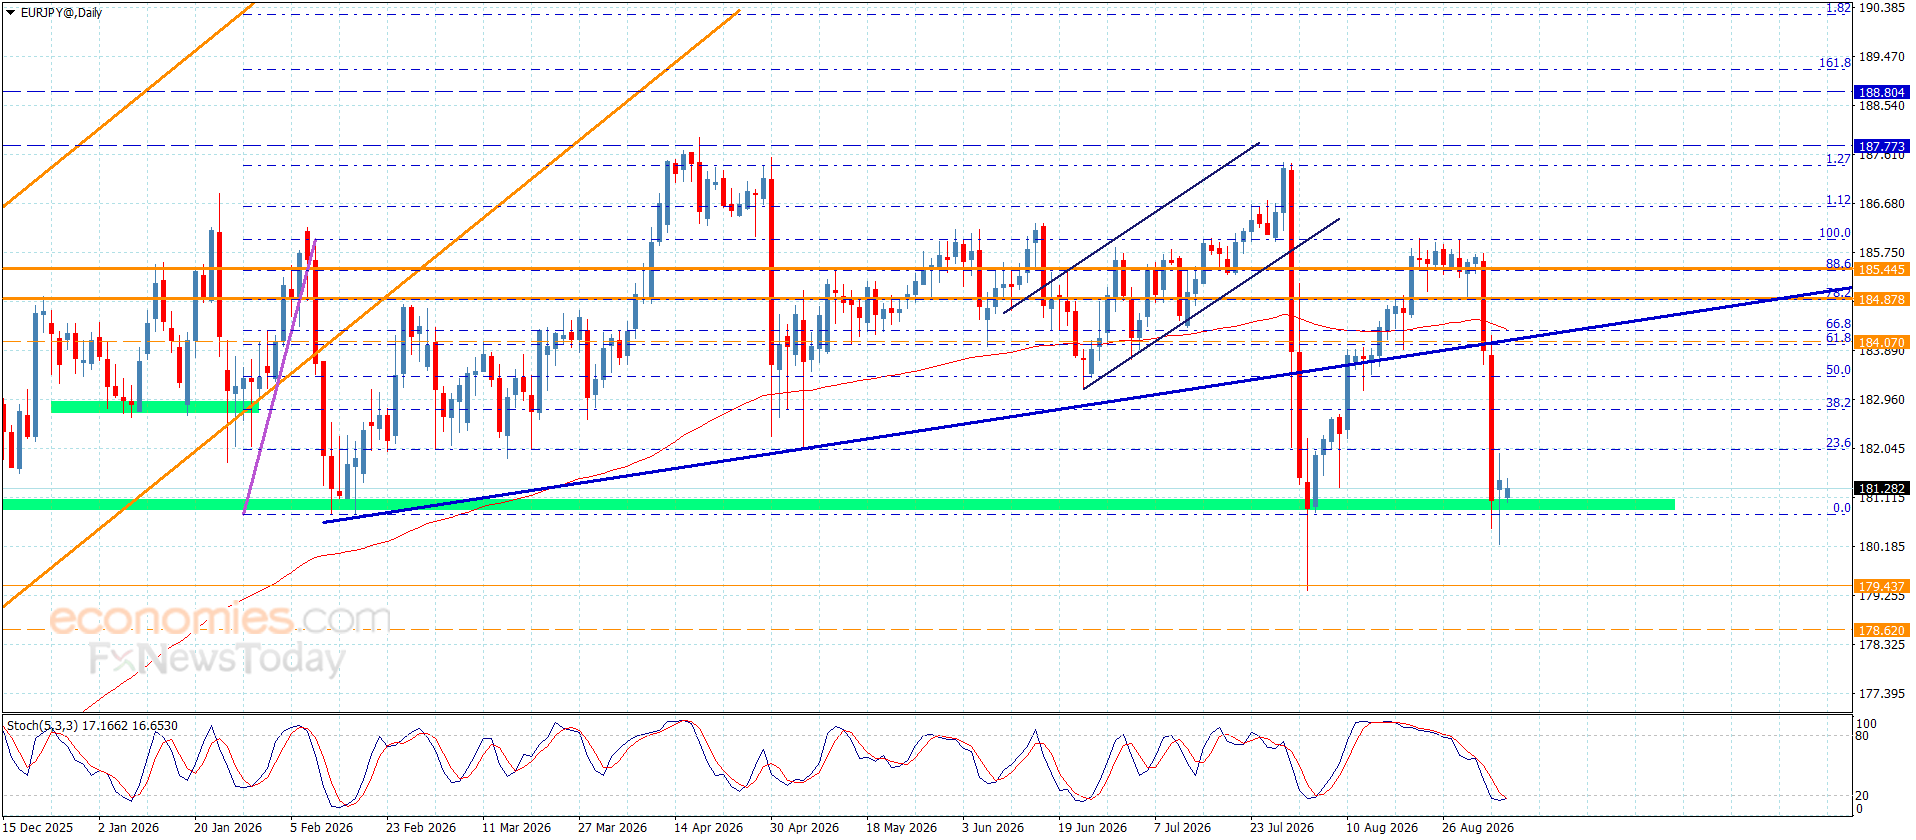
The EURJPY pair ended the last bullish corrective rally by reaching 181.95 level, activating with the main indicators’ negativity, suffering intraday losses by reaching 180.20 level, to settle above the key support at 180.80 level.
The suggested scenario in the near and medium trading depends on the strength of the current support, the stability above it will provide a chances to activate the bullish corrective trend, to attempt to reach 182.10 and 182.70, while providing a negative close below the current support will confirm its surrender to the bearish scenario, which forced it to suffer new losses by reaching 180.30 and 179.45.
The expected trading range for today is between 180.80 and 182.10
Trend forecast: Bullish
Economies.com
2026-09-07 01:39 UTC
The Ethereum price (ETHUSD) edged higher during its latest intraday trading, as it attempts to break above the pivotal and stubborn resistance at $2,500, while continuing its short-term sideways movement, supported by its continued trading above EMA50, which provides the price with a dynamic support base that enhances the chances of a breakout over the coming period. On the other hand, negative signals are beginning to emerge from the relative strength indicators after reaching extremely overbought levels, which may hinder the pair’s chances of a rapid recovery, to relieve these overbought conditions.
The GBP/USD pair trades with a negative bias for the second straight day, though it lacks bearish conviction and trades around the 1.3500 psychological mark during the Asian session on Monday. Moreover, spot prices hold above Friday’s swing low, warranting some caution for bearish traders.
The US Dollar (USD) draws support from rising bets for an interest rate hike by the US Federal Reserve (Fed) in September amid inflation risks stemming from higher energy prices. Adding to this, escalating US-Iran confrontations in the Strait of Hormuz act as a tailwind for the safe-haven buck and weigh on the GBP/USD pair. USD bulls, however, seem hesitant and opt to wait for US inflation figures, due later this week, for more cues about the Fed’s policy path.
Traders will further confront the release of the monthly UK GDP report on Friday for a fresh impetus. In the meantime, relatively thin trading volumes due to the Labor Day holiday in the US hold back traders from placing aggressive bets and might continue to lend support to the GBP/USD pair. Hence, it will be prudent to wait for strong follow-through selling before positioning for an extension of the recent pullback from a six-month peak, touched in August.
From a technical perspective, the GBP/USD pair holds above the 50-day Simple Moving Average (SMA) at 1.3460 and the 38.2% Fibonacci retracement of the June-August rise. Meanwhile, the Relative Strength Index (RSI) at 48.7 hovers around neutral, and the Moving Average Convergence Divergence (MACD) line remains slightly negative. This hints that the upside momentum is modest even as the GBP/USD pair consolidates above these underlying supports.
On the downside, initial support emerges in the 1.3470–1.3460 band defined by the 38.2% retracement and the 50-day SMA, with further cushions at the 50.0% retracement near 1.3407 and deeper Fibonacci levels at 1.3345, 1.3255 and 1.3141. On the topside, the 23.6% Fibo. retracement at 1.3548 is the first resistance to clear, ahead of the cycle high anchor around 1.3673, a break of which would reopen a stronger bullish extension.
(The technical analysis of this story was written with the help of an AI tool. Know more.)
The table below shows the percentage change of US Dollar (USD) against listed major currencies today. US Dollar was the strongest against the New Zealand Dollar.
| USD | EUR | GBP | JPY | CAD | AUD | NZD | CHF | |
|---|---|---|---|---|---|---|---|---|
| USD | 0.03% | 0.05% | -0.09% | 0.00% | 0.00% | 0.13% | 0.08% | |
| EUR | -0.03% | 0.02% | -0.15% | -0.06% | -0.03% | 0.08% | 0.05% | |
| GBP | -0.05% | -0.02% | -0.15% | -0.08% | -0.04% | 0.07% | 0.03% | |
| JPY | 0.09% | 0.15% | 0.15% | 0.12% | 0.13% | 0.25% | 0.23% | |
| CAD | -0.01% | 0.06% | 0.08% | -0.12% | -0.00% | 0.11% | 0.07% | |
| AUD | -0.01% | 0.03% | 0.04% | -0.13% | 0.00% | 0.12% | 0.06% | |
| NZD | -0.13% | -0.08% | -0.07% | -0.25% | -0.11% | -0.12% | -0.04% | |
| CHF | -0.08% | -0.05% | -0.03% | -0.23% | -0.07% | -0.06% | 0.04% |
The heat map shows percentage changes of major currencies against each other. The base currency is picked from the left column, while the quote currency is picked from the top row. For example, if you pick the US Dollar from the left column and move along the horizontal line to the Japanese Yen, the percentage change displayed in the box will represent USD (base)/JPY (quote).
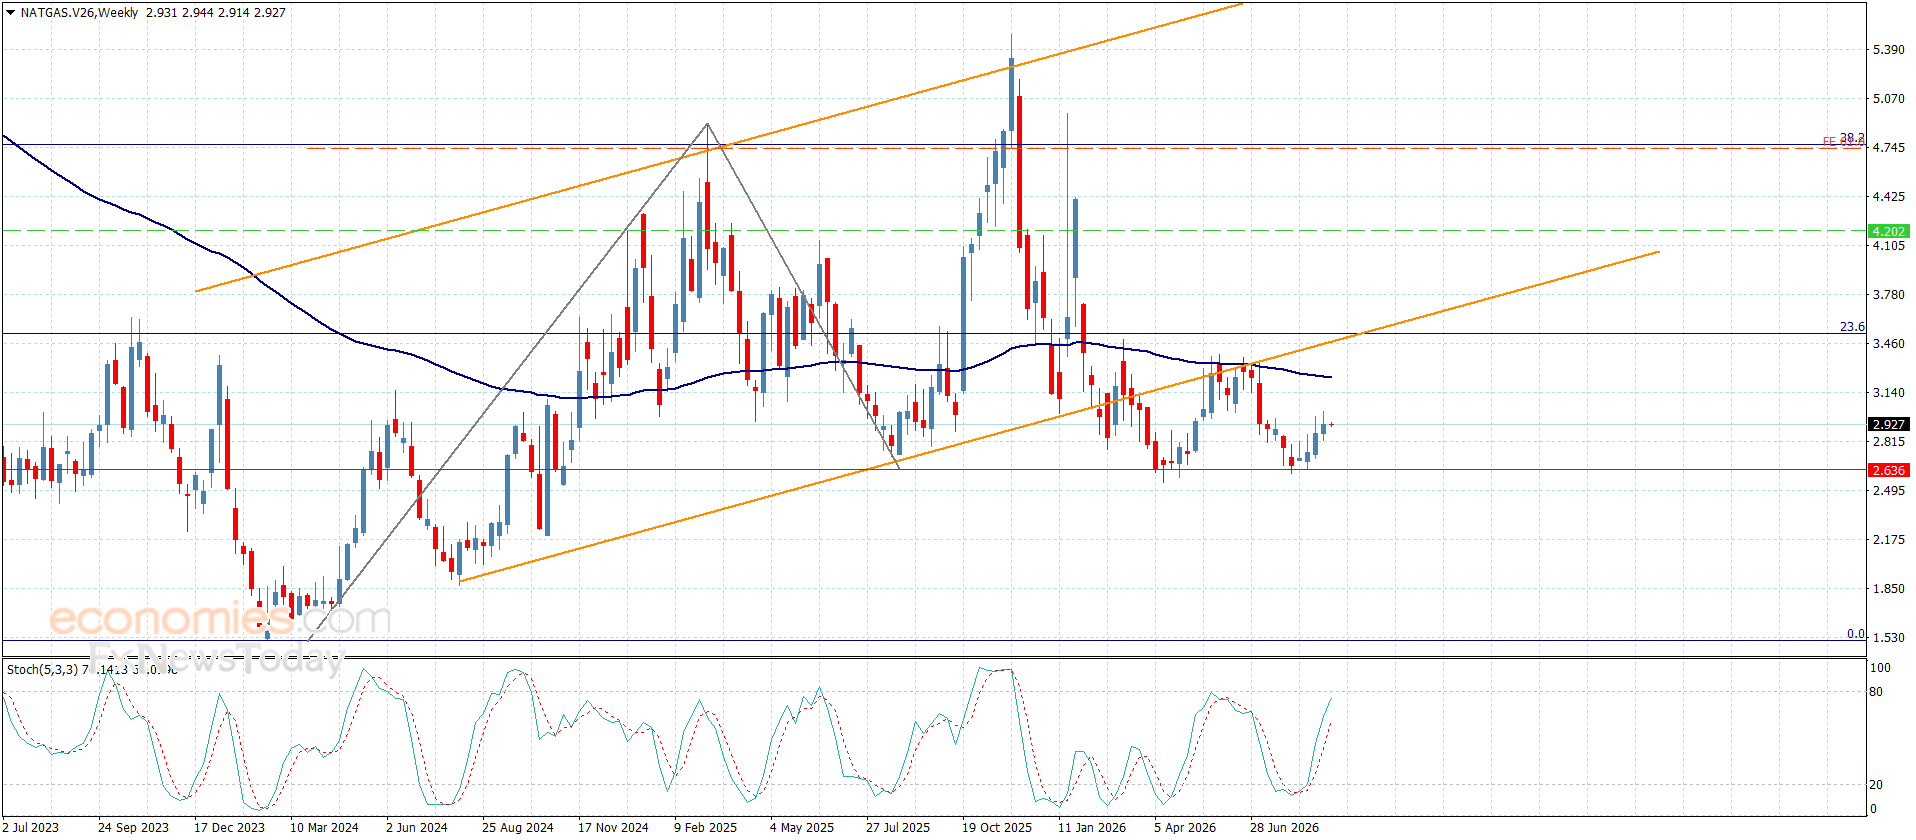
Despite the weakness of the last weak trading by its fluctuations near $2.920 level, it will not affect the previously suggested bullish scenario, depending on its stability above $2.620 level.
The continuation of providing bullish momentum by stochastic will increase the efficiency of the bullish corrective trend, which might target $3.100 level reaching 55 moving average at $2.240.
The expected trading range for today is between $2.860 and $3.100
Trend forecast: Bullish