The main category of Forex News.
You can use the search box below to find what you need.
[wd_asp id=1]
The main category of Forex News.
You can use the search box below to find what you need.
[wd_asp id=1]
Gold price has paused its recovery from monthly lows early Tuesday, as the US Dollar (USD) finds fresh demand while the market mood turns cautious.
Traders seem to resort to position adjustments on their USD shorts, bracing for US Federal Reserve’s (Fed) Chairman Jerome Powell’s appearance for fresh cues on the timing of the next interest rate cut.
Fed Chair Powell participates in a policy panel alongside other key central banks’ chiefs at the European Central Bank (ECB) Forum on central banking in Sintra on Tuesday.
Markets continue to price in a 20% chance of the Fed trimming rates this month while predicting a 77% probability of a rate cut in September.
If Powell once again signals prospects of weaker-than-expected inflation, it would ramp up the Fed’s easing bets, triggering a fresh leg down in the US Dollar.
The dovish tone could help the non-yielding Gold price recover further ground.
However, if Powell surprises with some hawkish or prudent remarks, it could double down on the recent Gold price downtrend.
Besides, the focus will be also on the US JOLTS Job Openings data and US trade talks as the July 9 deadline approaches.
The Greenback faced a double-whammy on Monday and hit over three-year lows against its major currency rivals.
Increased concerns over US fiscal health ahead of the Senate’s efforts to pass President Donald Trump’s ‘big, beautiful’ spending bill weighed heavily on the US Dollar.
Meanwhile, investors remained wary over the potential US trade deals with Japan and the European Union (EU), especially after Treasury Secretary Scott Bessent warned that countries could be notified of sharply higher tariffs despite good-faith negotiations.
Furthermore, the record-rally on Wall Street indices also hit the sentiment around the Greenback, allowing Gold price to stage a decent comeback on Monday.
Gold price tests the 50-day Simple Moving Average (SMA) at $3,320, having found support near the $3,250 psychological level on Monday.
On the road to recovery, Gold price recaptured the 38.2% Fibonacci Retracement (Fibo) level of the April record rally at $3,297 on a daily closing basis.
However, the 14-day Relative Strength Index (RSI) holds below the 50 level, raising doubts about the prospects of a sustained recovery from monthly troughs.
If Gold price settles Tuesday above the 50-day SMA at $3,320, the turnaround could gather strength toward the 21-day SMA at $3,350.
Further north, the 23.6% Fibo level of the same ascent at $3,377 will be challenged again.
On the flip side, acceptance below $3,297, the 38.2% Fibo level will open the door toward the monthly lows of $3,248.
Jerome H. Powell took office as a member of the Board of Governors of the Federal Reserve System on May 25, 2012, to fill an unexpired term. On November 2, 2017, President Donald Trump nominated Powell to serve as the next Chairman of the Federal Reserve. Powell assumed office as Chair on February 5, 2018.
Next release:
Tue Jul 01, 2025 13:30
Frequency:
Irregular
Consensus:
–
Previous:
–
Source:
Federal Reserve
The Bank of Japan has a significant issue at the moment, due to the fact that there have been a lack of buyers in the Japanese Government Bond markets. This is a major problem for central banks and will almost always lead to more central bank buying of bonds, or what you probably know as “quantitative easing.” That’s an extreme simplification of what’s going on, but it is a very realistic example. By contrast, we have the Federal Reserve possibly cutting rates by 25 basis points in September, but that would still leave a major interest rate differential between these 2 currencies and make the dollar attractive against the yen itself.

The technical analysis at the moment is somewhat flat, as we have been trading in a range for a couple of months. The ¥142 level on the bottom is an area of significant support, while the ¥148 level has been significant resistance. It seems as if the market is very comfortable near the ¥145 level, which is also attracting the 50 Day EMA. As the market has gone into a multi-month consolidation area, this tells me that we could possibly be trying to form some type of bottoming pattern. This could take months though, which would not be unusual for this currency pair.
If we were to break above the ¥148 level, that opens up a move above the 200 Day EMA as well and perhaps should send the USD/JPY pair to the ¥150 level. On the other hand, if we were to break down below the ¥142 level, then I suspect we revisit the ¥140 level relatively quickly.
Want to trade our USD/JPY forex analysis and predictions? Here’s a list of forex brokers in Japan to check out.
Christopher Lewis has been trading Forex and has over 20 years experience in financial markets. Chris has been a regular contributor to Daily Forex since the early days of the site. He writes about Forex for several online publications, including FX Empire, Investing.com, and his own site, aptly named The Trader Guy. Chris favours technical analysis methods to identify his trades and likes to trade equity indices and commodities as well as Forex. He favours a longer-term trading style, and his trades often last for days or weeks.
Natural gas price lost the positive momentum yesterday, affected by stochastic stability below 50 level, forcing it to form bearish waves to settle near the support base at $3.460 level, to form strong and important resistance to detect the main trend in the upcoming trading.
The stability of the current support will reinforce the chances for regaining the bullish bias, to expect its rally towards $3.600, then attempts to reach the extra initial target at $3.830, while the continuation of the negative pressures and its decline below the current support will confirm its move to the bearish track, which forces it to suffer several losses by targeting $3.320 and $3.140 level.
The expected trading range for today is between $3.450 and $3.600
Trend forecast: Bullish
Perhaps we will turn around, but at this point in time you have to assume that there will be a bit of continuation overall, as the trend has clearly been positive for several months. If we do pull back from here, then we could look at a move to the 1.16 level, an area that previously had been a major resistance level. This could bring in a bit of “market memory” into the market, as traders would try to either cover short positions that has been wrong or perhaps try to join in on what had been a massive move higher.
The technical analysis for this market is obviously very bullish, but I also recognize that we have gotten a little ahead of ourselves. After all, the 50 Day EMA is all the way down at the 1.14 level but is rising to perhaps try to meet the rest of the market. On the other hand, if we continue to go higher, we will have to deal with the 1.18 level, which is a large, round, psychologically significant figure, and an area that would attract a certain amount of attention. Regardless, it does seem as if the euro is hell-bent on going much higher given enough time, so I think most traders will be looking at this through the prism of perhaps trying to find a little bit of value.
Over the longer term, a lot of this will come down to what the Federal Reserve does, and you should keep in mind that the Non-Foreign Payroll announcement comes out on Thursday this week instead of Friday, so it will compress some of the volatility as far as time is concerned. Whether or not that influences this pair remains to be seen, but now market participants have priced in a 95% probability that the Federal Reserve cut interest rates in September, driving this pair higher.
Ready to trade our EUR/USD daily forecast? Here’s a list of some of the top forex brokers in Europe to check out.
Christopher Lewis has been trading Forex and has over 20 years experience in financial markets. Chris has been a regular contributor to Daily Forex since the early days of the site. He writes about Forex for several online publications, including FX Empire, Investing.com, and his own site, aptly named The Trader Guy. Chris favours technical analysis methods to identify his trades and likes to trade equity indices and commodities as well as Forex. He favours a longer-term trading style, and his trades often last for days or weeks.
Platinum price attempted to renew the bullish attempts by its rally to $1377.40, but its neediness to the positive momentum that pushed it to form weak and sideways trading, to settle near $1342.00 approaching from the bullish channel’s support at $1330.00.
The current scenario depends on the strength of the mentioned support, its stability makes us expect forming bullish waves, to confirm its stability above $1366.00 level, to ease the mission of resuming the bullish attack and reaching the next target near $1400.00, while breaking the support and holding below it will confirm activating the attempts of gathering the gains by reaching $1303.00 initially followed by $1275.00.
The expected trading range for today is between $1330.00 and $1382.00
Trend forecast: Bullish
EUR/JPY depreciates after two days of gains, trading around 169.40 during the Asian hours on Tuesday. The technical analysis of the daily chart shows that the currency cross moves upwards within the ascending channel pattern, strengthening the bullish bias.
The 14-day Relative Strength Index (RSI) is positioned slightly below the 70 mark, strengthening the bullish sentiment. However, if the RSI breaks above the 70 mark, the pair would be in an overbought zone and indicate a downward correction soon. Additionally, the short-term price momentum is stronger as the EUR/JPY cross remains above the nine-day Exponential Moving Average (EMA).
On the upside, the EUR/JPY cross may test the 12-month high at 169.86, which was recorded on June 30. A successful breach above this level would reinforce the market bias and support the currency cross to test the upper boundary of the ascending channel around 171.40.
The initial support appears at the nine-day EMA of 168.77. Further declines would weaken the short-term price momentum and put downward pressure on the EUR/JPY cross to fall toward the ascending channel’s lower boundary around 167.00, followed by the 50-day EMA at 165.32.
A break below the 50-day EMA would dampen the medium-term price momentum and prompt the pair to navigate the region around the “throwback resistance” at 161.00
The table below shows the percentage change of Euro (EUR) against listed major currencies today. Euro was the weakest against the Japanese Yen.
| USD | EUR | GBP | JPY | CAD | AUD | NZD | CHF | |
|---|---|---|---|---|---|---|---|---|
| USD | -0.04% | -0.09% | -0.27% | 0.01% | 0.11% | 0.06% | -0.13% | |
| EUR | 0.04% | -0.03% | -0.31% | 0.06% | 0.25% | 0.09% | -0.07% | |
| GBP | 0.09% | 0.03% | -0.14% | 0.12% | 0.28% | 0.14% | -0.03% | |
| JPY | 0.27% | 0.31% | 0.14% | 0.32% | 0.36% | 0.30% | 0.14% | |
| CAD | -0.01% | -0.06% | -0.12% | -0.32% | 0.08% | 0.01% | -0.16% | |
| AUD | -0.11% | -0.25% | -0.28% | -0.36% | -0.08% | -0.15% | -0.32% | |
| NZD | -0.06% | -0.09% | -0.14% | -0.30% | -0.01% | 0.15% | -0.18% | |
| CHF | 0.13% | 0.07% | 0.03% | -0.14% | 0.16% | 0.32% | 0.18% |
The heat map shows percentage changes of major currencies against each other. The base currency is picked from the left column, while the quote currency is picked from the top row. For example, if you pick the Euro from the left column and move along the horizontal line to the US Dollar, the percentage change displayed in the box will represent EUR (base)/USD (quote).
The USD/JPY is struggling to hold key support on Monday as bullish momentum continues to fade, with both the daily and weekly charts indicating weakening trend strength.
After failing to sustain gains above the 148.00 level last week, the pair has drifted lower, moving back toward rising trendline support near the 144.00 handle.
This trendline currently aligns with the 23.6% Fibonacci retracement of the January–April decline at 144.37, a zone the pair is now trying to defend. Monday’s price action shows USD/JPY attempting to stabilize above this support area, but momentum indicators suggest the move may lack conviction.
At the time of writing, the pair is trading around 144.19. With momentum softening across various timeframes, technical signals continue to indicate a range-bound market, increasing the risk of a downside break if support levels fail to hold.
The Average Directional Index (ADX) on the daily timeframe has dropped to 10.87, indicating an extremely weak trend, even more so than the weekly reading. This further confirms that recent moves are corrective in nature rather than part of a sustained trend.
The Moving Average Convergence Divergence (MACD) on the daily chart is also flattening out, with histogram bars losing strength and the signal line turning sideways. This suggests a lack of bullish follow-through after last week’s failed breakout near 148.00.
USD/JPY daily chart
The weekly chart below illustrates how longer-term moving averages continue to act as dynamic support and resistance for USD/JPY price action.
Last week, the pair surged after climbing above both the 20-week Simple Moving Average (SMA) and the 38.2% Fibonacci retracement at 147.14.
A weaker Yen helped fuel the recovery, briefly lifting the pair to retest the psychological 148.00 level.
However, the move stalled as profit-taking and a lack of bullish follow-through triggered a reversal. This is reflected in the weekly candle’s thin upper wick, indicating fading buying interest near 148.00. The pair has since slipped back below the 20-week SMA, which now turns into resistance at 145.92.
Momentum signals are softening. The ADX closed last week pointing lower, indicating weakening trend strength. Meanwhile, the MACD remains below the zero line, suggesting any upside seen so far is likely corrective rather than the start of a sustainable uptrend.
USD/JPY weekly chart
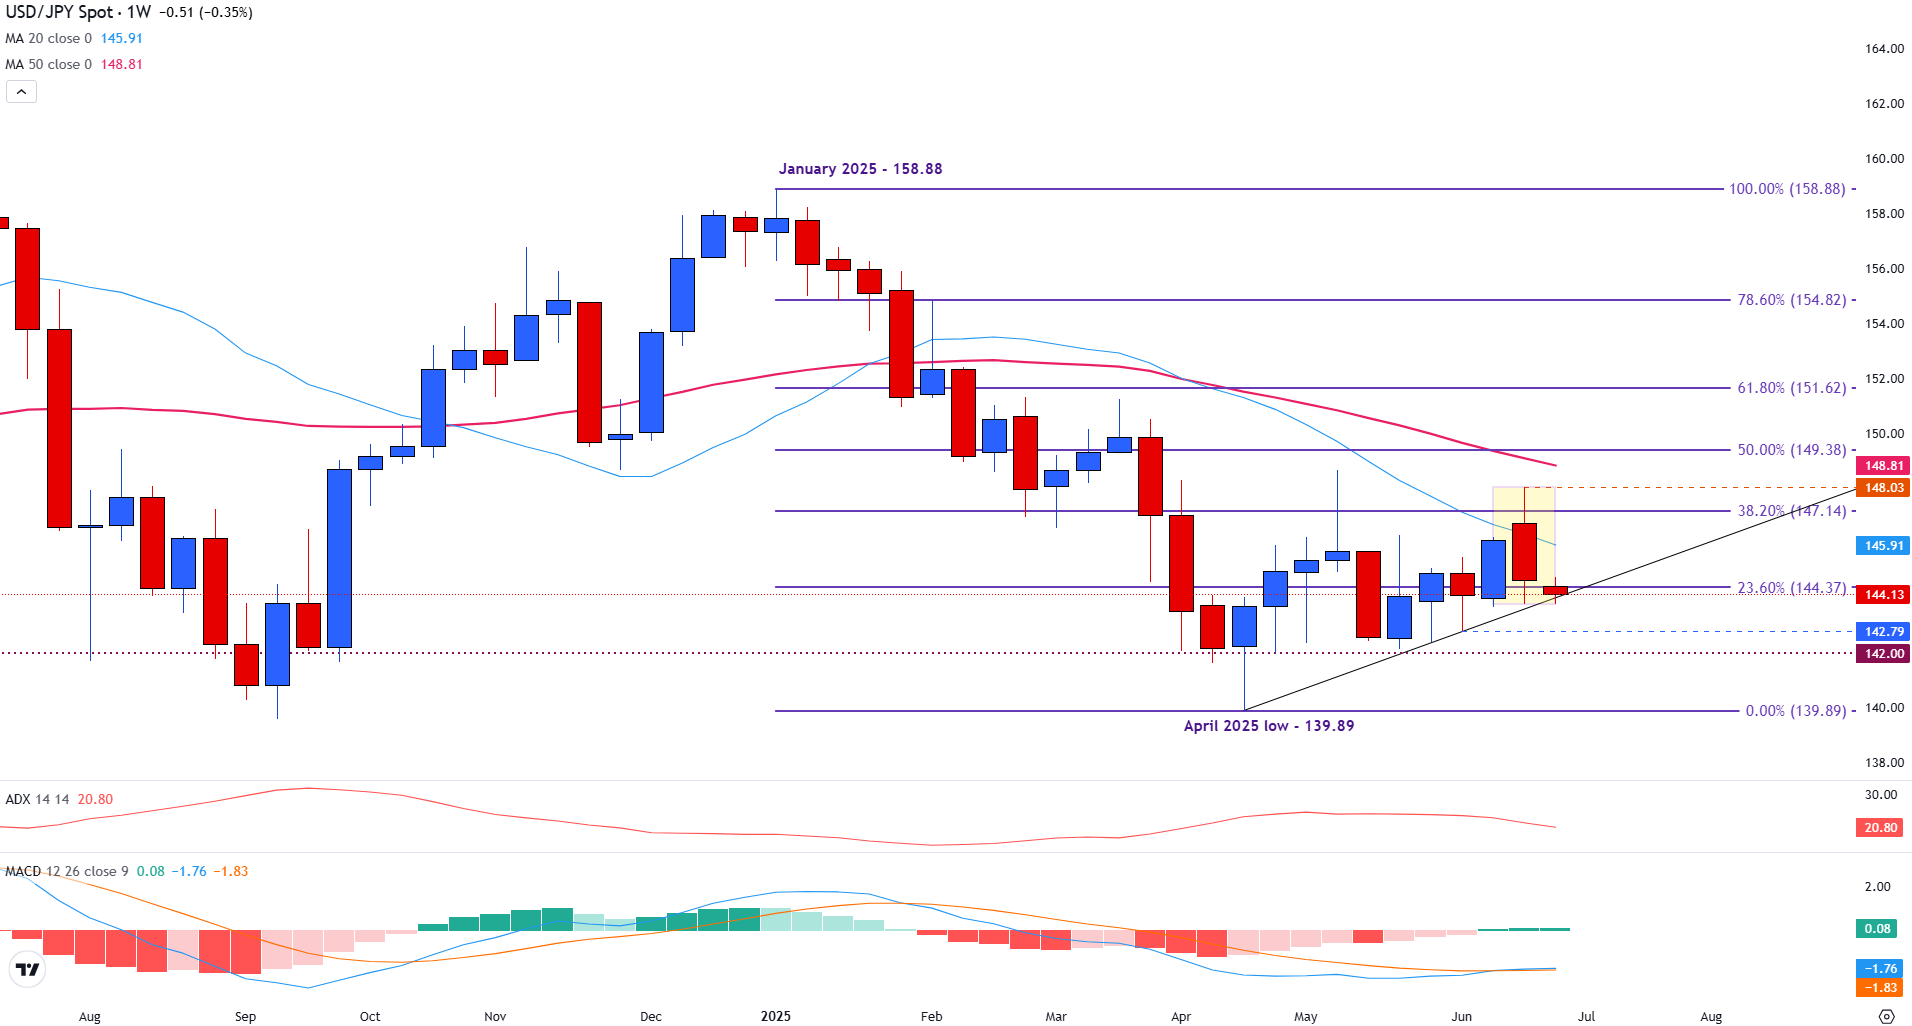
Looking to this week, Monday’s price action has pushed the pair toward rising trendline support, which is currently holding above the psychological 144.00 level.
A break below 144.00 could bring the 142.79 area into focus, the third touchpoint of the ascending trendline. Below that, 142.00 stands as another key psychological level, with a deeper move possibly exposing the 140.00 handle.
The April trendline remains a key short-term support structure; however, broader technical indicators suggest a cautious outlook. Both the 20 and 50-week SMAs continue to slope downward, reinforcing the longer-term bearish bias unless price can reclaim and hold above the 149.00 region.
The Japanese Yen (JPY) is one of the world’s most traded currencies. Its value is broadly determined by the performance of the Japanese economy, but more specifically by the Bank of Japan’s policy, the differential between Japanese and US bond yields, or risk sentiment among traders, among other factors.
One of the Bank of Japan’s mandates is currency control, so its moves are key for the Yen. The BoJ has directly intervened in currency markets sometimes, generally to lower the value of the Yen, although it refrains from doing it often due to political concerns of its main trading partners. The BoJ ultra-loose monetary policy between 2013 and 2024 caused the Yen to depreciate against its main currency peers due to an increasing policy divergence between the Bank of Japan and other main central banks. More recently, the gradually unwinding of this ultra-loose policy has given some support to the Yen.
Over the last decade, the BoJ’s stance of sticking to ultra-loose monetary policy has led to a widening policy divergence with other central banks, particularly with the US Federal Reserve. This supported a widening of the differential between the 10-year US and Japanese bonds, which favored the US Dollar against the Japanese Yen. The BoJ decision in 2024 to gradually abandon the ultra-loose policy, coupled with interest-rate cuts in other major central banks, is narrowing this differential.
The Japanese Yen is often seen as a safe-haven investment. This means that in times of market stress, investors are more likely to put their money in the Japanese currency due to its supposed reliability and stability. Turbulent times are likely to strengthen the Yen’s value against other currencies seen as more risky to invest in.
Last week’s higher swing low at $3.37 is more significant support as it is now part of the near-term bullish trend structure of higher swing lows. A bullish reversal following today’s low will be needed to further confirm trendline support. Support last week was seen at the confluence of the 61.8% Fibonacci retracement and the 200-Day MA. It was followed by a sharp one-day bullish reversal last Friday, which ended near the highs of the day.
The sharp bearish reversal seen today might be part of a shakeout before natural gas continues higher or the early signs of additional selling pressure that could lead to a break below the 200-Day MA and last week’s low. However, until then, the expectation is for the bullish trend to continue. It is contained within a long-term bull trend that began from the February 2024 lows.
On the daily chart, strength is not indicated until there is a rally above Friday’s high of $3.75. Therefore, given the relatively large price range for today, natural gas could trade within the range for a few days while it further test areas of dynamic support. Given its long-term nature and widespread use, the 200-Day is clearly showing support and needs to be respected unless signs of failure appear.
Finally, be aware that the swing low from last week is also a weekly low. Therefore, it takes on additional significance if it fails to hold. Moreover, that increases the chance for support to hold above that low as last week ended in a relatively strong position, in the top half of the week’s trading range.
For a look at all of today’s economic events, check out our economic calendar.
Moreover, Monay’s price action looks likely to complete a bullish hammer candlestick pattern. Notice that resistance at the high of the day of $36.23 was near the 20-Day MA. If the day ends with a hammer pattern and with the price of silver up for the day, there is the potential to reclaim the 20-Day line soon. An upside breakout will be triggered on a breakout above today’s high, which will also indicate a reclaim of the 20-Day line.
However, caution is warranted as silver is trading inside a small potential bull wedge consolidation pattern. The potential for follow-through in the near-term may be diminished due to activity within the pattern.
There is certainly the possibility that the wedge will continue to form as the pattern fills out. In addition to the wedge forming above an uptrend line, most of recent price action has occurred above a prior trend high at $34.87 as well. And last week a minimum 38.2% Fibonacci retracement of an internal upswing was completed, although support was found slightly above the $35.15 retracement level at $35.28.
Regardless of the potential for further consolidation within the confines of the wedge price structure, a bull breakout will trigger on a decisive rally above last week’s lower swing high of $36.84. That is also a weekly high. If the advance is subsequently confirmed by a breakout above the trend high of $37.32 from two weeks ago, it looks like silver could head towards the next higher target zone from $38.46 to $38.61.
For a look at all of today’s economic events, check out our economic calendar.

")

")


 Price Forecast: Holds Support as Bullish Wedge Pattern Develops")