The main category of Forex News.
You can use the search box below to find what you need.
[wd_asp id=1]
The main category of Forex News.
You can use the search box below to find what you need.
[wd_asp id=1]
GBP/USD extended its rally and touched its highest level since October 2021 above 1.3750 on Thursday. The heavy selling pressure surrounding the US Dollar (USD), on renewed concerns over the Federal Reserve losing its independence, could allow the pair to continue to push higher despite overbought conditions.
The Wall Street Journal (WSJ) reported late Wednesday that United States President Donald Trump was planning to announce his candidate for the next Chairman of the Federal Reserve (Fed) early, by September or October, to undermine Fed Chairman Jerome Powell. The news outlet claimed that Trump is evaluating Kevin Hassett’s, Director of the National Economic Council, and Treasury Secretary Scott Bessent’s commitment to lower interest rates as they are among the names that could potentially replace Powell. Read more…
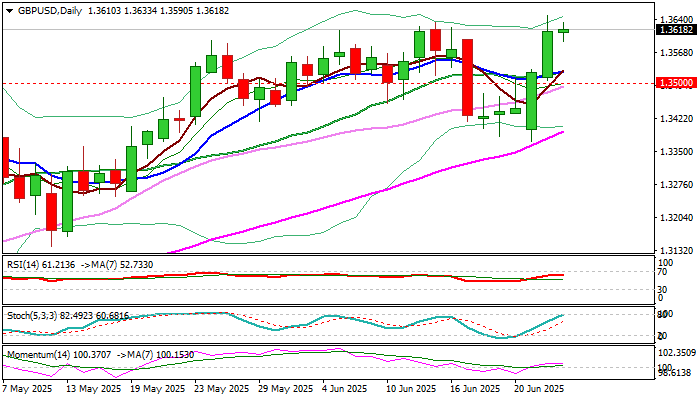
Cable remains steady and holds within a narrow consolidation just below new multi-month high (1.3648), posted on Tuesday, following strong bullish acceleration in past two days.
Revived risk appetite on growing confidence in still fragile ceasefire in the Middle East, continues to underpin near-term action, as markets await more details from Fed Powell’s second day of testimony to Senate Banking committee. Read more…
There were a couple other signs of strength today to be aware of. At the time of this writing, trading continues in the upper half of the day’s range. Therefore, the day may end with natural gas in a similar position. That would set up a bullish hammer candlestick pattern. Although it didn’t form at the bottom of the trend, it is close. Also, today’s high was $3.60, slightly above Wednesday’s high of $3.59. This shows strength and is a sign that buyers are moving back into the market.
Of course, the 200-Day MA represents potentially significant dynamic long-term trend support. It was tested twice recently. Once during the decline in April and again in May. Notice that that first approach fell further below the line and for more days than the second test. In both instances, the bullish recovery came quickly, once it started. If yesterday’s low turns into a swing low, it will show strength relative to the two prior declines to the 200-Day line.
A bull breakout will be indicated on a decisive rally above today’s high of $3.60. Near term support is at the 50-Day MA and the low for today, which is $3.40. An area of potential resistance is at the 20-Day MA, now at $3.65, and Tuesday’s high of $3.68. Further strengthening would change the slope of the rising trend channel as currently identified in green. The midline of the channel would be a first target zone if the bulls can retain control.
For a look at all of today’s economic events, check out our economic calendar.
Spot Gold advanced throughout the first half of Thursday, meeting buyers in the $3,350 region. It quickly returned to its recent comfort zone around $3,320-30, where it stays in the American session, despite broad US Dollar (USD) weakness.
Market players paid no attention to the safe-haven metal, as the focus shifted to potential interest rate cuts in the United States (US). President Donald Trump criticised Federal Reserve (Fed) Chairman Jerome Powell and claimed he is already studying his replacement, despite Powell’s mandate ending in May 2026.
US President Trump has long urged Chair Powell to trim interest rates. “We have no inflation. We have a tremendous economy. Hundreds of billions of dollars of tariff money is pouring in. Factories are being built,” he said in a press conference following the NATO Heads of State and Government Summit in the Netherlands. He then added he doubts about Powell’s mental abilities and called him names.
The USD plunged while stocks rallied amid speculation the Fed would end up trimming rates before previously anticipated.
Mixed US data did not help the Greenback. The country reported that Durable Goods Orders rose 16.4% in May, much better than the -6.6% posted in April. The Q1 Gross Domestic Product (GDP) was confirmed at -0.5% in the first quarter of the year, worse than the preliminary estimate of -0.2%.
Additionally, Initial Jobless Claims rose by 236K in the week ended June 21, beating expectations. Finally, the Goods Trade Balance posted a deficit of $96.6 billion in May, worse than the -$88.5 billion expected.
On Friday, the US will release the May Personal Consumption Expenditures (PCE) Price Index, foreseen stable on a monthly basis, albeit marginally higher on a yearly one.
From a technical point of view, the risk skews to the downside for Gold, although the downward momentum remains limited. The daily chart shows that XAU/USD met sellers around a flat 20 Simple Moving Average (SMA) at $3,355.80, while holding well above bullish 100 and 200 SMAs. Technical indicators, in the meantime, seesaw around their midlines without clear directional strength.
In the near term, and according to the 4-hour chart, the XAU/USD pair remains below its 20 and 100 SMAs, but holds above a directionless 200 SMA, with slides below the latter being quickly reverted. Technical indicators turned higher, but with the Momentum indicator within neutral levels and the Relative Strength Index (RSI) indicator at around 45, falling short of anticipating another leg north.
Support levels: 3,311.90 3,295.45 3,279.2
Resistance levels: 3,355.80 3,374.45 3,389.40
The Euro (EUR) is slipping against the Pound today, putting the brakes on a solid run that saw buyers firmly in control for nearly two weeks. The EUR/GBP cross is edging lower, trading around 0.8527 during the American trading hours, down about 0.40% on the day.
Zooming in on the daily chart, the broader trend structure remains constructive despite today’s short pullback. EUR/GBP continues to trace a well-respected rising channel that has guided price action since late January. Within this structure, buyers have consistently stepped in near the lower boundary and the 21-day EMA, which now sits close to 0.8496, cushioning dips.
However, the pair is encountering resistance near the 0.8550 psychological level, which aligns with the 50% Fibonacci retracement of the April peak to the May low. This area, overlapping with the channel’s midline, is drawing profit-taking and testing the strength of the recent bullish momentum.
Momentum signals suggest caution in the near term. The Relative Strength Index (RSI) has retreated from overbought levels and is currently at 59.83, implying the recent bullish push may be cooling off. Meanwhile, the MACD histogram remains in positive territory but hints at flattening momentum, signaling that the rally could stall without fresh catalysts.
A sustained daily close above 0.8600 would validate the bullish case and open the path toward 0.8740 — the April high and channel ceiling. Conversely, if the pullback deepens, the 21-day EMA near 0.8496 provides immediate support, followed by stronger buying interest around the 38.2% Fib at 0.8504 and the lower channel boundary near 0.8400.
The political backdrop has added volatility.
Recent remarks from former President Donald Trump have raised questions about the tenure of Fed Chair Jerome Powell. Trump’s comments suggested a potential leadership change at the central bank by September, casting doubt on the Fed’s policy independence. Although Powell reiterated a data-driven stance during congressional testimony, market participants viewed the political rhetoric as a possible signal of future easing.
This combination of declining yields, a weaker dollar, and institutional uncertainty continues to support precious metals, though gains in both gold and silver remain measured pending further economic data.
Still, the gold rally has remained contained, with resistance evident near the $3,345–$3,360 zone. A ceasefire between Middle Eastern powers has calmed geopolitical concerns, fueling a mild recovery in equities and limiting demand for safe-haven flows into bullion. Silver similarly faces resistance near $36.42, with traders cautious ahead of key macroeconomic releases.
Investor attention now turns to a batch of U.S. economic data, including jobless claims, durable goods orders, and final Q1 GDP figures. However, the core focus is Friday’s release of the Personal Consumption Expenditures (PCE) Price Index—a critical inflation metric for the Fed.
A softer print could reinforce the case for monetary easing and push gold higher, while a hotter number might stall the current uptrend. Gold and silver remain range-bound for now, but policy clarity and inflation data could define their next move.
The British pound extended its bullish momentum for the fourth consecutive session on Thursday, pushing the price to a fresh 41-month top near mid-1.3700. The rally stems from improving global risk sentiment and pressure on the US dollar driven by tension in Washington.
–Are you interested in learning more about the next cryptocurrency to explode? Check our detailed guide-
The greenback is experiencing a broader sell-off after President Trump renewed his criticism of the Federal Reserve’s independence. Trump labeled Fed Chair Powell as “terrible” after his testimony before Congress, where he reiterated the data dependence and showed no urgency to lower the rates. The US President also hinted at replacing Powell as soon as this summer. The Dollar Index plunged below 97.50 as markets interpreted Trump’s threat as a political intervention with the central bank.
While the US side faces central bank politics and mixed economic data, the British pound shows resilience. Domestic concerns about a cooling labor market and softer inflation hopes are striking at the pound’s strength. A British Chamber of Commerce survey revealed that around one-third of SMEs plan to cut jobs due to rising National Insurance costs. BoE Governor Bailey also pointed out the softening of the labor market during his testimony earlier this week.
Nevertheless, the markets remain primarily focused on US dynamics and broader risk sentiment. The ceasefire between Iran and Israel has lifted the risk appetite and shifted capital flows off the US dollar. Traders are now eyeing today’s US Q1 GDP and Friday’s US Core PCE Index report. Softer-than-expected data may increase the odds of a September rate cut, which will further weaken the US dollar.

The 4-hour chart of the GBP/USD reveals a strong bullish trend as the price lies well above the key SMAs. The pair broke the resistance at 1.3635 with a strong push towards 1.3750. The price is building the case to test the 1.4000 psychological mark.
–Are you interested in learning more about forex indicators? Check our detailed guide-
On the other hand, the pair may experience profit-taking as it has overextended, and the RSI indicates an extreme overbought condition near the 80.0 level. The pair may test the resistance-turned-support at 1.3635 before resuming the uptrend.
Looking to trade forex now? Invest at eToro!
68% of retail investor accounts lose money when trading CFDs with this provider. You should consider whether you can afford to take the high risk of losing your money.
The GBPCHF affected by stochastic rally to the overbought level, forming some bullish correctional waves, recording 1.1015 level, but the main stability within the bearish channel’s levels, which represents 1.1055 level for the extension of the extra main resistance for the stability of the moving average 55 above the current trading, these factors makes us wait for preferring the bearish bias domination, which might target 1.0975 and 1.0955.
Note that the price rally above the bearish channel’s resistance and provides a positive close, will confirm its move to the bullish track, to begin targeting several positive stations by reaching 1.1095 initially.
The expected trading range for today is between 1.0955 and 1.1040
Trend forecast: Bearish
The USD/JPY pair resumes this week’s sharp retracement slide from the 146.00 mark, or its highest level since May 13, and dives to a one-and-half-week low during the first half of the European session on Thursday. Spot prices slip below the 144.00 mark in the last hour and seem vulnerable to weaken further amid a bearish fundamental backdrop.
US President Donald Trump escalated his criticism of Federal Reserve Chair Jerome Powell for not cutting rates and floated the idea of firing him. Powell, testifying before Congress for the second day on Wednesday, acknowledged that the recent inflation reading had been more moderate, but he warned that new tariffs could change that. Powell reiterated that the central bank is well-positioned to wait to cut interest rates until they have a better handle on the impact of Trump’s trade policies on consumer prices.
Meanwhile, reports suggest that Trump was considering naming Powell’s successor by September or October, stoking concerns over the central bank’s independence. When asked if he is interviewing candidates to replace Powell, Trump said he has three or four people in mind as contenders for the top Fed job. This, along with bets that the US central bank could resume its rate-cutting cycle as soon as July, drags the US Dollar (USD) to its lowest level since March 2022 and is seen weighing heavily on the USD/JPY pair.
Moreover, traders have fully priced in that the Fed will lower rates by at least 50 basis points before the end of this year. In contrast, the Bank of Japan – although has been hesitant to raise interest rates – is still expected to stay on the path of monetary policy normalization as inflation persistently exceeds its target. Japan’s core inflation has remained well above the BoJ’s 2% target for well over three years and rose to a more than two-year high in May. Furthermore, Japan’s Corporate Services Producer Price Index – a leading indicator of consumer price inflation – has been trending above the 3% YoY rate for several consecutive months.
The divergent Fed-BoJ policy expectations turn out to be another factor exerting downward pressure on the USD/JPY pair and validate the near-term negative outlook. Traders now look forward to the US economic docket – featuring the final Q1 GDP print, the usual Weekly Initial Jobless Claims, Durable Goods Orders, and Pending Home Sales. Apart from this, speeches from influential FOMC members could provide some impetus to the pair ahead of the Tokyo CPI and the US Personal Consumption Expenditure (PCE) Price Index on Friday. Nevertheless, the aforementioned factors suggest that the path of least resistance for spot prices is to the downside.
The overnight failure ahead of the 146.00 mark and a subsequent break below the 144.70-144.65 area, or the 200-period Simple Moving Average (SMA) on the 4-hour chart, validates the negative outlook for the USD/JPY pair. Moreover, oscillators on hourly/daily charts have just started gaining negative traction and back the case for a slide towards intermediate support near the 143.70-143.65 region en route to sub-143.00 levels.
On the flip side, the 200-SMA support breakpoint, around the 144.65-144.70 zone, now seems to act as an immediate hurdle ahead of the 145.00 psychological mark and the 145.25-145.35 static barrier. A sustained strength beyond the latter could allow the USD/JPY pair to make a fresh attempt to conquer the 146.00 mark. The said handle might now act as a pivotal point, which if cleared could shift the near-term bias in favor of bulls and pave the way for additional near-term gains.
Gold’s rebound from Tuesday’s lows suggests that there is a strong support area at the $3,290-$3,300. The precious metal is trimming previous losses on Thursday, buoyed by a more favourable context, with US Treasury yields and the US Dollar tumbling.
The easing geopolitical concerns have undermined demand for the safe-haven Gold this week, but the yellow metal is drawing support on Thursday from US Dollar weakness on the back of increasing concerns about the Federal Reserve’s independence.
US President Donald Trump called Fed Chairman an “average mentally person”, after Powell reaffirmed his cautious stance towards further monetary easing, and aired the possibility of announcing his replacement way before the end of his term. The market has seen this move as a clear threat to the bank’s independence, which has brought the “Sell America” trade back to the table.
The rebound from Tuesday’s lows at $3,295 has extended beyond the $3,340 previous support (June 20 lows), confirming a deeper bullish correction. The pair night be on a C-D leg of a small Gartley pattern, heading to the descending trendline resistance from mid-June highs, at $3,450, now at $3,365.
A confirmation above this level would signal a trend shift and move the focus towards the $3,400 area, which capped bulls on June 17, 18, and 22.
On the downside, a rejection at the mentioned trendline might seek support at the intraday low $3,330 ahead of the previously mentioned $3,295 (June 9,24 lows)
(This story was corrected on June 26 at 11:19 GMT to say that the gold is targeting $3,365 in the title, and $3,300 in the first paragraph and not $3.365 and $3.300, as previously reported.)
Gold has played a key role in human’s history as it has been widely used as a store of value and medium of exchange. Currently, apart from its shine and usage for jewelry, the precious metal is widely seen as a safe-haven asset, meaning that it is considered a good investment during turbulent times. Gold is also widely seen as a hedge against inflation and against depreciating currencies as it doesn’t rely on any specific issuer or government.
Central banks are the biggest Gold holders. In their aim to support their currencies in turbulent times, central banks tend to diversify their reserves and buy Gold to improve the perceived strength of the economy and the currency. High Gold reserves can be a source of trust for a country’s solvency. Central banks added 1,136 tonnes of Gold worth around $70 billion to their reserves in 2022, according to data from the World Gold Council. This is the highest yearly purchase since records began. Central banks from emerging economies such as China, India and Turkey are quickly increasing their Gold reserves.
Gold has an inverse correlation with the US Dollar and US Treasuries, which are both major reserve and safe-haven assets. When the Dollar depreciates, Gold tends to rise, enabling investors and central banks to diversify their assets in turbulent times. Gold is also inversely correlated with risk assets. A rally in the stock market tends to weaken Gold price, while sell-offs in riskier markets tend to favor the precious metal.
The price can move due to a wide range of factors. Geopolitical instability or fears of a deep recession can quickly make Gold price escalate due to its safe-haven status. As a yield-less asset, Gold tends to rise with lower interest rates, while higher cost of money usually weighs down on the yellow metal. Still, most moves depend on how the US Dollar (USD) behaves as the asset is priced in dollars (XAU/USD). A strong Dollar tends to keep the price of Gold controlled, whereas a weaker Dollar is likely to push Gold prices up.
The GBPCHF affected by stochastic rally to the overbought level, forming some bullish correctional waves, recording 1.1015 level, but the main stability within the bearish channel’s levels, which represents 1.1055 level for the extension of the extra main resistance for the stability of the moving average 55 above the current trading, these factors makes us wait for preferring the bearish bias domination, which might target 1.0975 and 1.0955.
Note that the price rally above the bearish channel’s resistance and provides a positive close, will confirm its move to the bullish track, to begin targeting several positive stations by reaching 1.1095 initially.
The expected trading range for today is between 1.0955 and 1.1040
Trend forecast: Bearish


 & Silver Price Forecast: Range-Bound Ahead of Inflation and Fed Signals")


