The main category of Forex News.
You can use the search box below to find what you need.
[wd_asp id=1]
The main category of Forex News.
You can use the search box below to find what you need.
[wd_asp id=1]
Above: Emmanuel Macron. GUE/NGL, accessed Flickr, reproduced under CC Licensing.
Pound sterling starts the new week with a solid advance against the euro, but can it make it stick?
The pound to euro exchange rate (GBP/EUR) starts the new week with a solid 0.36% gain, hitting 1.1521, which is the highest level since September 18.
The move looks to be part of a broader selloff in the euro, as euro-dollar trades nearly two-thirds of a per cent down at 1.1664. In fact, looking at the performance chart, the euro is down against everything apart from the yen (which has some domestic politics on its mind).
We suspect the movement is linked to news of another French Prime Minister resigning: French President Emmanuel Macron last night unveiled his new cabinet which immediately drew criticism from across the political spectrum, most likely because it was broadly the same as the last one.
Prime Minister Sebastien Lecornu announced his resignation this morning, leaving France rudderless and significantly raising uncertainty on multiple fronts.

Pound Sterling Live consistently delivers stronger rates than major UK banks.
In July, you could have saved up to €1,720 on a £50,000 transfer thanks to our competitive pricing.
Based on average GBP/EUR rates observed in July.
France’s economy has been struggling of late as a result of this uncertainty, and today’s news certainly bakes this theme into the outlook.
Concerns will build as to how the country can consolidate its debt amidst a political void, with matters certainly not being helped by further economic underperformance: economies must grow to service their debt.
We will be watching French sovereign debt yields through the day to gauge just how worried markets are. But for now at least, the currency is showing its displeasure.
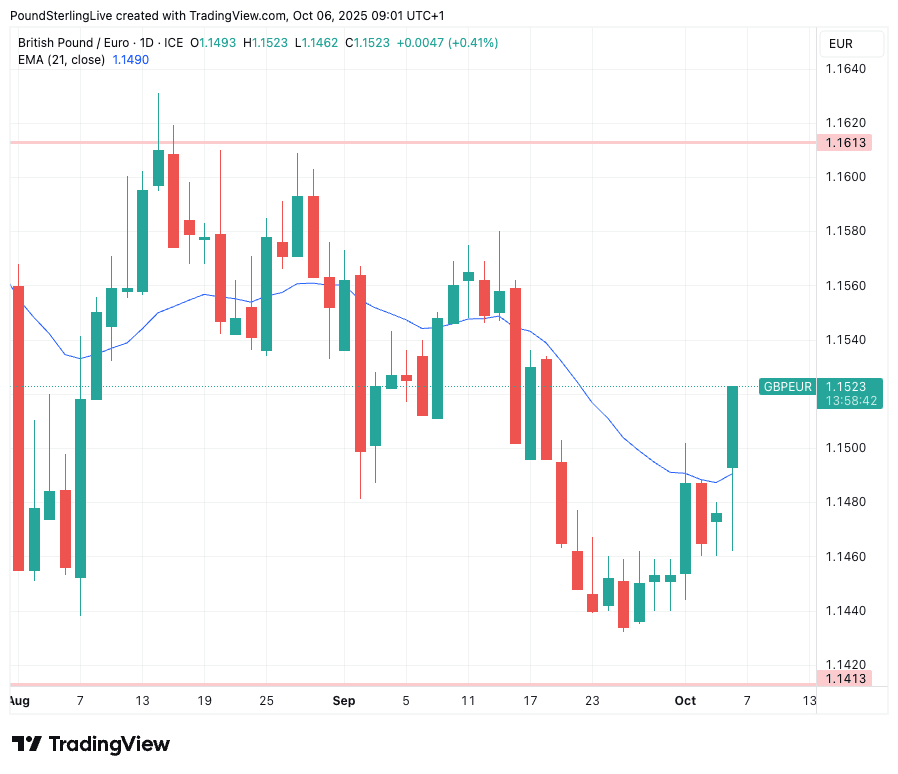
In response, GBP/EUR rises through 1.15 and above the 21-day exponential moving average (at 1.1490), a key technical level that must be breached and defended if sterling is to enter a short-term uptrend.
If GBP/EUR closes above the 21-day, then 1.1560 becomes achievable in the coming days. Those with FX payment requirements should consider locking in current levels for a portion of their payment, and setting an order for higher levels to ensure they are not missed.
GBP/EUR had been under pressure through the August-September period but ultimately formed a base above 1.1440 in late September and early October.
The jump on Monday underpins that base and could even allow for a short-term rally to form.
However, the UK’s own problems won’t be forgotten and we think GBP/EUR upside could prove limited as a result.
Rally-busting issues include the Bank of England’s desire to raise interest rates at any given opportunity and the government’s inability to control spending, which inevitably boosts inflation and increases the odds of tax rises at the November 26 budget.
“The UK rates market doesn’t fully price a BoE cut until the end of winter, next March. The Eurozone rates market doesn’t price a further ECB cut for a very long time indeed,” says Kit Juckes, FX analyst at Société Générale. “What might happen if we saw an earlier BoE move, due to a deterioration in the economic backdrop. Winter is coming, and so are higher taxes.”
Juckes says such outcomes could press a move in EUR/GBP to 0.90 and GBP/EUR to 1.11.
Pound sterling will keep its soft underbelly thanks to a challenging fundamental narrative linked to the government’s spending policies and the Bank of England’s inability to bring inflation under control.
The budget forecasting process began last week, with the Office for Budget Responsibility (OBR) giving the government an initial ‘pre-measures forecast, one of a number of iterations ahead of the day itself.
OBR downgrades to productivity forecasts, increased social spending and higher debt costs mean the Chancellor will need to raise taxes, raising uncertainty for businesses and households.
For financial markets, the impact this uncertainty has on data will be important. Also, the market will be nervous about whether or not the government passes the credibility test when addressing the UK’s difficult fiscal path.
“Sterling markets will be sensitive to any leaks on its contents,” says a note from Lloyds Bank.
The new week commences with a timely article in Bloomberg that points to rising gold and bitcoin prices, which come at the expense of some currencies. It describes the phenomenon as the “debasement trade”.
Investors are worried about inflation and lax fiscal policies, which ultimately debase traditional currencies.
The pound is a prime example of a currency at risk of debasement: the government has the spending taps turned fully on, ensuring UK inflation is the highest in the G7, and rising. And despite this, the Bank of England continues to insist it must go further with interest rate cuts.
In short, British authorities are doing nothing to protect the currency from debasement, something that will surely have an impact on the pound’s long-term trajectory.

EUR/USD stays under heavy bearish pressure in the European session on Monday and trades below 1.1700. In the absence of high-impact data releases, investors are likely to remain focused on political developments in the United States (US) and France.
The table below shows the percentage change of Euro (EUR) against listed major currencies today. Euro was the weakest against the Australian Dollar.
| USD | EUR | GBP | JPY | CAD | AUD | NZD | CHF | |
|---|---|---|---|---|---|---|---|---|
| USD | 0.37% | 0.07% | 0.59% | -0.07% | -0.25% | -0.07% | 0.21% | |
| EUR | -0.37% | -0.41% | 0.14% | -0.47% | -0.63% | -0.48% | -0.20% | |
| GBP | -0.07% | 0.41% | 0.65% | -0.06% | -0.26% | -0.07% | 0.21% | |
| JPY | -0.59% | -0.14% | -0.65% | -0.59% | -0.87% | -0.71% | -0.41% | |
| CAD | 0.07% | 0.47% | 0.06% | 0.59% | -0.14% | -0.01% | 0.28% | |
| AUD | 0.25% | 0.63% | 0.26% | 0.87% | 0.14% | 0.19% | 0.47% | |
| NZD | 0.07% | 0.48% | 0.07% | 0.71% | 0.00% | -0.19% | 0.28% | |
| CHF | -0.21% | 0.20% | -0.21% | 0.41% | -0.28% | -0.47% | -0.28% |
The heat map shows percentage changes of major currencies against each other. The base currency is picked from the left column, while the quote currency is picked from the top row. For example, if you pick the Euro from the left column and move along the horizontal line to the US Dollar, the percentage change displayed in the box will represent EUR (base)/USD (quote).
News of French Prime Minister Sebastien Lecornu having resigned after taking that position just a few weeks ago triggered a Euro (EUR) selloff in the European session on Monday. France’s CAC 40 Index is down about 2% following this headline, as markets grow increasingly concerned over a deepening political crisis in France.
Lecornu was reportedly facing mounting pressure from leftist lawmakers over his budget plans, per Reuters.
Meanwhile, the US government shutdown continues with no apparent progress toward a funding agreement in sight. Over the weekend, White House National Economic Council Director, Kevin Hassett, noted that layoffs could start if President Donald Trump decided that negotiations are “absolutely going nowhere.”
In the absence of high-impact data releases, investors could refrain from placing themselves for a Euro recovery because of the political drama in France.
Later in the American session, European Central Bank (ECB) President Christine Lagarde will deliver a statement before the Committee on Economic and Monetary Affairs of the European Parliament.
The Relative Strength Index (RSI) indicator on the 4-hour chart dropped below 40 and EUR/USD pierced through the 200-period Simple Moving Average (SMA), reflecting a buildup in bearish momentum.
On the downside, 1.1640 (Fibonacci 50% retracement of the latest uptrend) aligns as the first support level for EUR/USD ahead of 1.1580 (Fibonacci 61.8% retracement) and 1.1500 (round level, Fibonacci 78.6% retracement). Looking north, resistance levels could be spotted at 1.1700-1.1715 (Fibonacci 38.2% retracement, 200-period SMA) and 1.1750-1.1760 (100-period SMA, Fibonacci 23.6% retracement).
The Euro is the currency for the 19 European Union countries that belong to the Eurozone. It is the second most heavily traded currency in the world behind the US Dollar. In 2022, it accounted for 31% of all foreign exchange transactions, with an average daily turnover of over $2.2 trillion a day.
EUR/USD is the most heavily traded currency pair in the world, accounting for an estimated 30% off all transactions, followed by EUR/JPY (4%), EUR/GBP (3%) and EUR/AUD (2%).
The European Central Bank (ECB) in Frankfurt, Germany, is the reserve bank for the Eurozone. The ECB sets interest rates and manages monetary policy.
The ECB’s primary mandate is to maintain price stability, which means either controlling inflation or stimulating growth. Its primary tool is the raising or lowering of interest rates. Relatively high interest rates – or the expectation of higher rates – will usually benefit the Euro and vice versa.
The ECB Governing Council makes monetary policy decisions at meetings held eight times a year. Decisions are made by heads of the Eurozone national banks and six permanent members, including the President of the ECB, Christine Lagarde.
Eurozone inflation data, measured by the Harmonized Index of Consumer Prices (HICP), is an important econometric for the Euro. If inflation rises more than expected, especially if above the ECB’s 2% target, it obliges the ECB to raise interest rates to bring it back under control.
Relatively high interest rates compared to its counterparts will usually benefit the Euro, as it makes the region more attractive as a place for global investors to park their money.
Data releases gauge the health of the economy and can impact on the Euro. Indicators such as GDP, Manufacturing and Services PMIs, employment, and consumer sentiment surveys can all influence the direction of the single currency.
A strong economy is good for the Euro. Not only does it attract more foreign investment but it may encourage the ECB to put up interest rates, which will directly strengthen the Euro. Otherwise, if economic data is weak, the Euro is likely to fall.
Economic data for the four largest economies in the euro area (Germany, France, Italy and Spain) are especially significant, as they account for 75% of the Eurozone’s economy.
Another significant data release for the Euro is the Trade Balance. This indicator measures the difference between what a country earns from its exports and what it spends on imports over a given period.
If a country produces highly sought after exports then its currency will gain in value purely from the extra demand created from foreign buyers seeking to purchase these goods. Therefore, a positive net Trade Balance strengthens a currency and vice versa for a negative balance.
Silver (XAG/USD) appreciates for the second consecutive day on Monday, to reach fresh 4-year highs at $48.75, with downside attempts contained so far above last week’s highs at $48.30.
Precious metals are thriving on Monday as a combination of a US government shutdown, which looks to be an extended one, expectations of a looser monetary policy in Japan, and the growing political uncertainty in France, have prompted investors to find alternative assets.
From a technical perspective, the pair remains trading higher within an ascending channel from id September lows. The 4-Hour RSI, however, is showing some bearish divergence, which should act as a warning for buyers.
Bulls are likely to be challenged at $ 49.24-$49.30, where the 161.8% of the September 17 to September 24 range meets the top of the ascending channel. Further up, the $50.00 psychological level emerges as the next bullish target..
Downside attempts are being contained above $48.30 (September 3 high) for now. Below here, the 47.60 area (Intra-day support and trendline support, at $46.90 would come into focus.
Silver is a precious metal highly traded among investors. It has been historically used as a store of value and a medium of exchange. Although less popular than Gold, traders may turn to Silver to diversify their investment portfolio, for its intrinsic value or as a potential hedge during high-inflation periods. Investors can buy physical Silver, in coins or in bars, or trade it through vehicles such as Exchange Traded Funds, which track its price on international markets.
Silver prices can move due to a wide range of factors. Geopolitical instability or fears of a deep recession can make Silver price escalate due to its safe-haven status, although to a lesser extent than Gold’s. As a yieldless asset, Silver tends to rise with lower interest rates. Its moves also depend on how the US Dollar (USD) behaves as the asset is priced in dollars (XAG/USD). A strong Dollar tends to keep the price of Silver at bay, whereas a weaker Dollar is likely to propel prices up. Other factors such as investment demand, mining supply – Silver is much more abundant than Gold – and recycling rates can also affect prices.
Silver is widely used in industry, particularly in sectors such as electronics or solar energy, as it has one of the highest electric conductivity of all metals – more than Copper and Gold. A surge in demand can increase prices, while a decline tends to lower them. Dynamics in the US, Chinese and Indian economies can also contribute to price swings: for the US and particularly China, their big industrial sectors use Silver in various processes; in India, consumers’ demand for the precious metal for jewellery also plays a key role in setting prices.
Silver prices tend to follow Gold’s moves. When Gold prices rise, Silver typically follows suit, as their status as safe-haven assets is similar. The Gold/Silver ratio, which shows the number of ounces of Silver needed to equal the value of one ounce of Gold, may help to determine the relative valuation between both metals. Some investors may consider a high ratio as an indicator that Silver is undervalued, or Gold is overvalued. On the contrary, a low ratio might suggest that Gold is undervalued relative to Silver.
The technical analysis for this market is very sideways and has been for a while, with the brief exception of a quick attempt to break out and above the ¥149 level. The market continues to see a lot of noisy behavior but that makes sense because quite frankly there are a lot of questions out there as to whether or not we are going to see risk appetite pick up or drop. Furthermore, you also have to keep in mind that recently we have been bouncing around between the ¥146 level on the bottom, and the ¥149 level on the top. As we try to break out of there, we have seen a complete repudiation of that, but we have not broken down below the ¥146 level with any significance to show signs of potentially continued bearishness.

Ultimately, I still like the idea of buying short-term dips looking for collecting swaps at the end of each day, as interest rate differential still most certainly favors the United States dollar. If we get any type of “risk on move” in the overall markets, then it’s likely that this pair will rally as well. I still favor the upside but I fully admit that this is a very noisy and choppy market.
Want to trade our USD/JPY forex analysis and predictions? Here’s a list of forex brokers in Japan to check out.
Christopher Lewis has been trading Forex and has over 20 years experience in financial markets. Chris has been a regular contributor to Daily Forex since the early days of the site. He writes about Forex for several online publications, including FX Empire, Investing.com, and his own site, aptly named The Trader Guy. Chris favours technical analysis methods to identify his trades and likes to trade equity indices and commodities as well as Forex. He favours a longer-term trading style, and his trades often last for days or weeks.
The GBPJPY pair opened today’s trading with a big price gap, to settle above the barrier at 200.45, recording big gains by its rally towards 202.10, approaching the initial main target at 202.40, forming 161.8%Fibonacci extension level that appears in the above image.
And that confirms the price surrender to the bullish bias dominance, by providing extra positive momentum by the main indicators, which increase the chances of surpassing 202.40 level, to begin achieving extra gains by its rally towards 202.85 reaching 1.809% Fibonacci extension level near 203.85.
The expected trading range for today is between 200.60 and 202.80
Trend forecast: Bullish
Whether or not that remains the case, you’ll have to wait and see. All things being equal, this is a market that may have to think about the fact that maybe the economy is slowing down if that’s the case that drives a demand for the US dollar. If we break through the 50 day EMA, the uptrend line as well, then we start to target 1.16. Anything below there, then I think the euro is in trouble. To the upside, the 1.18 level continues to be resistant. Breaking above that is a very bullish sign and probably has the euro testing the highs during the FOMC press conference, is right around the 1.19 level. We are still in an uptrend that has not changed, but what we are starting to see is a serious lack of momentum. We have to ask the question, are we just working off some of the excess froth or are we looking at an area between 1.18 and 1.20 that was very influential multiple times going back about eight years. Have we gone too far? If we get more risk off, the answer will be obvious.
Ready to trade our daily Forex forecast? Here’s a list of some of the best regulated forex brokers to check out.
Christopher Lewis has been trading Forex and has over 20 years experience in financial markets. Chris has been a regular contributor to Daily Forex since the early days of the site. He writes about Forex for several online publications, including FX Empire, Investing.com, and his own site, aptly named The Trader Guy. Chris favours technical analysis methods to identify his trades and likes to trade equity indices and commodities as well as Forex. He favours a longer-term trading style, and his trades often last for days or weeks.
The GBPJPY pair opened today’s trading with a big price gap, to settle above the barrier at 200.45, recording big gains by its rally towards 202.10, approaching the initial main target at 202.40, forming 161.8%Fibonacci extension level that appears in the above image.
And that confirms the price surrender to the bullish bias dominance, by providing extra positive momentum by the main indicators, which increase the chances of surpassing 202.40 level, to begin achieving extra gains by its rally towards 202.85 reaching 1.809% Fibonacci extension level near 203.85.
The expected trading range for today is between 200.60 and 202.80
Trend forecast: Bullish
EUR/JPY opened at a gap-up, extending its gains and trading around 176.20 during the Asian hours on Monday. The technical analysis of the daily chart indicates strengthening of a bullish bias as the currency cross has broken above the ascending channel pattern.
Additionally, the 14-day Relative Strength Index (RSI) rises toward the 70 mark, suggesting that bullish bias is strengthening. A break above the 70 mark would suggest an overbought situation and a downward correction anytime soon. Additionally, the short-term price momentum is stronger as the EUR/JPY cross is positioned above the nine-day Exponential Moving Average (EMA).
On the upside, the EUR/JPY cross reached an all-time high of 176.24, which was recorded on October 6. As the market bias is bullish, the cross may explore the region around the psychological level of 177.00.
A pullback toward the ascending channel would prompt the EUR/JPY cross to test the nine-day EMA of 174.02. Further declines would weaken the short-term price momentum and put downward pressure on the currency cross to approach the lower boundary of the channel around 173.00, followed by the 50-day EMA at 172.64.
A break below the 50-day EMA would weaken the medium-term price momentum and put downward pressure on the EUR/JPY cross to navigate the region around the three-month low of 169.72, recorded on July 31.
(The story was corrected on October 6 at 06:25 GMT, to say in the second paragraph that bullish bias is strengthening, and not the bearish bias.)
The table below shows the percentage change of Euro (EUR) against listed major currencies today. Euro was the strongest against the Japanese Yen.
| USD | EUR | GBP | JPY | CAD | AUD | NZD | CHF | |
|---|---|---|---|---|---|---|---|---|
| USD | 0.01% | -0.00% | 0.57% | -0.04% | -0.29% | -0.23% | -0.04% | |
| EUR | -0.01% | -0.12% | 0.48% | -0.09% | -0.34% | -0.28% | -0.09% | |
| GBP | 0.00% | 0.12% | 0.69% | 0.03% | -0.22% | -0.16% | 0.03% | |
| JPY | -0.57% | -0.48% | -0.69% | -0.56% | -0.91% | -0.87% | -0.66% | |
| CAD | 0.04% | 0.09% | -0.03% | 0.56% | -0.21% | -0.19% | -0.01% | |
| AUD | 0.29% | 0.34% | 0.22% | 0.91% | 0.21% | 0.07% | 0.25% | |
| NZD | 0.23% | 0.28% | 0.16% | 0.87% | 0.19% | -0.07% | 0.18% | |
| CHF | 0.04% | 0.09% | -0.03% | 0.66% | 0.01% | -0.25% | -0.18% |
The heat map shows percentage changes of major currencies against each other. The base currency is picked from the left column, while the quote currency is picked from the top row. For example, if you pick the Euro from the left column and move along the horizontal line to the US Dollar, the percentage change displayed in the box will represent EUR (base)/USD (quote).
Gold has extended the previous advance, rallying as much as 1% so far this Monday to clinch a new all-time high near $3,925.
Gold buyers appear unstoppable at the start of a fresh week, early Monday, despite the renewed US Dollar (USD) upswing and a risk-on rally on global stocks.
Gold is finding demand due to increased safe-haven flows, mainly driven by the murky United States (US) economic outlook in the face of the extended government shutdown, which has entered a seventh day.
There are no public signs that the Republican and Democratic lawmakers are making any efforts to end the impasse on reopening the federal government.
This deadlock has raised worries over layoffs amid already weakening US labor market conditions.
Asked on Sunday night when federal workers would be fired as he has threatened to do, US President Donald Trump said that “it’s taking place right now and it’s all because of the Democrats.”
“The Democrats are causing the loss of a lot of jobs,” Trump added.
Delayed US economic reports also add to the uncertainty over the US Federal Reserve’s (Fed) outlook on interest rates beyond the October 28-29 meeting.
Markets have fully priced in a 25 basis points (bps) rate cut later this month, with chances of a December rate reduction standing at about 94%, according to the CME Group’s FedWatch Tool.
The Fed’s dovish narrative combined with the US political and fiscal concerns outweighs the risk-on mood and the USD/JPY rally-driven USD rebound, powering the Gold price upside.
The Japanese Yen (JPY) sinks against the USD after “Sanae Takaichi won the Japanese ruling Liberal Democratic Party (LDP) leadership election at the weekend, setting the country on course for more expansionary fiscal policy and complicating the task facing the Bank of Japan (BoJ),” per Reuters.
Looking ahead, any fresh updates on the US shutdown talks could have a significant impact on the Greenback and Gold.
Meanwhile, any private data from the US will be closely eyed alongside speeches from Fed officials for fresh insights on the US economy and the Fed’s path forward on interest rates.
As observed on the four-hour chart, the 14-day Relative Strength Index (RSI) is approaching the overbought region, currently near 67, suggesting that there is more room to the upside in the upcoming sessions.
Buyers now target the $3,950 psychological barrier on the way to the $4,000 mark.
Alternatively, if buyers take a breather and a pullback sets in, Gold could test the initial support at $3,872, the 21-Simple Moving Average (SMA), below which a drop toward the 50-SMA at $3,820 will be inevitable.
A deeper correction could target the 100-SMA at $3,753.
Gold has played a key role in human’s history as it has been widely used as a store of value and medium of exchange. Currently, apart from its shine and usage for jewelry, the precious metal is widely seen as a safe-haven asset, meaning that it is considered a good investment during turbulent times. Gold is also widely seen as a hedge against inflation and against depreciating currencies as it doesn’t rely on any specific issuer or government.
Central banks are the biggest Gold holders. In their aim to support their currencies in turbulent times, central banks tend to diversify their reserves and buy Gold to improve the perceived strength of the economy and the currency. High Gold reserves can be a source of trust for a country’s solvency. Central banks added 1,136 tonnes of Gold worth around $70 billion to their reserves in 2022, according to data from the World Gold Council. This is the highest yearly purchase since records began. Central banks from emerging economies such as China, India and Turkey are quickly increasing their Gold reserves.
Gold has an inverse correlation with the US Dollar and US Treasuries, which are both major reserve and safe-haven assets. When the Dollar depreciates, Gold tends to rise, enabling investors and central banks to diversify their assets in turbulent times. Gold is also inversely correlated with risk assets. A rally in the stock market tends to weaken Gold price, while sell-offs in riskier markets tend to favor the precious metal.
The price can move due to a wide range of factors. Geopolitical instability or fears of a deep recession can quickly make Gold price escalate due to its safe-haven status. As a yield-less asset, Gold tends to rise with lower interest rates, while higher cost of money usually weighs down on the yellow metal. Still, most moves depend on how the US Dollar (USD) behaves as the asset is priced in dollars (XAU/USD). A strong Dollar tends to keep the price of Gold controlled, whereas a weaker Dollar is likely to push Gold prices up.