The main category of Forex News.
You can use the search box below to find what you need.
[wd_asp id=1]
The main category of Forex News.
You can use the search box below to find what you need.
[wd_asp id=1]
The British pound has fallen again, as we continue to see a lot of questions about the Japanese yen and the Bank of Japan itself. With this, it is imperative that traders watch for Japanese headlines.
The British pound has broken back and forth during the course of the trading session on Tuesday as we are just killing time here. We are trying to figure out where we are going to go next. We are dancing around sideways just above the 50-day EMA, but it’s worth noting that the British pound is being propelled higher in general against many currencies due to the interest rate differential.

That being said, though, this is a little bit different in the sense that the market is facing a lot of questions about whether or not the Bank of Japan is going to intervene again. After all, intervention by the Bank of Japan has been rather brutal recently, and with that being the case, you need to be very cautious at this point. Ultimately, this is a market that continues to see a lot of upward pressure, but I also recognize that the market still sees a lot of support at the 215 yen level. The 215 yen level is an area that previously had been resistant.
The 219 yen level above has been a massive resistance barrier, and I do think that eventually we try to grind to the upside, but it is worth noting that there is that fear of the Bank of Japan intervening.
Because of this, I keep my position size reasonable in the yen-denominated pairs, with the exception of dollar/yen; I’ve been in that for several months. This one I like as well, but it’s a smaller position for me. Ultimately, this is a market that I’m still bullish on, with that one exception that could cause a bit of a wiggle here and there.
Begin trading our daily forecasts and analysis. Here is a list of Forex brokers in Japan to work with.
Christopher Lewis is a technical analyst and market commentator at DailyForex with more than two decades of trading experience in Forex and other leveraged markets. Based in Columbus, Ohio, he specializes in chart-based analysis of major currency pairs, stock indices, commodities, and energy markets, focusing on clear support and resistance levels, trend structure, and risk management. Christopher produces daily written and video analysis for traders who rely on technical setups to navigate volatile market conditions
As seen on: Pairs Of Aces Podcast,The Trader Guy, FXEmpire
Select market data provided by ICE Data Services. Select reference data provided by FactSet. Copyright © 2026 FactSet Research Systems Inc.Copyright © 2026, American Bankers Association. CUSIP Database provided by FactSet Research Systems Inc. All rights reserved. SEC filings and other documents provided by Quartr.© 2026 TradingView, Inc.
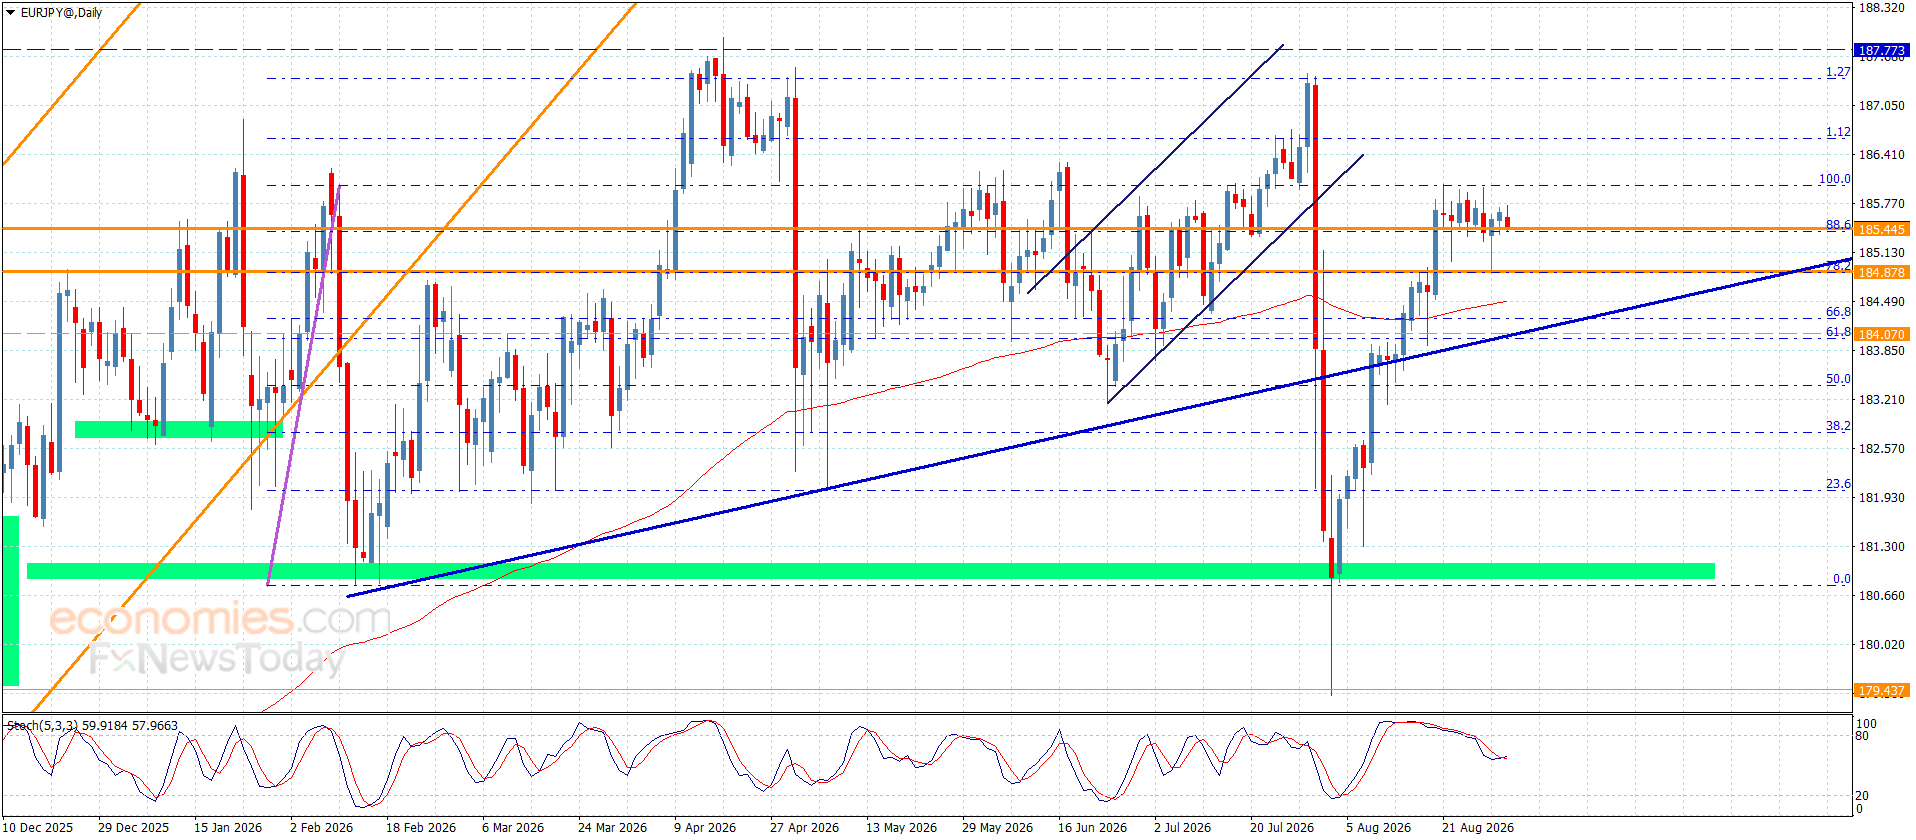
The pair’s price has no choice but to activate its bearish corrective move, given its repeated stability below the 186.05 barrier. The price has currently started forming some bearish waves, reaching around 185.30.
The price now needs fresh bearish momentum to renew pressure on the 184.85 level. A break below this obstacle could extend the corrective trading move in the near term toward 184.40 and 184.00, respectively.
The expected trading range for today is between 184.40 and 185.70
Trend forecast: Bearish
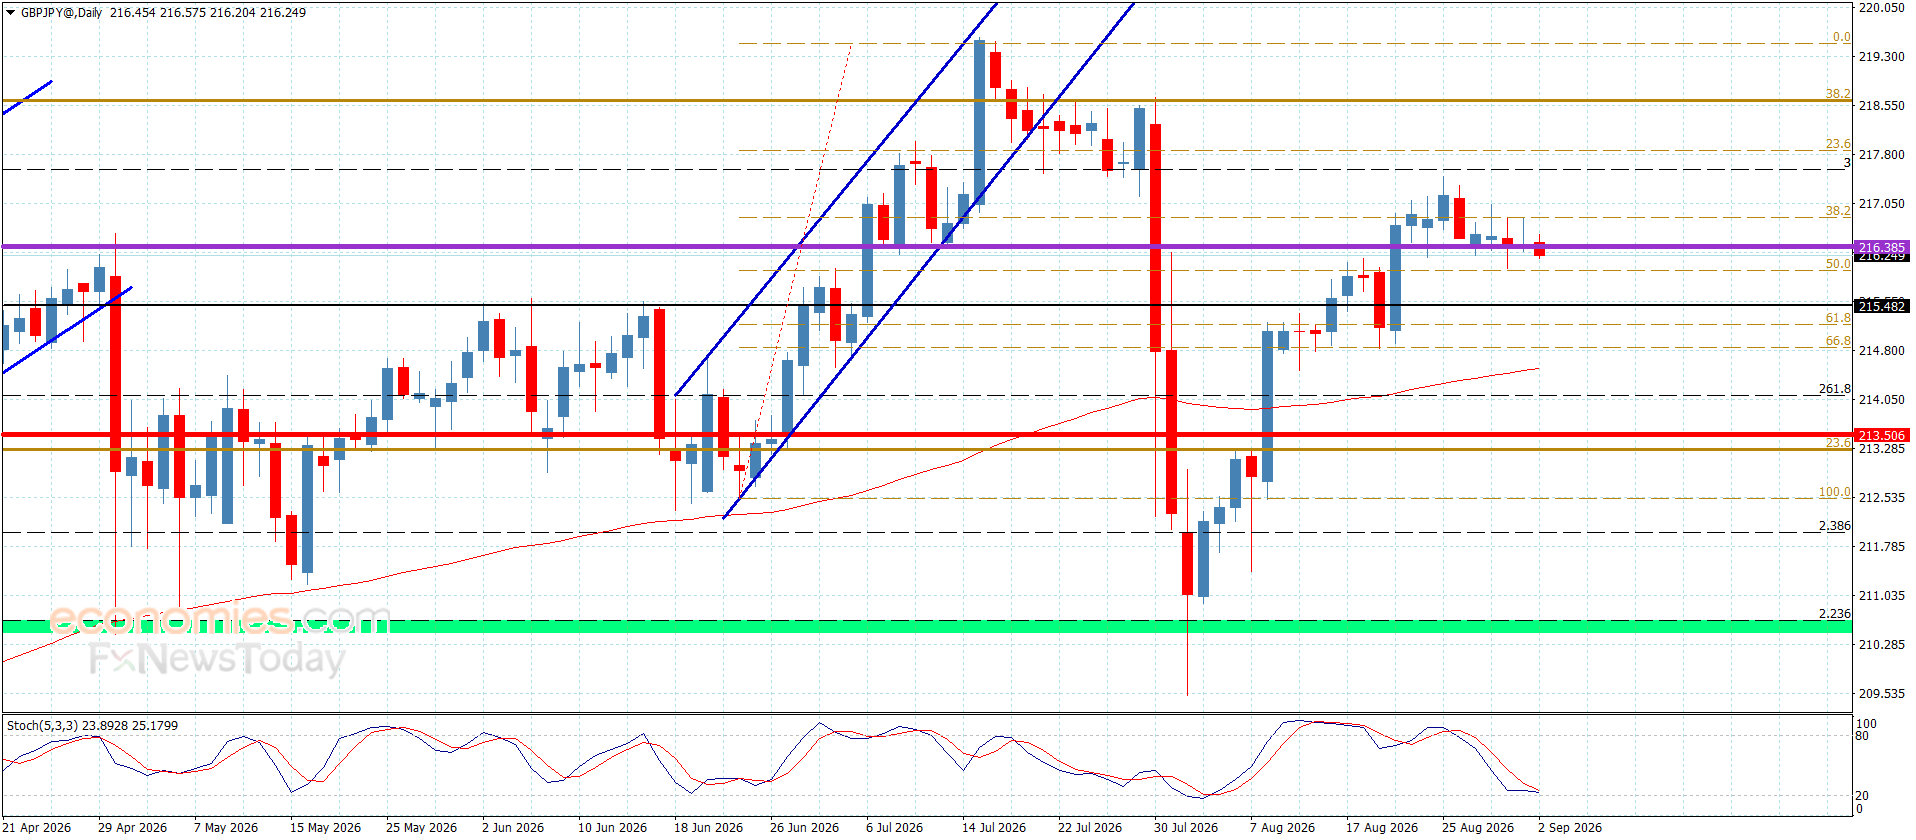
Despite the weakness in the pair’s recent trading, posting further negative closes below the 217.85 barrier supports the continuation of the previously suggested bearish corrective bias. The price has once again slipped below the 216.35 level, signaling its readiness to resume the previously proposed corrective decline.
Moreover, stochastic is providing negative momentum while stabilizing near the 20 level, reinforcing the chances of the price targeting the upcoming corrective levels around 215.55 and 214.95, respectively.
The expected trading range for today is between 214.95 and 216.50
Trend forecast: Bearish
The yen’s latest decline comes despite several developments that would normally support the currency.
Japan and the United States recently coordinated efforts to stabilise the yen, producing a sharp but temporary rally. USD/JPY subsequently moved from near 164 toward approximately 155.
However, the recovery did not last.
By September 1–2, USD/JPY had returned to around 160. There are several reasons.
1. The US-Japan Interest Rate Gap Remains Large
Interest-rate differentials remain one of the biggest structural drivers of USD/JPY.
The US still offers substantially higher interest rates than Japan, encouraging investors to hold US-dollar assets or use the yen as a funding currency.
Even though the BoJ is gradually tightening monetary policy, markets continue to view the normalisation process as relatively slow compared with the level of US rates.
This means that yen carry trades remain attractive, particularly when investors expect the US dollar to remain strong.
2. The BoJ Has Not Yet Delivered the Rate-Hike Cycle Markets Want
The BoJ has raised rates during its normalisation process, but policymakers remain cautious because Japan has a very large government debt burden and economic growth remains relatively fragile.
Japanese 10-year government bond yields recently approached 3%, their highest level in decades, highlighting how quickly financial markets are repricing Japanese monetary policy.
The problem for the yen is that expectations alone may not be enough.
Markets increasingly want evidence that the BoJ is prepared to raise rates more frequently.
Reuters reported in August that the BoJ was considering a September rate hike and potentially a faster pace of tightening thereafter.
The Platinum Group Metals Ltd stock price fell by -4.03% on the last day (Tuesday, 1st Sep 2026) from $1.49 to $1.43. It has now fallen 3 days in a row. During the last trading day the stock fluctuated 3.50% from a day low at $1.43 to a day high of $1.48. The price has fallen in 6 of the last 10 days but is still up by 0.7% over the past 2 weeks. Volume has increased on the last day by 426 thousand shares but on falling prices. This may be an early warning and the risk will be increased slightly over the next couple of days. In total, 1 million shares were bought and sold for approximately $1.51 million.
The stock lies in the middle of a very wide and weak rising trend in the short term and a further rise within the trend is signaled. Given the current short-term trend, the stock is expected to rise 2.99% during the next 3 months and, with a 90% probability hold a price between $1.30 and $1.69 at the end of this 3-month period.
The Platinum Group Metals Ltd stock holds a sell signal from the short-term Moving Average; at the same time, however, there is a buy signal from the long-term average. Since the short-term average is above the long-term average there is a general buy signal in the stock giving a positive forecast for the stock. On further gains, the stock will meet resistance from the short-term Moving Average at approximately $1.53. On a fall, the stock will find some support from the long-term average at approximately $1.42. A break-up through the short-term average will send a buy signal, whereas a breakdown through the long-term average will send a sell signal. Some negative signals were issued as well, and these may have some influence on the near short-term development. A sell signal was issued from a pivot top point on Friday, August 21, 2026, and so far it has fallen -12.80%. Further fall is indicated until a new bottom pivot has been found. Furthermore, there is currently a sell signal from the 3 month Moving Average Convergence Divergence (MACD). Volume rose on falling prices yesterday. This may be an early warning and the stock should be followed more closely.
Platinum Group Metals Ltd finds support from accumulated volume at $1.41 and this level may hold a buying opportunity as an upwards reaction can be expected when the support is being tested.
This stock has average movements during the day and with good trading volume, the risk is considered to be medium. During the last day, the stock moved $0.0500 between high and low, or 3.50%. For the last week, the stock has had daily average volatility of 5.69%.
Our recommended stop-loss:
$1.36
(-5.14%)
(This stock has medium daily movements and this gives medium risk. There is a sell signal from a pivot top found 7 days ago.)
For the upcoming trading day on Wednesday, 2nd we expect Platinum Group Metals Ltd to open at $1.45, and during the day (based on 14 day Average True Range),
to move between $1.39 and $1.47,
which gives a possible trading interval of +/-$0.0880 (+/-6.35%) up or down from last closing price.
If Platinum Group Metals Ltd takes out the full calculated possible swing range there will be an estimated 6.35% move between the lowest and the highest trading price during the day.
Since the stock is closer to the support from accumulated volume at $1.41 (1.40%)
than the resistance at $1.49 (4.20%),
our systems sees the trading risk/reward intra-day as attractive and believe profit can be made before the stock reaches first resistance..
Platinum Group Metals Ltd holds several negative signals and this should be a sell candidate, but due to the general chance for a turnaround situation it should be considered as a hold candidate (hold or accumulate) in this position whilst awaiting further development.
Current score:
0.633
Hold/Accumulate
Unchanged
Want to trade but not sure how?
Our step-by-step guide can help.
Skip the guide? Open account with our trusted broker* 
*Your capital is at risk
EUR/USD Forecast: US Dollar Strength Pressures Pair, Key Support in Focus
The euro is facing renewed downside pressure against the US dollar as of mid-April 2025, with the EUR/USD pair trading near 1.1300, its lowest level in several weeks, driven by a broadly stronger greenback and shifting interest rate expectations.
The US dollar index has climbed for three consecutive sessions, supported by resilient US economic data and hawkish remarks from Federal Reserve officials. Market participants have trimmed bets on aggressive Fed rate cuts this year, with futures now pricing in a 60% chance of a hold in June, according to CME FedWatch. This contrasts with the European Central Bank, which is widely expected to cut its deposit rate by 25 basis points at its June meeting, widening the rate differential in favor of the dollar.
On the daily chart, EUR/USD is testing a critical support zone between 1.1280 and 1.1300, which has held since late March. A break below this level could open the door to further losses toward 1.1200, while resistance is seen at 1.1350 and then 1.1400. The 14-day relative strength index is hovering near 45, indicating bearish momentum but not yet oversold conditions.
For forex traders, the pair’s direction hinges on upcoming US inflation data and ECB policy signals. A stronger dollar raises import costs for emerging markets and can weigh on global risk sentiment. Meanwhile, European exporters may benefit from a weaker euro, potentially cushioning the region’s economic growth. The current trend underscores the importance of monitoring central bank communications and economic releases for short-term trading decisions.
In summary, EUR/USD remains under pressure as the US dollar gains on Fed policy expectations, while the ECB leans toward easing. The key support at 1.1280 will be pivotal in determining the pair’s next move. Traders should watch for breaks below this level or a reversal above 1.1350 for clearer directional signals.
Q1: What is the current EUR/USD exchange rate?
As of mid-April 2025, EUR/USD is trading near 1.1300, having declined from around 1.1450 earlier in the month.
Q2: Why is the US dollar strengthening against the euro?
The dollar is supported by robust US economic data and reduced expectations of near-term Fed rate cuts, while the ECB is expected to ease policy, widening the interest rate differential.
Q3: What are the key technical levels for EUR/USD?
Support is at 1.1280-1.1300, with a break potentially leading to 1.1200. Resistance is at 1.1350 and 1.1400.
This post EUR/USD Forecast: US Dollar Strength Pressures Pair, Key Support in Focus first appeared on BitcoinWorld.
Silver Price Forecast: XAG/USD Holds Above Key $65.50 Support as Traders Await Direction
Silver (XAG/USD) is trading in a narrow range above the critical support level of $65.50 per ounce as of March 26, 2026, with market participants looking for fresh catalysts to determine the next directional move. The precious metal has been consolidating over the past week, caught between support at $65.50 and resistance near $67.00, as investors weigh shifting Federal Reserve rate expectations against ongoing industrial demand from the green energy sector.
Silver prices are being supported by a combination of macroeconomic and industrial factors. On the macro side, the Federal Reserve’s latest projections, released at the March meeting, indicate a slower pace of rate cuts than previously expected, which has kept the US dollar firm and limited upside for precious metals. However, silver’s dual role as both a monetary metal and an industrial input has provided a floor under prices, as global solar panel production continues to expand at a record pace, boosting demand for the metal.
Additionally, exchange-traded fund (ETF) holdings in silver have seen steady inflows over the past month, suggesting that institutional investors are viewing current levels as an attractive entry point. The latest CFTC data shows that net long positioning by managed money has increased by 4.2% from the previous week, reflecting a cautiously optimistic sentiment among speculative traders.
From a technical perspective, the $65.50 level is a confluence of multiple support factors, including the 50-day exponential moving average (EMA) and a trendline extending from the October 2025 low. A decisive break below this zone could open the door to the next support at $63.80, which is the 38.2% Fibonacci retracement of the rally from the October low to the February high. On the upside, the immediate resistance is at $67.00, followed by the psychological $70.00 mark, which has not been tested since early February.
Momentum indicators are currently neutral, with the relative strength index (RSI) hovering near 50 and the MACD showing a flat histogram. This suggests that the market is in a wait-and-see mode, and a breakout in either direction is likely to set the tone for the next leg of the trend. Volume has been relatively subdued, indicating that traders are reluctant to commit before clearer signals emerge.
The $65.50 support level is significant not only from a technical standpoint but also because it aligns with a key psychological round number that many algorithmic trading systems use as a reference point. A sustained move below this level could trigger stop-loss orders, leading to a sharp selloff, while a strong bounce would reinforce the bullish narrative. For short-term traders, this level provides a clear risk-management reference, making it a focal point for intraday strategies.
Looking ahead, the near-term direction for silver will likely be dictated by upcoming US economic data, particularly the core PCE price index due later this week and the nonfarm payrolls report scheduled for early April. Stronger-than-expected inflation or employment data could reinforce the Fed’s hawkish stance, pressuring silver prices, while any signs of economic weakness might revive expectations for rate cuts and boost the metal’s appeal as a hedge.
For longer-term investors, the structural demand story remains intact. The International Energy Agency (IEA) projects that global solar capacity will grow by 20% in 2026, which would require approximately 8,000 tonnes of silver, representing a significant portion of annual mine production. This industrial demand, combined with tight above-ground inventories, suggests that any significant pullback could be viewed as a buying opportunity by those with a multi-year horizon.
Silver is at a pivotal juncture, holding above key support at $65.50 as traders await fresh catalysts. The outcome of upcoming economic data and the Fed’s policy path will likely determine whether the metal breaks higher toward $67.00 or lower toward $63.80. For now, the market remains balanced, with technical levels providing clear guideposts for traders and fundamental drivers supporting a constructive long-term outlook.
Q1: What is the current silver price and why is $65.50 important?
As of March 26, 2026, silver (XAG/USD) is trading just above $65.50 per ounce. This level is significant because it aligns with the 50-day EMA and a trendline from the October 2025 low, making it a key support zone that traders are watching closely.
Q2: What are the main factors influencing silver prices right now?
Silver is being influenced by Federal Reserve monetary policy expectations, US dollar strength, and robust industrial demand, particularly from the solar energy sector. ETF inflows and speculative positioning also play a role in short-term price movements.
Q3: What are the next key resistance and support levels for silver?
The immediate resistance is at $67.00, followed by the psychological $70.00 level. On the downside, if $65.50 breaks, the next support is at $63.80, which corresponds to the 38.2% Fibonacci retracement of the recent rally.
This post Silver Price Forecast: XAG/USD Holds Above Key $65.50 Support as Traders Await Direction first appeared on BitcoinWorld.
The US Dollar to Japanese Yen (USD/JPY) exchange rate traded around 160.03 on Tuesday, with the Yen once again struggling to capitalise on mounting expectations for tighter Bank of Japan policy.
USD/JPY gained 1.38% during August and has recovered roughly half the fall triggered by the joint US-Japan intervention at the end of July.
Rabobank nevertheless sees room for USD/JPY to move lower.
“In our view, fear of further FX intervention in support of the JPY coupled with the prospect of a BoJ September rate hike suggests scope for USD/JPY to trade in the 158-157 area on a 3-to-6-month view.”
The call now has an unusual extra ingredient: Washington is openly pushing Tokyo towards tighter monetary policy.
US Treasury Secretary Scott Bessent said at the weekend that he expected BoJ Governor Kazuo Ueda to “do the right thing” before going further on Monday.
“I have information that the market doesn’t have, and it’s my belief that the Japanese government and the BOJ will do the things that will lead to a stronger yen,” Bessent told CNBC.
Not exactly subtle.
Rabobank notes that this is hardly Bessent’s first intervention in the BoJ debate.
“US Treasury Secretary Bessent has made his views on Bank of Japan policy clear before. In August 2025 he aired the opinion that the BoJ is ‘behind the curve’ on inflation.”
The latest comments followed meetings with Ueda and Japanese Finance Minister Satsuki Katayama, and Reuters reports that a September hike is now close to fully priced.
The Bank of Japan’s next policy meeting is scheduled for 17-18 September.
Rabobank thinks Japan already has enough domestic justification to act without encouragement from Washington.
“Last week’s release of August Tokyo core, core CPI inflation at 2.0% y/y was the third straight month of acceleration.”
“The presence of tight labour market conditions and a resilient economy combined with elevated oil prices and a weak JPY all increase the risk of second order price effects in Japan, suggesting there are good reasons for the BoJ to raise rates again.”
That is the straightforward part of the story.
The more interesting question is why the US Treasury Secretary is leaning so publicly on another major central bank.
Rabobank puts it this way:
“The market is likely to start with the questions of why the Treasury Secretary has broken international precedent by pressuring another country’s central bank and what are the benefits to him for a tighter monetary policy in Japan?”
The answer may sit in the bond market as much as the currency market.
Japan remains the largest foreign holder of US Treasuries, and higher Japanese yields create a growing incentive for domestic investors to bring capital home.
There is a plumbing issue here as well, and it matters.
Rabobank notes that the July joint intervention agreement indicated Japan would avoid selling US Treasury securities during further Yen operations and instead raise Dollars through a Federal Reserve repo facility.
“It is not known if this was a condition of US participation, though it caught the market’s attention.”
“Japan is the largest foreign holder of US treasuries, and the inference was that the US Treasury was keen to avoid selling pressure on US debt.”
Weeks later, Bessent announced that the Treasury would at least double some long-duration bond buybacks, reviving arguments that Washington was trying to dampen long-term borrowing costs.
Japanese yields are moving in the opposite direction.
The 10-year JGB yield reached 3% on Tuesday for the first time since 1996, while the two-year yield hit its highest level in 31 years as investors priced stronger inflation and quicker BoJ tightening.
This is where the cross-market argument gets rather more interesting.
If Japanese bonds become sufficiently attractive, insurers and pension funds have less reason to own foreign debt, including Treasuries.
Rabobank points to Finance Minister Katayama’s suggestion that Japan could alter the GPIF pension fund’s allocation “to make substantially greater investments in Japanese financial assets”.
“Either way, it likely caught the attention of the US Treasury.”
“It can be assumed that Bessent would favour that the Japanese authorities found a way to support the JPY, which did not involve the risk of further pressure on US treasuries.”
That interpretation fits the unusual pattern of recent US policy: Washington helped Japan buy Yen, Treasury buybacks were increased soon afterwards, and Bessent is now openly encouraging higher Japanese policy rates.
As we noted in our recent USD/JPY weekly forecast, intervention broke the earlier momentum but did not fix the interest-rate gap.
Now the focus has moved decisively to the BoJ.
Rabobank sees two persistent drags on the Yen.
“In our view, there are two main factors that have been weighing on the JPY since the tail end of last year.”
The first is the widening divergence between USD/JPY and two-year yield spreads following Sanae Takaichi’s rise to the LDP leadership.
The second is the perception that fiscal policy and political preferences have constrained the BoJ.
“The PM’s reputation as a fiscal dove combined with her previously spoken preference for low interest rates has undermined the JPY and sparked speculation that the government has been leaning on the BoJ not to raise rates.”
“For sure, the BoJ has been slow to raise rates and for the JPY to stabilise, the BoJ will almost certainty have to hasten the pace of policy tightening.”
Reuters reported Tuesday that USD/JPY was still around 160.08 despite the increasingly hawkish September narrative, with traders focused on the continuing US-Japan yield gap.
That stubbornness says quite a lot.
Even a 25-basis-point hike may only buy Tokyo time unless Ueda signals that additional tightening will follow.
“The absence of a hawkish stance from the BoJ at the September 18 policy meeting would almost certainly weigh heavily on the JPY.”
“Even with a rate hike this month, the JPY is unlikely to be out of the woods.”
Fiscal policy remains the other loose end, with markets increasingly sensitive to JGB supply and the 2027 budget discussions.
We made the same distinction in our earlier Yen analysis: getting the rate to 1.25% is one thing; convincing markets that Japan has entered a durable tightening cycle is another.
At 160, the pair is basically daring the BoJ to prove it.
Rabobank thinks the combination of intervention risk and September tightening can eventually pull USD/JPY back into 157-158.
The next move, though, probably depends less on whether the BoJ hikes than on whether Ueda can convince investors there is another hike behind it.
Domestic coffee prices today
Coffee prices today in the domestic market have not changed compared to the previous session. According to giacaphe. com, coffee prices on September 1st averaged 95,600 VND/kg.
In Dak Lak, coffee prices were recorded at 95,500 VND/kg, down 1,000 VND/kg after a week.
In Lam Dong, coffee prices are still 95,000 VND/kg. This is the lowest level among the surveyed areas.
In Gia Lai, coffee prices are at 95,500 VND/kg, down 1,000 VND/kg compared to the same time last week.
The old Dak Nong area recorded a level of 95,700 VND/kg. This is the highest level in today’s price list.
After 1 week, the price level is still significantly lower than the area of 97,000-97,700 VND/kg recorded last week.
The USD/VND exchange rate according to Vietcombank is recorded at 25,850 VND/USD.
World coffee prices
In the world market, coffee prices fluctuate in opposite directions.
According to Barchart, the December 2026 Arabica futures contract closed down 1.35 US cents/lb, equivalent to 0.43%, to 311.50 cents/lb. Meanwhile, the September 2026 Robusta futures contract stood still, anchored at the $3,492/ton mark.
Coffee price assessment
According to AFP, Vietnam’s Central Highlands produces about 1/6 of the world’s coffee production, but many farmers are switching from this traditional crop to durian to take advantage of the increasing demand in China for the fruit dubbed the “king of fruits”.
Favored by nature with a tropical climate and fertile basalt soil, the Central Highlands produces a large amount of Robusta coffee. Vietnam is currently only behind Brazil in coffee production.
However, according to the Ministry of Agriculture and Rural Development, the area of durian cultivation in Vietnam has increased more than 5 times, to 200,000 hectares in the past decade.
Vietnam officially accessed the Chinese durian market after signing a trade protocol in 2022. By last year, Vietnam had become the largest durian supplier to China in terms of output, ending nearly 20 years of Thailand dominating this market.
Vietnam’s durian exports are forecast to reach 4 billion USD this year, a sharp increase compared to 180 million USD in 2021. Of which, 90% of the output is exported to the northern neighboring country.
However, in the Central Highlands, increasing concerns are emerging about dependence on the Chinese market, as well as the risk of oversupply as more and more farmers are running after durian trees.
Many people are worried about the recent plunge in durian prices in Malaysia, believed to be due to an unusual bumper crop in this country.
Farmers still maintain coffee area on land leased from coffee companies, thereby contributing to dispersing risks.
.jpeg "GBP/JPY Forecast 02/09: Pound Consolidates Above 50-Day EMA")