The main category of Forex News.
You can use the search box below to find what you need.
[wd_asp id=1]
The main category of Forex News.
You can use the search box below to find what you need.
[wd_asp id=1]
Gold (XAU/USD) is trading at unprecedented levels, with spot prices holding near $3,586 per ounce and futures climbing above $3,650, as a combination of weak U.S. data, dovish Federal Reserve expectations, and sustained central bank demand intensify the momentum. The rally has already delivered a 36% gain year-to-date, and in just the first week of September, gold added another 4%, setting the stage for a potential test of $4,000 before year-end.
The August Nonfarm Payrolls data shocked markets with only 22,000 jobs added versus expectations of 75,000, alongside a rise in unemployment to 4.3%, the highest since 2021. Jobless claims also ticked up to 237,000. This softening in the labor market sent Treasury yields tumbling and the U.S. Dollar Index down to 97.70, pushing gold sharply higher as investors positioned for a 25-basis point rate cut on September 17, with rising speculation of a 50-basis point move. The CME FedWatch tool now prices a 99.4% probability of easing at the next FOMC meeting.
The chart structure reinforces bullish conviction. On the daily timeframe, gold rebounded strongly from the 100-week SMA, while the 20-month SMA underpins long-term support. Spot gold has repeatedly defended the $3,500 level, transforming it into a new base of support. Futures prices confirm the bullish outlook, closing at $3,653.30 per ounce, just off record highs. Analysts now see a clear path toward $3,800 in Q4, with the $4,000 threshold possible if dovish central bank policy aligns with strong seasonal demand.
While futures and ETFs are driving speculative flows, physical demand in Asia shows hesitation. Buyers in India and China have pulled back above $3,550, signaling some sticker shock at these record levels. Yet, global ETFs saw $5.5 billion in inflows in August, reinforcing institutional appetite. Central banks remain active, with purchases exceeding 1,000 tons in 2024 and another large wave expected this year. China’s upcoming reserve update could further validate the official-sector accumulation trend.
In India, 24-carat gold has surged to ₹108,490 per 10 grams, while 22-carat trades near ₹99,450 per 10 grams. On the MCX, October futures settled at ₹107,740 per 10 grams, marking another record close. Festive season demand from Navratri to Diwali is expected to amplify local consumption and keep premiums high. In the UAE, 22K gold stands at Dh400 per gram, the highest in history, with spot prices at $3,586 per ounce, underscoring the squeeze on consumers but also reaffirming gold’s role as a long-term store of value.
The next drivers will be U.S. inflation reports. The PPI and CPI prints could either confirm disinflation trends or reignite fears of sticky price pressures. Core CPI, particularly shelter and services, remains crucial for Fed policy. Meanwhile, the European Central Bank faces its own dilemma of slowing growth against persistent inflation. Any dovish tilt could reinforce global liquidity conditions favorable for gold. The University of Michigan sentiment and inflation expectations survey will also be closely monitored for shifts in household outlook, potentially adding volatility.
Despite the bullish backdrop, analysts caution about potential near-term profit-taking. On the Comex, December gold hit $3,655.50 per ounce before easing slightly, reflecting resistance at new peaks. Technical indicators place gold in an overbought zone, raising the probability of corrective pullbacks toward $3,500–$3,520. However, market consensus suggests that dips will be used as buying opportunities given geopolitical tensions, Fed easing bets, and festive demand.
Gold’s rally is underpinned not only by central bank policy but also by global geopolitical risks. Trade frictions between the U.S. and major economies, ongoing conflicts, and political instability are reinforcing safe-haven flows. Seasonal drivers, particularly strong Indian demand in Q4, add another layer of support. With ETFs, central banks, and retail buyers aligned, the yellow metal is positioned for sustained strength into the final months of 2025.
– Written by
David Woodsmith
STORY LINK Pound to Dollar Forecast: Scope for GBP to Retest Resistance Near 1.36
The Pound to Dollar exchange rate (GBP/USD) climbed back above 1.35 on Friday after another weak US payrolls report reinforced expectations of imminent Federal Reserve rate cuts.
With non-farm payrolls rising just 22,000 in August and unemployment ticking up to 4.3%, markets are betting heavily on September easing.
Currency analysts see scope for GBP/USD to retest resistance near 1.36, though UK fiscal uncertainty and political risks remain a drag on Sterling’s longer-term outlook.
The Pound to Dollar (GBP/USD) exchange rate edged higher ahead of Friday’s New York open and spiked higher to 1.3530 following the US jobs data.
The dollar was undermined by another weaker-than-expected US jobs data, as markets continue to anticipate significant Federal Reserve rate cuts, while US yields moved lower.
According to Scotiabank; “Regaining the recent peaks around 1.3545/50 would confer a little more strength on the technical outlook and put the pound on track to test major resistance at 1.3595/00.”
Get better rates and lower fees on your next international money transfer.
Compare TorFX with top UK banks in seconds and see how much you could save.
US non-farm payrolls increased 22,000 for August compared with consensus forecasts of around 75,000. There was a small upward revision to the July figure to 79,000 from the flash reading of 73,000, but there was another downward revision for June with the BLS reporting a 13,000 decline, the first negative reading since the beginning of 2021.
Manufacturing and government jobs both recorded declines on the month.
The labour-market survey recorded an increase in the unemployment rate to 4.3% from 4.2%, equalling the highest reading since late 2021. There was, however, a significant increase in the number of people employed with an increase in the labour force.
According to Scotiabank; “There is little doubt that the US jobs market is loosening as labour demand softens.”
It added; “How quickly this dynamic develops remains to be seen but Fed policymakers appear to be increasingly conscious of the emerging labour market slack as they mull the rate outlook.”
Markets are extremely confident that rates will be cut in September and are pricing in over a 65% chance that there will be three cuts by the end of 2025.
MUFG was wary over forecasting heavy dollar losses; “Based on the resilience of the dollar this week given global factors are helping curtail non-dollar buying, an NFP print closer to zero or negative will likely be needed in order to trigger a notable drop for the dollar.”

UK retail sales data had little impact while there were slight Pound losses after the resignation of Deputy Prime Minister Raynor.
There are reports that Prime Minister Starmer will engage in a wider cabinet reshuffle with traders waiting to see whether there are any changes in the Treasury, especially given market sensitivity to fiscal policy.
Capital Economics deputy chief UK economist Ruth Gregory noted that many of the conditions which have led to fiscal crises in the past are now in place in the UK, but that a fiscal crisis in the UK is neither imminent nor inevitable.
According to Gregory; “The missing ingredient is a trigger. If a UK fiscal crisis does erupt, it’s as likely to come from a change in perceptions or personnel as economic data or policy.”
She added; “This underlines the need for the government to continue to commit to fiscal discipline to keep the bond market onside.”
International Money Transfer? Ask our resident FX expert a money transfer question or try John’s new, free, no-obligation personal service! ,where he helps every step of the way,
ensuring you get the best exchange rates on your currency requirements.
TAGS: Pound Dollar Forecasts
The pound has bounced back against the dollar, trading at 1.3506 after reclaiming the 50-day SMA (1.3446) and 200-day SMA (1.3464). The chart is in an uptrend, with higher lows and higher highs. But the latest candle has a long upper wick at 1.3550, which suggests sellers are stepping in at higher levels.
Momentum is starting to crack. RSI is at 64.9 and getting close to overbought, and if price goes higher while RSI flattens, a bearish divergence could form and we could see a pullback. Candlestick signals are also cautionary, with the upper wick looking like a shooting star, a common reversal pattern.
This week is packed with US data that will set the tone for GBP/USD:
If inflation cools, the Fed could ease and GBP/USD could rally. If US data is strong, the dollar could gain and pressure the pound.
GBP/USD is at a crossroads. A daily close above 1.3520 would confirm the bounce, 1.3550 and 1.3588 next. Failure to hold gains could see 1.3478 and then 1.3417.
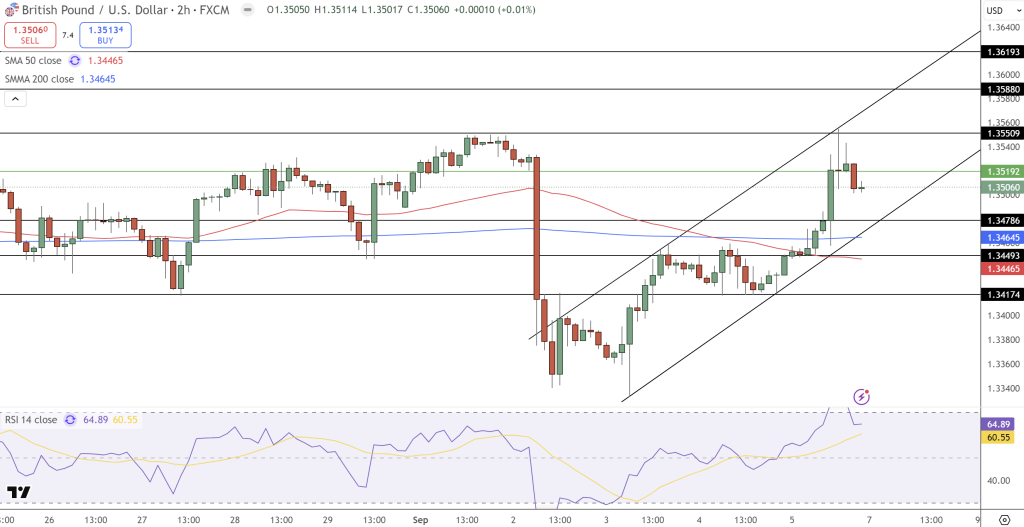
The market is on a knife edge. This week’s US inflation data will be the trigger.

Arslan Butt
Lead Markets Analyst – Multi-Asset (FX, Commodities, Crypto)
Arslan Butt serves as the Lead Commodities and Indices Analyst, bringing a wealth of expertise to the field. With an MBA in Behavioral Finance and active progress towards a Ph.D., Arslan possesses a deep understanding of market dynamics.
His professional journey includes a significant role as a senior analyst at a leading brokerage firm, complementing his extensive experience as a market analyst and day trader. Adept in educating others, Arslan has a commendable track record as an instructor and public speaker.
His incisive analyses, particularly within the realms of cryptocurrency and forex markets, are showcased across esteemed financial publications such as ForexCrunch, InsideBitcoins, and EconomyWatch, solidifying his reputation in the financial community.
The (ETHUSD) price declined in its last intraday levels, amid the dominance of the bearish corrective trend on the short-term basis and its trading alongside supportive bias line for this track, accompanied by the continuation of the negative pressure that comes from its trading below EMA50, intensifying the negative pressure on the price, to approach from the key support at $4,250, preparing to break it. On the other hand, we notice the emergence of positive signals on the (RSI), after reaching oversold levels, which might reduce the upcoming losses.
Get high-accuracy trading signals delivered directly to your Telegram. Subscribe to specialized packages tailored for the world’s top markets:
Full VIP signals performance report for August 25–29, 2025:
The EUR/USD pair advanced sharply, hitting 1.1714 during Friday’s New York session after the U.S. nonfarm payrolls report revealed only 22,000 jobs created versus expectations of 75,000. The unemployment rate ticked higher to 4.3%, while wage growth stayed steady at 0.3% month-on-month. That combination triggered an aggressive sell-off in the dollar, with the U.S. Dollar Index (DXY) sliding 0.70% to 97.57 and U.S. 2-year yields collapsing to 3.50%, the lowest in five months. Traders have now priced a 100% probability of a 25-basis-point rate cut at the September 17 FOMC meeting and a 14% chance of a 50-basis-point cut, dramatically shifting sentiment in favor of the euro.
Even with dollar weakness driving momentum, the euro is facing its own headwinds from French political uncertainty. Elections looming in France have stirred volatility, with investors fearing policy paralysis or market disruptions depending on the outcome. Despite this, the euro gained ground after the Eurozone’s Q2 GDP revision showed annualized growth at 1.5%, slightly above expectations, while Germany’s DIW institute projected a modest 0.2% GDP improvement in 2025. Those data points suggest the European economy, while fragile, may be stabilizing, providing some support to the common currency.
The DXY’s fall below its critical 97.70 support level marks a decisive technical break. That level had held since mid-August, and the failure opens a path toward the 96.70–96.80 zone. Such weakness in the dollar index is typically correlated with stronger EUR/USD flows. Friday’s nonfarm payrolls miss also tagged the unfinished July auction at 97.43, adding technical confirmation that bearish momentum in the dollar is broadening. Unless the DXY reclaims 98.00 in the coming sessions, EUR/USD has a clean runway toward retesting 1.1790–1.1829.
On the charts, EUR/USD has broken decisively above its 22-day simple moving average, with the Relative Strength Index holding above 50, reinforcing bullish momentum. The pair printed a morning star formation around 1.1400 in early August before reclaiming upside traction. Now, the key test lies at the 1.1759–1.1800 zone, with a clean break exposing the year-to-date high at 1.1829. A failure at resistance could see a pullback toward 1.1650 and deeper to 1.1600, with major support at the 100-day SMA around 1.1526. For now, momentum favors continuation higher as long as EUR/USD remains above 1.1700 on a closing basis.
Beyond the immediate labor data shock, broader macro dynamics are supporting EUR/USD. Softer U.S. inflation data last month fueled disinflation expectations, reducing the perceived impact of Trump’s tariffs on price growth. Traders now await fresh CPI and PPI reports next week, where another weak print will cement the case for multiple Fed cuts before year-end. Futures tied to December 2025 fed funds contracts already price in nearly 65 basis points of easing. Meanwhile, the ECB is widely expected to hold rates steady, with market probabilities showing a 91% chance of no move, leaving the policy divergence tilted against the dollar.
From a structural standpoint, EUR/USD’s rally from the 2022 low at 0.9534 remains intact, with the pair now eyeing the 1.1916 projection zone. Technical analysts highlight that the multi-decade downtrend could already be reversing, with the next major retracement level sitting at 1.2019. Sustained strength above 1.1829 would confirm the bullish case and open the way toward 1.20, with 1.3554 flagged as a long-term extension target if momentum persists. As long as support at 1.1604 holds, the risk bias remains to the upside.
Technically, gold has broken its consolidation band between $3,500 and $3,560, with $3,600 now the key pivot. Sustained closes above $3,600 open the path to Fibonacci extensions at $3,680 and $3,755. On the downside, support lies at $3,520 and $3,455, with $3,400 serving as the line in the sand for bulls. Momentum indicators remain bullish, with RSI holding above 70 but not yet flashing overbought extremes. Traders are watching inflation data next week to test the durability of this breakout.
The weak labor market data comes on top of a deteriorating global growth outlook. Eurozone PMIs are soft, China’s property market slump persists, and U.S. GDP growth projections are being revised lower. These factors, alongside a weaker dollar — with DXY falling 0.48% to 97.76 this week — reinforce demand for gold. Stagflation fears are re-emerging, with Monex USA calling the setup “very serious stagflation,” a textbook environment where XAU/USD outperforms risk assets.
The USD/JPY weekly forecast indicates further weakness in the US labor market, which supports a more dovish Fed.
USD/JPY ended the week bullish but closed well below its highs as the dollar dropped. At the start of the week, the dollar recovered briefly against the yen as traders awaited crucial US employment figures. However, as the data came in, it became clear that the labor market had softened more than expected.
–Are you interested to learn more about MT5 brokers? Check our detailed guide-
Nonfarm payrolls revealed that the US economy added only 22,000 jobs in August, compared to the forecast of 75,000. Meanwhile, the unemployment rate rose to 4.3% as expected. The poor figures increased expectations for Fed rate cuts, weighing on the dollar.
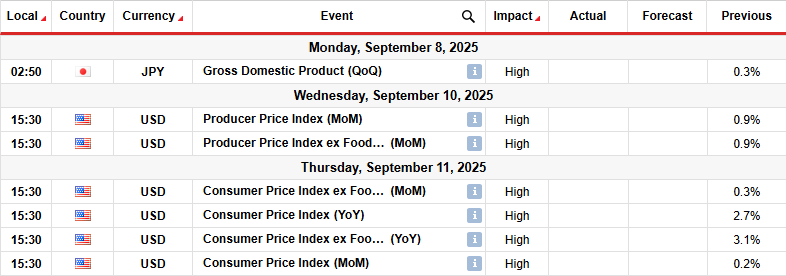
Next week, the US will release its consumer and wholesale inflation reports, which will shape the outlook for Fed rate cuts. Already, market participants are fully pricing a rate cut in September. However, the outlook for future rate cuts is still changing. Moreover, there is a chance the Fed will opt to deliver a massive rate cut this month.
If consumer inflation comes in below estimates, rate cut expectations will increase, and the dollar will extend its decline. On the other hand, a positive figure could ease rate cut bets.
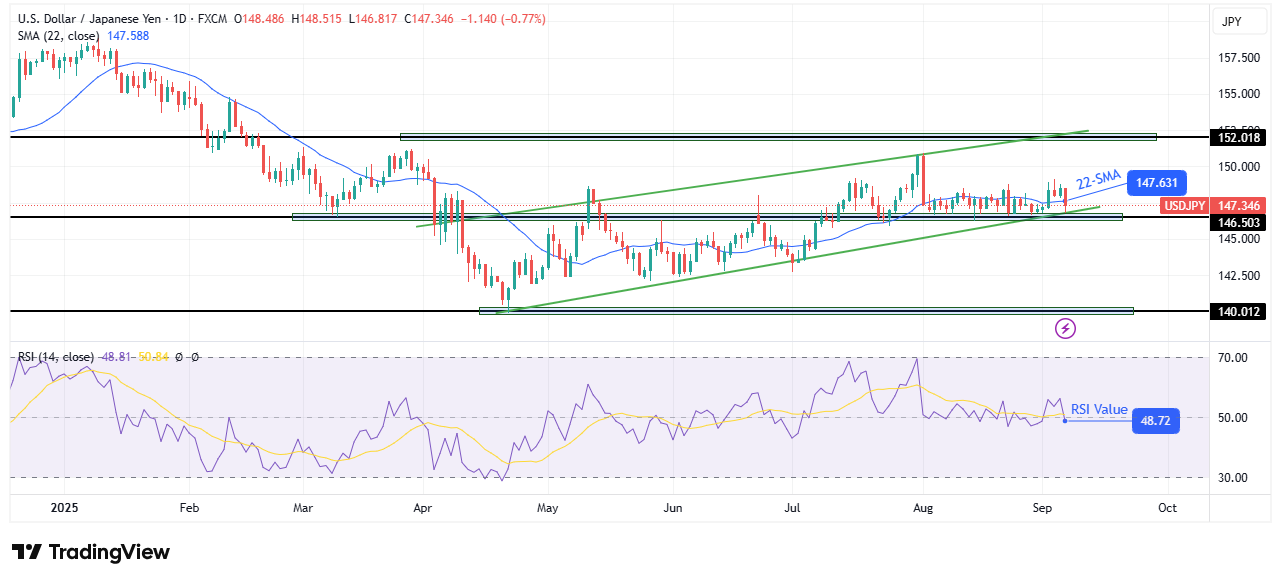
On the technical side, the USD/JPY price trades in a bullish channel with clear support and resistance lines. However, the price is also chopping through the 22-SMA, a sign that bears are showing strength. This also indicates that the move is corrective.
–Are you interested to learn more about Thailand forex brokers? Check our detailed guide-
Previously, the USD/JPY was trading in a well-developed downtrend, mostly staying below the 22-SMA. However, the decline paused when it reached the 140.01 key support level. Here, bulls took charge, making higher highs and lows. However, the new trend was shallow and corrective.
Within the bullish channel, the price has broken below the SMA, and the RSI has dipped below 50. Therefore, bears are currently stronger and could soon challenge the channel support. Given that the price is currently in a corrective move, a breakout would likely lead to an impulsive move. If bears break out of the channel, the price will fall to retest the 140.01 support level.
Looking to trade forex now? Invest at eToro!
68% of retail investor accounts lose money when trading CFDs with this provider. You should consider whether you can afford to take the high risk of losing your money.
Although momentum remains strong, gold is arguably short-term overbought and due for at least a minor pullback. Importantly, this would be the first pullback following the breakout above the symmetrical triangle consolidation last week. The first retracement after a breakout often provides a lower-risk entry relative to the initial breakout, as traders watch for a bullish reversal signal to confirm renewed demand. It also serves as a test to filter out potential false breakouts.
Thursday’s brief pullback was quickly rejected, with gold surging to fresh highs the very next day. That swift recovery underscores strong demand and signals that further gains may come before any deeper retracement develops. Barring a sharp reversal, gold looks set to close the week at its highest weekly close ever, adding to last month’s record monthly finish. Global macro factors—including persistent economic uncertainty and a weakening U.S. dollar—continue to underpin the bullish outlook.
Measured moves highlight the upside potential following the breakout. The symmetrical triangle projects a target near $3,786, while the prior measured advance points even higher to around $3,966. On the way, a notable Fibonacci confluence zone lies between $3,664 and $3,668, which could act as interim resistance.
Should short-term weakness emerge, the first support to monitor is around the prior record high of $3,500. Beneath that, the breakout zone defined by prior swing highs near $3,451 to $3,439 offers additional support. As long as these levels hold, the broader bullish trend remains firmly intact, with higher targets in sight.
For a look at all of today’s economic events, check out our economic calendar.
The US dollar has plunged against the Japanese yen during the trading session like you would expect. But we are sitting right at the 50 day EMA and we’re still very much within the consolidation area that we have been in for quite some time. With that being the case, I think you’ve got a scenario where not much has changed again. And we’ve seen candlesticks like this recently. So, it’s really not until we break down below 146 yen that I think anything has changed here either.
The Australian dollar has rallied quite nicely, but again, it hasn’t really reached escape velocity. We have a much sloppier area to deal with here, with 0.66 offering resistance. If we were to break above there, then we can start to have a conversation about a much bigger move. Short-term pullbacks, I think, continue to be a very real possibility, but if we were to break above the top of the candlestick on Thursday, July 24, I think at that point, you really start to see the Australian dollar take off.
This will be a US dollar centric move. So, you’ll see the dollar fall apart everywhere. And then you’ll see it play out here, which the Australian dollar, for what it’s worth, has been a laggard.
For a look at all of today’s economic events, check out our economic calendar.
The pound is trading in volatile fashion against the dollar as GBP/USD hovers around 1.3515, rising 0.6% on the day after dismal U.S. labor data. Nonfarm payrolls added just 22,000 jobs in August compared with forecasts of 75,000, while unemployment ticked up to 4.3% from 4.2%. The weak jobs print sent U.S. 10-year yields tumbling 2% to below 4.1%, dragging the dollar index to its lowest since July at 97.50. This collapse in dollar momentum allowed sterling to reclaim levels above 1.35 despite deep concerns surrounding the UK’s fiscal position and sticky yields.
While the dollar’s slump has temporarily lifted GBP/USD, investors remain cautious about the UK outlook. Thirty-year gilts recently touched their highest yield since 1998, reflecting market worries about Britain’s debt trajectory ahead of the November budget. Sterling peaked near $1.38 in July, but analysts expect sideways trade below 1.35 in the short term as fiscal risks cap bullish attempts. The market currently sees just an 18% chance of a Bank of England cut in November compared with 67% one month earlier, showing how sharply rate expectations have shifted with yields projected to stay higher than peers for longer.
The weak NFP print has reshaped expectations for the Federal Reserve, with CME FedWatch showing 75% odds of consecutive 25-basis-point cuts in September and October. ADP data had already hinted at labor fragility with just 54,000 private-sector jobs added in August compared with 106,000 in July. Fed speakers have acknowledged risks, with Chicago’s Goolsbee highlighting deterioration in the job market, while New York’s Williams maintained that gradual easing remains an option if inflation allows. The dovish tilt is pulling the dollar lower across the board, but market positioning remains sensitive to every labor release.
On the charts, GBP/USD trades within a bearish channel but currently sits above its 30-period SMA with RSI above 50, signaling bulls are trying to seize momentum. A push through channel resistance could lift the pair toward 1.3575, confirming another impulsive move higher after the recent corrective phase. If momentum stalls, immediate support lies near 1.3416, followed by 1.3376 and 1.3341. Failure to defend those levels would re-expose the August low at 1.3142. On the topside, resistance zones cluster around 1.3489, then 1.3543, with a breakout targeting July’s 1.3789 peak.
The heat map of currency performance shows sterling was strongest against the dollar, gaining 0.66%, while only marginally weaker versus the euro at -0.09%. GBP also outperformed the Canadian dollar by 0.53% and gained 0.92% against the Australian dollar, underscoring how much dollar weakness drove the move. Despite this strength, sentiment remains fragile as traders recognize sterling’s rally is built more on U.S. weakness than UK strength. The UK’s fiscal risk premium means any rebound in dollar yields could quickly unwind recent gains.
Short-term dynamics are dominated by U.S. labor data and Fed policy bets. If the Fed confirms rate cuts in September and October, GBP/USD could extend toward 1.36–1.38, though UK fiscal risks may prevent a sustainable break higher. Conversely, stronger-than-expected U.S. data or hawkish Fed pushback could see the pair retest 1.33 or lower. With MUFG projecting 1.40 for GBP/USD by Q2 2026 on expected dollar weakness, the longer-term trajectory remains bullish, but near-term trading is likely to remain volatile within a broad 1.3140–1.3595 band.