The main category of Forex News.
You can use the search box below to find what you need.
[wd_asp id=1]
The main category of Forex News.
You can use the search box below to find what you need.
[wd_asp id=1]
The US dollar has plunged against the Japanese yen during the trading session like you would expect. But we are sitting right at the 50 day EMA and we’re still very much within the consolidation area that we have been in for quite some time. With that being the case, I think you’ve got a scenario where not much has changed again. And we’ve seen candlesticks like this recently. So, it’s really not until we break down below 146 yen that I think anything has changed here either.
The Australian dollar has rallied quite nicely, but again, it hasn’t really reached escape velocity. We have a much sloppier area to deal with here, with 0.66 offering resistance. If we were to break above there, then we can start to have a conversation about a much bigger move. Short-term pullbacks, I think, continue to be a very real possibility, but if we were to break above the top of the candlestick on Thursday, July 24, I think at that point, you really start to see the Australian dollar take off.
This will be a US dollar centric move. So, you’ll see the dollar fall apart everywhere. And then you’ll see it play out here, which the Australian dollar, for what it’s worth, has been a laggard.
For a look at all of today’s economic events, check out our economic calendar.
The pound is trading in volatile fashion against the dollar as GBP/USD hovers around 1.3515, rising 0.6% on the day after dismal U.S. labor data. Nonfarm payrolls added just 22,000 jobs in August compared with forecasts of 75,000, while unemployment ticked up to 4.3% from 4.2%. The weak jobs print sent U.S. 10-year yields tumbling 2% to below 4.1%, dragging the dollar index to its lowest since July at 97.50. This collapse in dollar momentum allowed sterling to reclaim levels above 1.35 despite deep concerns surrounding the UK’s fiscal position and sticky yields.
While the dollar’s slump has temporarily lifted GBP/USD, investors remain cautious about the UK outlook. Thirty-year gilts recently touched their highest yield since 1998, reflecting market worries about Britain’s debt trajectory ahead of the November budget. Sterling peaked near $1.38 in July, but analysts expect sideways trade below 1.35 in the short term as fiscal risks cap bullish attempts. The market currently sees just an 18% chance of a Bank of England cut in November compared with 67% one month earlier, showing how sharply rate expectations have shifted with yields projected to stay higher than peers for longer.
The weak NFP print has reshaped expectations for the Federal Reserve, with CME FedWatch showing 75% odds of consecutive 25-basis-point cuts in September and October. ADP data had already hinted at labor fragility with just 54,000 private-sector jobs added in August compared with 106,000 in July. Fed speakers have acknowledged risks, with Chicago’s Goolsbee highlighting deterioration in the job market, while New York’s Williams maintained that gradual easing remains an option if inflation allows. The dovish tilt is pulling the dollar lower across the board, but market positioning remains sensitive to every labor release.
On the charts, GBP/USD trades within a bearish channel but currently sits above its 30-period SMA with RSI above 50, signaling bulls are trying to seize momentum. A push through channel resistance could lift the pair toward 1.3575, confirming another impulsive move higher after the recent corrective phase. If momentum stalls, immediate support lies near 1.3416, followed by 1.3376 and 1.3341. Failure to defend those levels would re-expose the August low at 1.3142. On the topside, resistance zones cluster around 1.3489, then 1.3543, with a breakout targeting July’s 1.3789 peak.
The heat map of currency performance shows sterling was strongest against the dollar, gaining 0.66%, while only marginally weaker versus the euro at -0.09%. GBP also outperformed the Canadian dollar by 0.53% and gained 0.92% against the Australian dollar, underscoring how much dollar weakness drove the move. Despite this strength, sentiment remains fragile as traders recognize sterling’s rally is built more on U.S. weakness than UK strength. The UK’s fiscal risk premium means any rebound in dollar yields could quickly unwind recent gains.
Short-term dynamics are dominated by U.S. labor data and Fed policy bets. If the Fed confirms rate cuts in September and October, GBP/USD could extend toward 1.36–1.38, though UK fiscal risks may prevent a sustainable break higher. Conversely, stronger-than-expected U.S. data or hawkish Fed pushback could see the pair retest 1.33 or lower. With MUFG projecting 1.40 for GBP/USD by Q2 2026 on expected dollar weakness, the longer-term trajectory remains bullish, but near-term trading is likely to remain volatile within a broad 1.3140–1.3595 band.
The day’s weakness suggests the likelihood of another test of support near Wednesday’s low at $2.96. That level also aligns with an anchored VWAP line that has acted as a technical floor this week. If sellers push below $2.96, attention will shift to the 20-Day moving average at $2.89, which now represents a secondary support zone. How natural gas reacts in this price band will help determine whether the current pullback deepens or stabilizes.
Despite the pullback, the broader technical picture still shows potential for continuation. Last week’s breakout from a falling wedge pattern established initial upside objectives between $3.14 and $3.19. While neither target has yet been achieved, the breakout remains valid, and the ongoing consolidation may simply reflect a pause before another attempt higher. Importantly, a sustained daily close above the 50-Day average would mark the first bullish reclaim of that level since July, strengthening the case for renewed upside momentum.
If buyers can regain control with a breakout above $3.13, the $3.19 swing high from early August becomes the next hurdle. A decisive move through that level would open the path toward the 200-Day moving average near $3.50. Longer term, natural gas remains within a falling parallel channel, but recent strength above the midpoint line suggests potential to eventually challenge the channel’s upper boundary. For now, natural gas is locked between resistance at $3.13–$3.19 and support at $2.96–$2.89. A break of either range will likely define the next directional move.
For a look at all of today’s economic events, check out our economic calendar.
The USD/JPY pair is pinned between technical barriers and shifting macroeconomic winds as traders brace for the dual impact of U.S. labor market weakness and Japan’s evolving monetary stance. The dollar index has been dragged lower after the latest nonfarm payrolls report showed only 22,000 new jobs in August, well below the forecast of 75,000. Unemployment ticked higher to 4.3%, while Treasury yields slipped, with the 10-year benchmark down 2% on the day to 4.09%, the lowest since July. This soft data has bolstered market conviction that the Federal Reserve will deliver a 25 bp rate cut in September and another in October, with CME FedWatch now showing combined odds above 75%.
On the charts, USD/JPY has struggled to break above its 200-day moving average near 148.79, with repeated rejections keeping resistance locked around the 148.65–149.00 zone. An attempted breakout this week quickly reversed, pulling the pair back to 147.88, which now acts as immediate support. Failure to defend that level exposes the August low near 147.00, and if that breaks, deeper downside toward 146.00 and 145.00 could unfold. On the upside, only a decisive close above 149.20 would re-open the path toward 150.92, the August peak, and then the 151.00 level. Momentum indicators are neutral, with RSI hovering in the mid-50s, reflecting indecision as traders await stronger catalysts.
Japan’s domestic backdrop adds complexity. Wage growth accelerated to 4.1% year-on-year in July, up from 2.5% in June, while household spending rebounded 1.7% month-on-month after a 5.2% slump. Rising wages and improved consumption strengthen the case for the Bank of Japan to consider another rate hike later this year. However, political uncertainty continues to weigh, with resignations in the ruling LDP raising questions about whether leadership changes could pressure the BoJ to slow policy normalization. Despite turbulence, analysts still expect a rate hike by October or year-end, which, if confirmed, would strengthen the yen and pressure USD/JPY lower.
The U.S. economy presents a split picture. The ISM services PMI rose to 52.0 in August, up from 50.1, showing resilience in non-manufacturing activity, while jobless claims and ADP private payrolls disappointed. This divergence has left the dollar’s outlook fragile, but the market is firmly leaning dovish. Fed officials, including New York’s John Williams and Chicago’s Austan Goolsbee, have acknowledged softening labor conditions while stressing inflation risks, leaving the Fed cautious but clearly biased toward easing. Should the Fed cut in back-to-back meetings, USD/JPY could see structural pressure back toward 145.00, aligning with Rabobank’s three-month projection.
Wall Street’s record-setting run has complicated flows into the yen. The S&P 500 closed above 6,500, with optimism around Fed easing fueling risk appetite and weakening the safe-haven yen. However, if U.S. equities retrace or if Treasury yields fall further, USD/JPY may decouple from risk-on sentiment and align more closely with interest rate differentials. Japan’s 30-year government bond yield, at its highest since 1998 earlier this week, underscores the divergence in bond markets that continues to drive volatility in the pair.
At 148.30, USD/JPY is locked in a tug-of-war between bullish dollar bets looking for a rebound to 150 and the bearish narrative of Fed cuts combined with a hawkish BoJ. The decisive catalyst remains the trajectory of U.S. labor data and the BoJ’s willingness to tighten policy despite political noise. With rate markets fully pricing in Fed easing, the downside risk may outweigh upside potential in the near term. Unless bulls can secure a close above 149.20, the bias leans bearish toward 147.00 and potentially 145.00. Medium term, however, volatility will remain elevated, making the pair a tactical trading opportunity rather than a straightforward directional play.
Natural gas (NG=F) prices are trading in a volatile range as seasonal demand collides with record production and shifting storage levels. At Henry Hub, spot prices hover around $3.00 per MMBtu, while European benchmarks like TTF surge above $10.80, creating a 267% spread that highlights the arbitrage opportunity between U.S. exports and European buyers. This differential has widened from June’s 213% spread, reinforcing the structural bullish case for LNG flows despite an oversupplied domestic market.
U.S. inventories remain elevated, with the latest EIA report showing a 55 Bcf injection for the week ending August 29, well above the five-year average of 36 Bcf. Working gas in storage sits 5.6% above the five-year seasonal norm, signaling adequate supply coverage heading into the winter heating season. Despite this, October NYMEX futures trade at $3.064, a 2.1% premium to Henry Hub spot, reflecting market expectations of stronger winter demand. The Midwest, in particular, has flipped from a summer surplus to potential winter tightness, with Chicago Citygate futures spiking above $0.60/MMBtu basis premiums for January and February 2026.
Regional dislocations across U.S. hubs underscore infrastructure bottlenecks. Northwest Sumas traded at $1.38/MMBtu, while SoCal Citygate surged above $4.00, and PG&E Citygate settled at $3.97, a $2.65 spread that highlights West Coast pipeline constraints. In Texas, Waha hub prices hover at $0.06/MMBtu above Henry Hub, while Appalachian hubs like Eastern Gas South remain discounted at -0.055/MMBtu. These disparities create opportunities for traders with access to transport and storage to exploit short-term volatility while positioning for broader structural tightness.
Dry gas production remains robust, with U.S. lower-48 output at 107.1 Bcf/day, up 4.6% year over year. The EIA recently raised its 2025 production forecast to 106.44 Bcf/day, with 2026 production expected at 106.09 Bcf/day. Active gas rigs sit near a two-year high at 122, up from 94 a year ago, underscoring steady investment despite price volatility. Supply growth continues to cap near-term rallies, but it also enables U.S. LNG to meet record global demand, with net flows to export terminals averaging 15 Bcf/day.
LNG remains the structural driver for natural gas. European storage is 78% full, slightly below the five-year average of 85%, keeping the region dependent on U.S. cargoes. Arbitrage remains profitable as long as Henry Hub trades at $3 and TTF holds above $10. The U.S. exported 16.1 Bcf/week on average in early September, with seasonal LNG demand expected to rise further into winter. Basis trades between Henry Hub and European benchmarks continue to dominate speculative flows, with traders betting on sustained premiums into 2026.
A newer dimension is the surge in electricity demand from artificial intelligence. Data centers now consume 6–8% of U.S. electricity, projected to rise to 15% by 2030. With natural gas still providing 40% of U.S. generation, this shift could add 3–4 Bcf/day of incremental demand by 2033. Regional hubs in Virginia and California already show price pressure from data center clusters straining pipeline capacity. Infrastructure investments, including Chevron-GE Vernova’s 4 GW gas power project, aim to respond, but bottlenecks will persist in the near term, creating localized volatility.
Weather forecasts remain critical. Warmer-than-expected September conditions in the Midwest and Northeast are supporting electricity-driven demand, but cooler conditions on the coasts are tempering gains. Technically, NG=F faces resistance at the $3.26 level (200-day EMA), with support at $2.70. Momentum indicators suggest exhaustion at current levels, with RSI easing back into neutral territory. If futures clear $3.26, a run toward $3.60 is possible, matching the EIA’s H2 2025 forecast. A failure to hold $2.75, however, risks a deeper retracement to $2.65.
Natural gas sits at the intersection of oversupply and transformative demand. Elevated storage levels and record production argue for caution in the near term, but LNG arbitrage, winter heating demand, and the structural pull from AI-driven power consumption build a strong medium-term case. With Henry Hub near $3.00 and futures already pricing in a premium, positioning depends on timeframe: short-term traders can exploit basis spreads and weather-driven volatility, while long-term investors eye the fundamental tailwinds that could push prices well above $4 in the coming years.
The EUR/USD pair is locked in a critical range, trading around 1.1670, supported by a rising trendline from late August and holding above the 50-EMA at 1.1659 and the 200-EMA at 1.1656. Despite three consecutive sessions of selling pressure earlier this week, the euro has managed to recover intraday, keeping the bias tilted toward upside while awaiting confirmation from U.S. labor data.
The dollar’s recent strength has been undermined by increasingly fragile labor readings. ADP private payrolls showed just 54,000 jobs in August, sharply lower than July’s revised 106,000 and well below expectations of 65,000. Weekly jobless claims also rose to 237,000, the highest since June. These numbers have solidified market conviction of a September rate cut, with CME FedWatch now pricing a 99.4% chance of a 25-basis-point reduction. The broader U.S. Dollar Index (DXY) is stabilizing near 98.13, but downside risks remain should nonfarm payrolls confirm the slowdown.
While rate cut bets dominate, inflation remains sticky. Core CPI above 3% and Core PCE at 2.9% keep the Fed cautious about how far and how fast it can ease. Fed officials such as John Williams have suggested gradual cuts are possible, while Austan Goolsbee flagged a “live” September meeting due to deteriorating labor conditions. Markets are currently projecting at least three cuts by year-end, but the balance between weakening jobs and still-firm inflation leaves EUR/USD highly sensitive to Fed communications.
The European Central Bank (ECB) provides a contrasting backdrop, with its ECB Watch Tool showing an 83.8% probability of rates staying at 2.00% at the September 10 meeting. Growth has slowed—Q2 GDP is expected at 0.1%, down from 0.6% in Q1—but policymakers have signaled stability rather than fresh easing. This divergence means that if the Fed cuts aggressively while the ECB holds steady, euro-denominated assets could gain relative appeal, lending medium-term support to EUR/USD.
Chart patterns are reinforcing bullish potential. On the daily timeframe, EUR/USD is forming a bull pennant, consolidating gains since August in a symmetrical triangle that often resolves higher. On shorter-term charts, an inverse head-and-shoulders has developed, pointing to a potential breakout if resistance levels are cleared. Immediate resistance sits at 1.1682, followed by 1.1708 and 1.1735. A decisive move above these thresholds could open the door for a run toward 1.2000, where structural supply sits. Support is anchored at 1.1614 and deeper at 1.1578, the 23.6% Fibonacci retracement.
The nonfarm payrolls release is the pivotal driver in the immediate term. Consensus is for 75,000 jobs and unemployment at 4.3%, but revisions and wage growth will matter as well. Average Hourly Earnings are projected at 3.7% YoY, down from 3.9%, with monthly growth at 0.3%. A weaker-than-expected print would likely accelerate dollar losses and push EUR/USD through resistance, while a surprise beat could stall momentum and re-anchor the pair closer to 1.1610–1.1630 support.
Global risk appetite has also been leaning toward the euro. German and French 30-year yields have retreated from recent highs, calming fears of European bond instability, while easing U.S. yields continue to undermine the dollar’s edge. Traders have noted the euro’s outperformance in the currency heatmap, where it has gained broadly across majors. Comparisons with other pairs—such as GBP/USD consolidating at 1.3454 and USD/JPY testing resistance near 149.23—show EUR/USD in a stronger technical setup, particularly as the euro represents 57.6% of the DXY basket.
With EUR/USD consolidating near 1.1670 and holding its bullish chart formations, the balance of risk favors an upside breakout if U.S. labor data confirms weakness. A sustained move through 1.1720–1.1735 would invite momentum traders, with potential extensions toward 1.1850 and eventually 1.2000. However, if NFP surprises and the Fed remains more cautious than expected, EUR/USD could retreat back into the 1.1575–1.1610 zone. The pair’s trajectory into September hinges on this policy divergence: a Fed ready to cut against an ECB holding steady creates conditions for euro appreciation, but only if economic data aligns.
The gold price (XAU/USD) has exploded to fresh records, touching $3,597.80 per ounce in spot trading and briefly surpassing its previous peak of $3,578.66 earlier this week. Futures contracts advanced above $3,650 for the first time, signaling that bullish momentum is far from exhausted. From the start of 2025, gold has now surged more than 36% year-to-date and is on track for a weekly gain of roughly 4%, supported by an increasingly dovish Federal Reserve outlook and deteriorating labor data in the U.S. economy.
The rally accelerated after the August nonfarm payrolls report showed the U.S. economy added only 22,000 jobs, far short of consensus expectations of 75,000. The unemployment rate climbed to 4.3%, its highest since 2021, while weekly jobless claims rose by 8,000 to 237,000, confirming the slowdown. Markets immediately priced in aggressive policy easing, with CME FedWatch indicating a 97.6% probability of a 25-basis-point cut at the Fed’s September 17 meeting and growing speculation of a larger 50-basis-point reduction. A softer dollar accompanied the data, with the DXY sliding to 98.00, down 0.25%, while Treasury yields dropped across the curve, enhancing gold’s relative appeal as a non-yielding asset.
The political backdrop adds another dimension. President Donald Trump’s repeated attacks on Fed Chair Jerome Powell and efforts to remove Fed Governor Lisa Cook have raised concerns over the central bank’s independence. Analysts warn that if political interference escalates, investor confidence in U.S. monetary credibility could collapse. Goldman Sachs has even suggested that under these conditions, gold could climb as high as $5,000 per ounce, particularly if monetary policy becomes increasingly dictated by the White House. Such fears reinforce gold’s role as a hedge not just against inflation or currency debasement but against institutional risk.
Technically, gold’s chart remains firmly bullish. The breakout from a symmetrical triangle pattern on the daily timeframe cleared long-term resistance, sending XAU/USD through the $3,578.66 barrier. Immediate resistance now sits at the round $3,600 handle, with bullish targets extending toward $3,879.64 by late September if momentum continues. On the downside, $3,500.20 serves as crucial support, aligning with the 20-day exponential moving average at $3,436.70. RSI readings near 75 suggest overbought conditions, which could trigger corrective pullbacks, but the broader trend remains intact above the 50-day moving average at $3,370.40.
Relative to other assets, gold has massively outperformed. Since December, gold has climbed 30%, while Bitcoin (BTC-USD) has gained only 8%, despite reaching record highs earlier in the year. Equities have struggled, with the S&P 500 giving back intraday records and the Dow Jones retreating on labor concerns. The divergence highlights gold’s resilience as a macro hedge. Demand is also visible in retail channels—gold bars and coins at retailers like Costco (COST) continue selling out rapidly, underlining how mainstream consumer interest has aligned with institutional flows.
Beyond speculative positioning, gold is being underpinned by steady central bank accumulation and heightened geopolitical uncertainty. Mounting risks from trade disputes, U.S. fiscal imbalances, and shifting tariff policies have kept sovereign buyers engaged, while geopolitical flashpoints maintain steady haven flows. Historical precedent supports this trend: during the 2009–2011 cycle, gold surged before a decade-long plateau. Now, with debt burdens higher and fiscal policy uncertain, conditions may be aligning for another prolonged upcycle.
As long as XAU/USD holds above $3,500, the bullish case remains dominant, with the possibility of short-term corrections on profit-taking. The next decisive test lies in reclaiming and holding $3,600, which would open the pathway to $3,879.64 in the weeks ahead. A failure to defend $3,500 could spark a retracement toward $3,445–$3,413, where long-term buyers are expected to re-enter.
After failing to make a decisive move in either direction on Thursday, GBP/USD gathers bullish momentum and trades above 1.3450 in the European session on Friday. The pair faces a strong resistance at 1.3480 as investors await the August labor market data from the United States (US).
The table below shows the percentage change of British Pound (GBP) against listed major currencies this week. British Pound was the weakest against the US Dollar.
| USD | EUR | GBP | JPY | CAD | AUD | NZD | CHF | |
|---|---|---|---|---|---|---|---|---|
| USD | 0.12% | 0.21% | 0.80% | 0.42% | 0.03% | 0.23% | 0.47% | |
| EUR | -0.12% | 0.08% | 0.62% | 0.30% | -0.09% | 0.11% | 0.36% | |
| GBP | -0.21% | -0.08% | 0.44% | 0.22% | -0.17% | 0.03% | 0.32% | |
| JPY | -0.80% | -0.62% | -0.44% | -0.31% | -0.75% | -0.53% | -0.29% | |
| CAD | -0.42% | -0.30% | -0.22% | 0.31% | -0.38% | -0.19% | 0.10% | |
| AUD | -0.03% | 0.09% | 0.17% | 0.75% | 0.38% | 0.20% | 0.49% | |
| NZD | -0.23% | -0.11% | -0.03% | 0.53% | 0.19% | -0.20% | 0.29% | |
| CHF | -0.47% | -0.36% | -0.32% | 0.29% | -0.10% | -0.49% | -0.29% |
The heat map shows percentage changes of major currencies against each other. The base currency is picked from the left column, while the quote currency is picked from the top row. For example, if you pick the British Pound from the left column and move along the horizontal line to the US Dollar, the percentage change displayed in the box will represent GBP (base)/USD (quote).
The US Dollar (USD) struggled to gather strength against its rivals as investors refrained from taking large positions following the mixed macroeconomic data releases. The Institute for Supply Management’s (ISM) Services Purchasing Managers’ Index (PMI) rose to 52 in August from 50.1 in July, surpassing the market expectation of 51. On the other hand, the Automatic Data Processing’s (ADP) monthly report showed that private sector payrolls rose by 54,000 in August. This print missed analysts’ estimate of 65,000.
Nonfarm Payrolls (NFP) in the US are expected to increase by 75,000 in August and the Unemployment Rate is seen edging higher to 4.3% from 4.2% in July.
Although the CME FedWatch Tool suggests that markets are nearly fully pricing in a 25 basis-points (bps) rate cut in September, the employment report could still influence the probability of one more rate cut in October, currently at 55%, and drive the USD’s valuation.
In case the NFP comes in at or below 50K and feeds into growing fears over worsening conditions in the labor market, the USD could come under heavy selling pressure heading into the weekend and allow GBP/USD to push higher. Conversely, the USD could outperform its rivals on a positive surprise of 100K, or above, and cause the pair to reverse its direction.
The Relative Strength Index (RSI) indicator on the 4-hour chart rose slightly above 50, reflecting sellers hesitancy.
The 20-day, 50-day and the 100-period Simple Moving Averages (SMAs) converge near 1.3480 to form a strong resistance level. In case GBP/USD manages to clear this hurdle, it could face the next resistance at 1.3540 (Fibonacci 61.8% retracement of the latest downtrend) before 1.3600 (static level, round level).
Looking south, support levels could be spotted at 1.3440 (200-period SMA), 1.3390-1.3400 (Fibonacci 38.2% retracement, round level) and 1.3330 (static level).
A country’s Gross Domestic Product (GDP) measures the rate of growth of its economy over a given period of time, usually a quarter. The most reliable figures are those that compare GDP to the previous quarter e.g Q2 of 2023 vs Q1 of 2023, or to the same period in the previous year, e.g Q2 of 2023 vs Q2 of 2022.
Annualized quarterly GDP figures extrapolate the growth rate of the quarter as if it were constant for the rest of the year. These can be misleading, however, if temporary shocks impact growth in one quarter but are unlikely to last all year – such as happened in the first quarter of 2020 at the outbreak of the covid pandemic, when growth plummeted.
A higher GDP result is generally positive for a nation’s currency as it reflects a growing economy, which is more likely to produce goods and services that can be exported, as well as attracting higher foreign investment. By the same token, when GDP falls it is usually negative for the currency.
When an economy grows people tend to spend more, which leads to inflation. The country’s central bank then has to put up interest rates to combat the inflation with the side effect of attracting more capital inflows from global investors, thus helping the local currency appreciate.
When an economy grows and GDP is rising, people tend to spend more which leads to inflation. The country’s central bank then has to put up interest rates to combat the inflation. Higher interest rates are negative for Gold because they increase the opportunity-cost of holding Gold versus placing the money in a cash deposit account. Therefore, a higher GDP growth rate is usually a bearish factor for Gold price.
At 10:15 GMT, XAU/USD is trading $3551.11, up $5.24 or +0.15%.
Gold is on track for its best weekly performance in three months, supported by rising speculation that the Federal Reserve is preparing to cut rates. A string of weaker-than-expected U.S. labor data, including soft ADP private payrolls and elevated jobless claims, has strengthened the market’s view that the Fed may cut rates by 25 basis points during its September policy meeting.
The U.S. non-farm payrolls report, due at 1230 GMT, is the next major catalyst. Markets are bracing for an August payrolls increase of just 75,000, slightly above July’s 73,000. A print below expectations would likely reinforce dovish Fed expectations and drive bond yields and the dollar lower—conditions that tend to benefit non-yielding assets like gold.
Technically, the 50-day moving average at $3,370.40 remains a key trend support. As long as gold holds above this level, the broader uptrend remains intact. The market’s recent strength has been fueled by a confluence of lower funding costs, geopolitical risk premiums, a steepening yield curve, and a weaker U.S. dollar—tailwinds that continue to support bullish sentiment.
Fed officials this week emphasized concerns over the labor market, signaling growing support for rate cuts. With monetary policy shifting toward easing and risk appetite still fragile, gold continues to draw interest from both institutional and speculative buyers.
As long as spot gold holds above $3,500.20, the near-term outlook remains bullish. A weaker-than-expected U.S. jobs report could provide the fuel needed for a fresh breakout above $3,578.66 and a potential rally toward $3,879.64 by September 23.
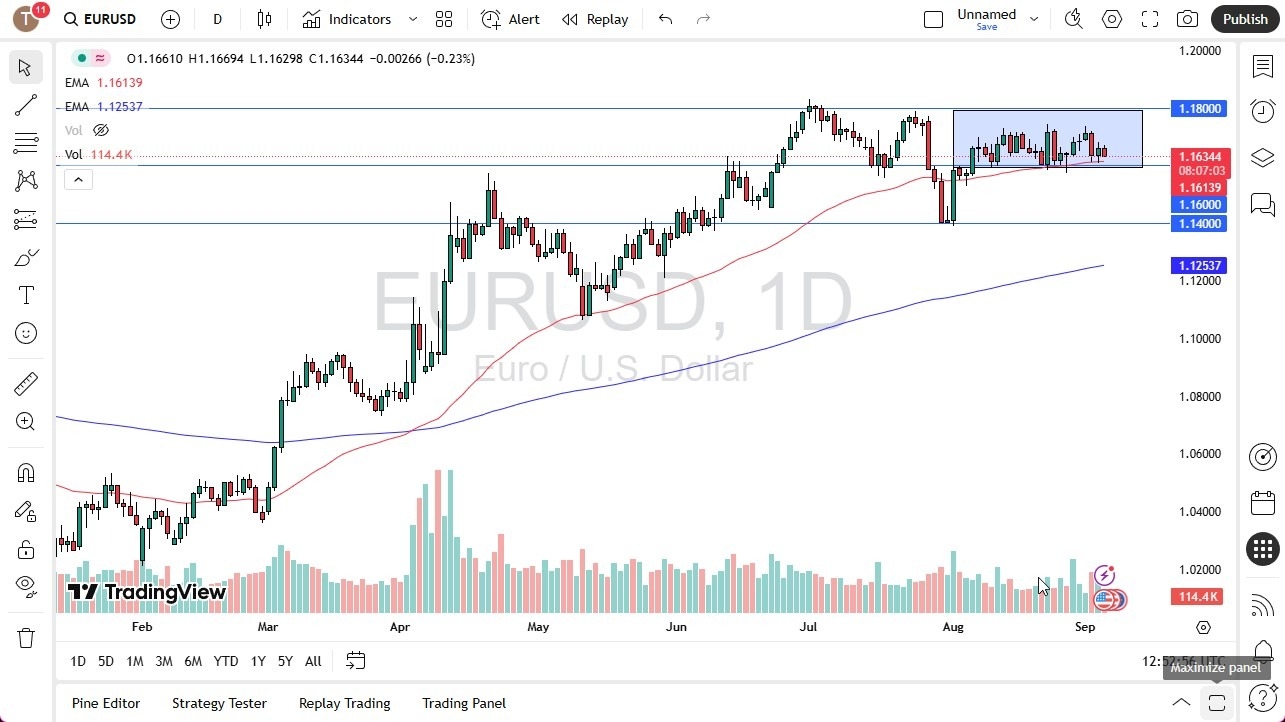
Interestingly enough, we have seen the 50 day EMA come into the fold, offering support right along with the 1.16 level. To the upside, the 1.1750 level is resistance that extends all the way to the one point one eight level.

All things being equal, this is a market that has gone sideways after a nice uptrend. And I think traders are starting to wonder whether or not the Federal Reserve possibly cutting interest rates, supposedly cutting interest rates that is in September, isn’t the sign of something a little bit more ominous for the global economy. If it does end up being that way, then the US dollar will get a bit of a bid in a simple safety trade type of situation. Ultimately, I think this is a market that has a lot of decisions that will have to be made soon.
But ultimately, we are currently looking at this through the prism of trying to sort out where to go next. If we can break down below the 1.16 level, then the 1.14 level could be your target. A break above 1.18 opens up the possibility of 1.20.
Ready to trade our Forex daily analysis and predictions? Here’s a list of regulated forex brokers to choose from.
Christopher Lewis has been trading Forex and has over 20 years experience in financial markets. Chris has been a regular contributor to Daily Forex since the early days of the site. He writes about Forex for several online publications, including FX Empire, Investing.com, and his own site, aptly named The Trader Guy. Chris favours technical analysis methods to identify his trades and likes to trade equity indices and commodities as well as Forex. He favours a longer-term trading style, and his trades often last for days or weeks.