The main category of Forex News.
You can use the search box below to find what you need.
[wd_asp id=1]
The main category of Forex News.
You can use the search box below to find what you need.
[wd_asp id=1]
Gold price (XAU/USD) trades in a tight range around $3,350 during the European trading session on Friday. The precious metal consolidates as investors await the United States (US) Nonfarm Payrolls (NFP) data for August, which will be published at 12:30 GMT.
Investors will pay close attention to the US official labor market data as it will influence market expectations for the interest rate outlook. Fed dovish expectations intensified in early August after the July’s NFP report showed a significant revision in employed figures of May and June on the downside.
Lower interest rates by the Fed improves demand for non-yielding assets, such as Gold.
Economists expect US employers to have hired 75K fresh workers, almost in line with the July’s reading of 73K. The Unemployment Rate is expected to have accelerated to 4.3% from the former release of 4.2%.
Meanwhile, Average Hourly Earnings, a key measure of wage growth, is expected to have grown at a moderate pace of 3.7%, against 3.9% in July, with monthly figures rising steadily by 0.3%.
Ahead of the US NFP data, the US Dollar Index (DXY), which tracks the Greenback’s value against six major currencies, trades 0.25% lower to near 98.00. Technically, lower US Dollar (USD) makes the Gold price an attractive bet for investors.
Gold price’s rally hit pause after posting a fresh all-time high near $3,580 on Wednesday. The yellow metal strengthened after a breakout of the Symmetrical Triangle chart pattern formed on a daily timeframe.
The near-term trend of the Gold price is bullish as the 20-day Exponential Moving Average (EMA) slops higher around $3,436.70.
The 14-day Relative Strength Index (RSI) jumps to near 75.00. A corrective move in the Gold price looks likely as the momentum oscillator turns overbought.
Looking down, the 20-day will act as key support for the major. On the upside, the round figure of $3,600 would be the key hurdle for the pair.
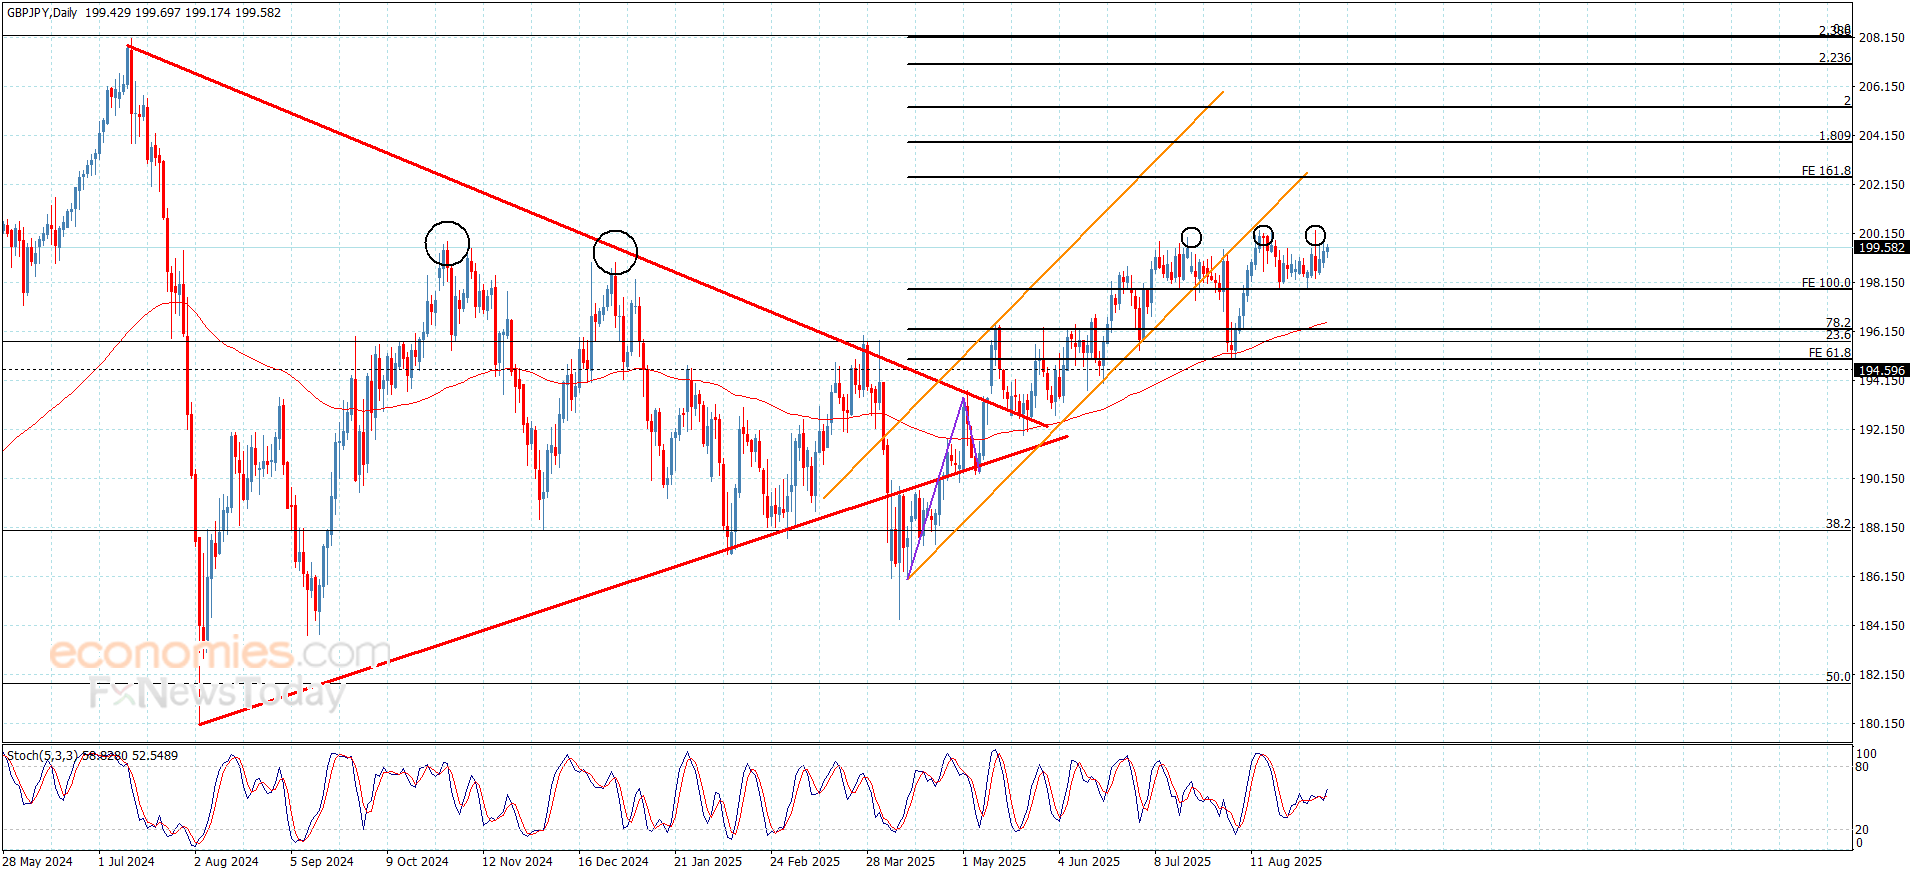
The GBPJPY pair attempted to face the attempts of activating the bearish correctional track, taking advantage of providing positive momentum by stochastic, but it didn’t make it surpass the barrier at 200.40, to keep providing mixed sideways trading by its stability near 199.50.
The expected trend depends on the strength of the mentioned barrier, the continuation of the price stability below it will increase the chances of activating the negative attempts that might target 198.60 level, reaching the support at 197.85, while breaching the barrier and holding above it will activate the bullish track, to reach 200.90 followed by the next positive target at 202.45.
The expected trading range for today is between 197.85 and 199.80
Trend forecast: Bearish
The (ETHUSD) price declined in its last intraday levels, amid the dominance of the bearish corrective trend on the short-term basis and its trading alongside supportive bias line for this track, accompanied by the continuation of the negative pressure that comes from its trading below EMA50, intensifying the negative pressure on the price, to approach from the key support at $4,250, preparing to break it. On the other hand, we notice the emergence of positive signals on the (RSI), after reaching oversold levels, which might reduce the upcoming losses.
Get high-accuracy trading signals delivered directly to your Telegram. Subscribe to specialized packages tailored for the world’s top markets:
Full VIP signals performance report for August 25–29, 2025:
The GBPJPY pair attempted to face the attempts of activating the bearish correctional track, taking advantage of providing positive momentum by stochastic, but it didn’t make it surpass the barrier at 200.40, to keep providing mixed sideways trading by its stability near 199.50.
The expected trend depends on the strength of the mentioned barrier, the continuation of the price stability below it will increase the chances of activating the negative attempts that might target 198.60 level, reaching the support at 197.85, while breaching the barrier and holding above it will activate the bullish track, to reach 200.90 followed by the next positive target at 202.45.
The expected trading range for today is between 197.85 and 199.80
Trend forecast: Bearish
Silver price (XAG/USD) recovers ground after registering more than 1% losses in the previous session, trading around $40.80 per troy ounce during the European hours on Friday. The technical analysis of the daily chart suggests the price of the precious metal rises upwards within an ascending channel pattern, strengthening the bullish market bias.
The 14-day Relative Strength Index (RSI) is positioned slightly below the 70 level, strengthening the bullish bias. The momentum indicator suggests that Silver is trading in overbought territory, yet the prevailing uptrend remains strong with buyers maintaining control. Additionally, the XAG/USD pair is trading above the nine-day Exponential Moving Average (EMA), indicating that short-term price momentum is strengthening.
On the upside, the XAG/USD pair may test $41.47, the highest since September 2011, reached on September 3, followed by the upper boundary of the ascending channel around $42.00. A decisive break above this key resistance zone would strengthen the bullish bias and pave the way for the metal to approach the psychological level of $43.00.
The primary support lies at the nine-day EMA of $40.16, followed by the ascending channel’s lower boundary around $39.60. A break below the channel would weaken the bullish sentiment and put downward pressure on the Silver price to reach the 50-day EMA of $38.14. Further losses would undermine medium-term momentum, pushing the XAG/USD pair toward the three-month low of $35.80, last seen on July 1.
Silver is a precious metal highly traded among investors. It has been historically used as a store of value and a medium of exchange. Although less popular than Gold, traders may turn to Silver to diversify their investment portfolio, for its intrinsic value or as a potential hedge during high-inflation periods. Investors can buy physical Silver, in coins or in bars, or trade it through vehicles such as Exchange Traded Funds, which track its price on international markets.
Silver prices can move due to a wide range of factors. Geopolitical instability or fears of a deep recession can make Silver price escalate due to its safe-haven status, although to a lesser extent than Gold’s. As a yieldless asset, Silver tends to rise with lower interest rates. Its moves also depend on how the US Dollar (USD) behaves as the asset is priced in dollars (XAG/USD). A strong Dollar tends to keep the price of Silver at bay, whereas a weaker Dollar is likely to propel prices up. Other factors such as investment demand, mining supply – Silver is much more abundant than Gold – and recycling rates can also affect prices.
Silver is widely used in industry, particularly in sectors such as electronics or solar energy, as it has one of the highest electric conductivity of all metals – more than Copper and Gold. A surge in demand can increase prices, while a decline tends to lower them. Dynamics in the US, Chinese and Indian economies can also contribute to price swings: for the US and particularly China, their big industrial sectors use Silver in various processes; in India, consumers’ demand for the precious metal for jewellery also plays a key role in setting prices.
Silver prices tend to follow Gold’s moves. When Gold prices rise, Silver typically follows suit, as their status as safe-haven assets is similar. The Gold/Silver ratio, which shows the number of ounces of Silver needed to equal the value of one ounce of Gold, may help to determine the relative valuation between both metals. Some investors may consider a high ratio as an indicator that Silver is undervalued, or Gold is overvalued. On the contrary, a low ratio might suggest that Gold is undervalued relative to Silver.
The Silver price (XAG/USD) attracts some buyers near $40.85 during the Asian trading hours on Friday, bolstered by the weaker US Dollar (USD). The white metal receives support from the prospect of the US Federal Reserve (Fed) rate cut this year. Traders await the release of the highly-anticipated US August Nonfarm Payrolls (NFP) report later on Friday for fresh impetus.
Data released on Thursday showed that the US Initial Jobless Claims increased more than expected last week. Additionally, the ADP National Employment Report revealed that US private payrolls increased less than expected in August.
These reports indicated softening labor market conditions, reinforcing the Fed rate reduction expectation. This, in turn, weighs on the US Dollar (USD) and lifts the USD-denominated commodity price. Lower interest rates could reduce the opportunity cost of holding Silver, supporting the non-yielding white metal.
Additionally, geopolitical tensions might contribute to the white metal’s upside, as it is considered a safe-haven asset. The US is looking to pressure buyers of Russian crude to push Moscow into agreeing to a truce in Ukraine. US Treasury Secretary Bessent said on Tuesday that the US “will be examining sanctions on Russia very closely this week” due to the ongoing war in Ukraine.
The US NFP report will be closely watched later on Friday. This reading could offer some hints about the US interest rate path. Economists forecast to see 75,000 job additions in August. In case of a stronger-than-expected outcome, this could boost the Greenback and drag the Silver price lower in the near term.
Silver is a precious metal highly traded among investors. It has been historically used as a store of value and a medium of exchange. Although less popular than Gold, traders may turn to Silver to diversify their investment portfolio, for its intrinsic value or as a potential hedge during high-inflation periods. Investors can buy physical Silver, in coins or in bars, or trade it through vehicles such as Exchange Traded Funds, which track its price on international markets.
Silver prices can move due to a wide range of factors. Geopolitical instability or fears of a deep recession can make Silver price escalate due to its safe-haven status, although to a lesser extent than Gold’s. As a yieldless asset, Silver tends to rise with lower interest rates. Its moves also depend on how the US Dollar (USD) behaves as the asset is priced in dollars (XAG/USD). A strong Dollar tends to keep the price of Silver at bay, whereas a weaker Dollar is likely to propel prices up. Other factors such as investment demand, mining supply – Silver is much more abundant than Gold – and recycling rates can also affect prices.
Silver is widely used in industry, particularly in sectors such as electronics or solar energy, as it has one of the highest electric conductivity of all metals – more than Copper and Gold. A surge in demand can increase prices, while a decline tends to lower them. Dynamics in the US, Chinese and Indian economies can also contribute to price swings: for the US and particularly China, their big industrial sectors use Silver in various processes; in India, consumers’ demand for the precious metal for jewellery also plays a key role in setting prices.
Silver prices tend to follow Gold’s moves. When Gold prices rise, Silver typically follows suit, as their status as safe-haven assets is similar. The Gold/Silver ratio, which shows the number of ounces of Silver needed to equal the value of one ounce of Gold, may help to determine the relative valuation between both metals. Some investors may consider a high ratio as an indicator that Silver is undervalued, or Gold is overvalued. On the contrary, a low ratio might suggest that Gold is undervalued relative to Silver.
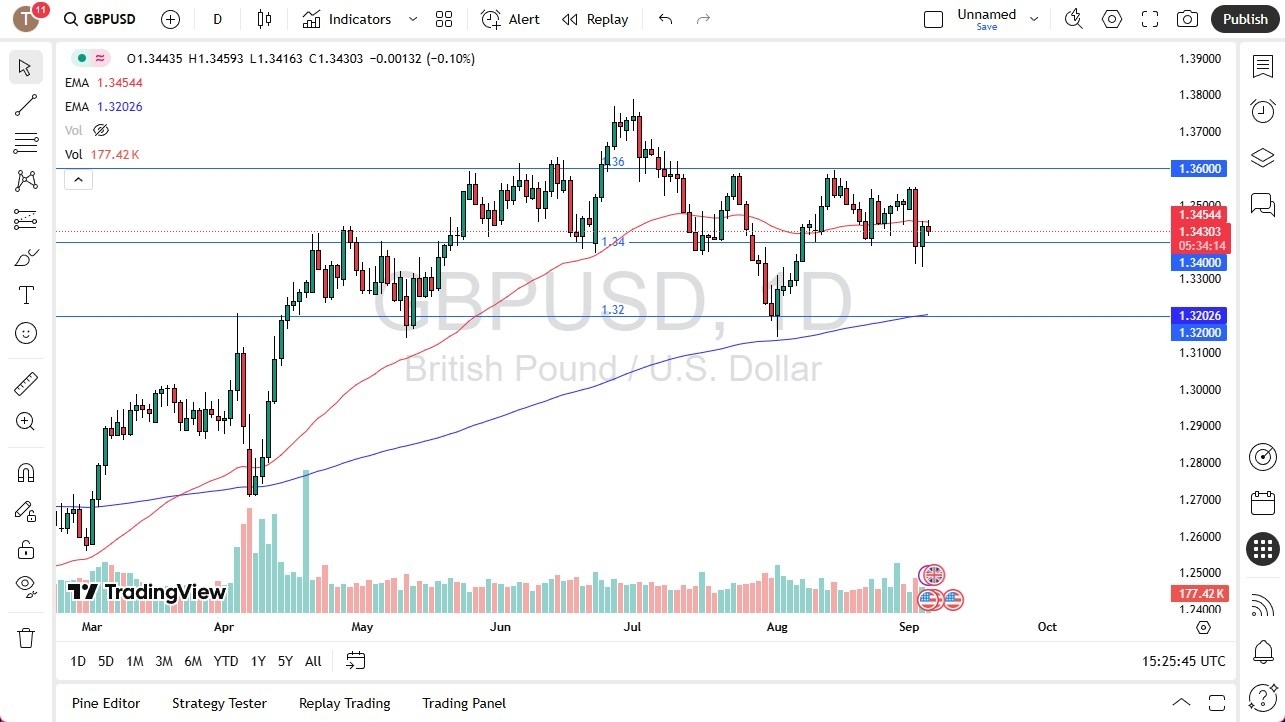
The technical analysis for this market is relatively flat over the last couple of weeks, but there are a couple of levels that I will be looking at very closely. The first one would be the 1.34 level, which has offered support over the last couple weeks, and previously has been significant resistance previously. If we were to break down below the last couple of candlesticks, then we could see the British pound drop down to the 1.32 level. That’s an area that’s been support, but we also have the 200 Day EMA, so ultimately this is a situation where we have a lot of interest.

If we were to break to the upside, and break above the 50 Day EMA, the market is likely to go looking at the 1.36 level. The 1.36 level is a major resistance barrier, and is a bit important going forward, if we can break above there, then it’s likely that we really could see the US dollar fall, and the British pound really started to take off.
I think at this point we need to be very cautious, as there is a lot of back and forth noise. In general, this is a market that I think continues to see a lot of volatility, but as things stand right now, we are basically in the middle of the larger 400 pip trading range.
Ready to trade our daily GBP/USD Forex forecast? Here’s some of the best forex broker UK reviews to check out.
Christopher Lewis has been trading Forex and has over 20 years experience in financial markets. Chris has been a regular contributor to Daily Forex since the early days of the site. He writes about Forex for several online publications, including FX Empire, Investing.com, and his own site, aptly named The Trader Guy. Chris favours technical analysis methods to identify his trades and likes to trade equity indices and commodities as well as Forex. He favours a longer-term trading style, and his trades often last for days or weeks.
Momentum has been building since last week’s bullish breakout from a falling wedge pattern. That advance was reinforced by a reclaim of several key resistance levels, including the 20-Day moving average. If today’s low of $3.02 is broken, natural gas could revisit support near the long-term anchored VWAP, now at $2.96, with further downside risk toward the 20-Day moving average at $2.89. For now, though, the market continues to trade well above those levels, suggesting that buyers remain in control.
The 50-Day moving average is a critical pivot. A sustained advance and daily close above this average would open the door for a rally through the July swing high of $3.19 and potentially toward the 200-Day average, now near $3.50. Conversely, another rejection here would not be surprising given the nearly 20% rally off the recent $2.62 low. A brief consolidation or pullback would provide a healthier setup for continuation, rather than a straight-line advance.
On the larger timeframe, natural gas continues to show signs of strength. Last week produced a wide-ranging bullish engulfing pattern on the weekly chart, supported by a bullish reversal confirmation this week. A weekly close above last week’s high of $3.02 would cement the breakout and bolster the case for a push through current resistance. That confirmation, coupled with strong price behavior above the AVWAP and 20-Day average, underscores improving demand.
For a look at all of today’s economic events, check out our economic calendar.
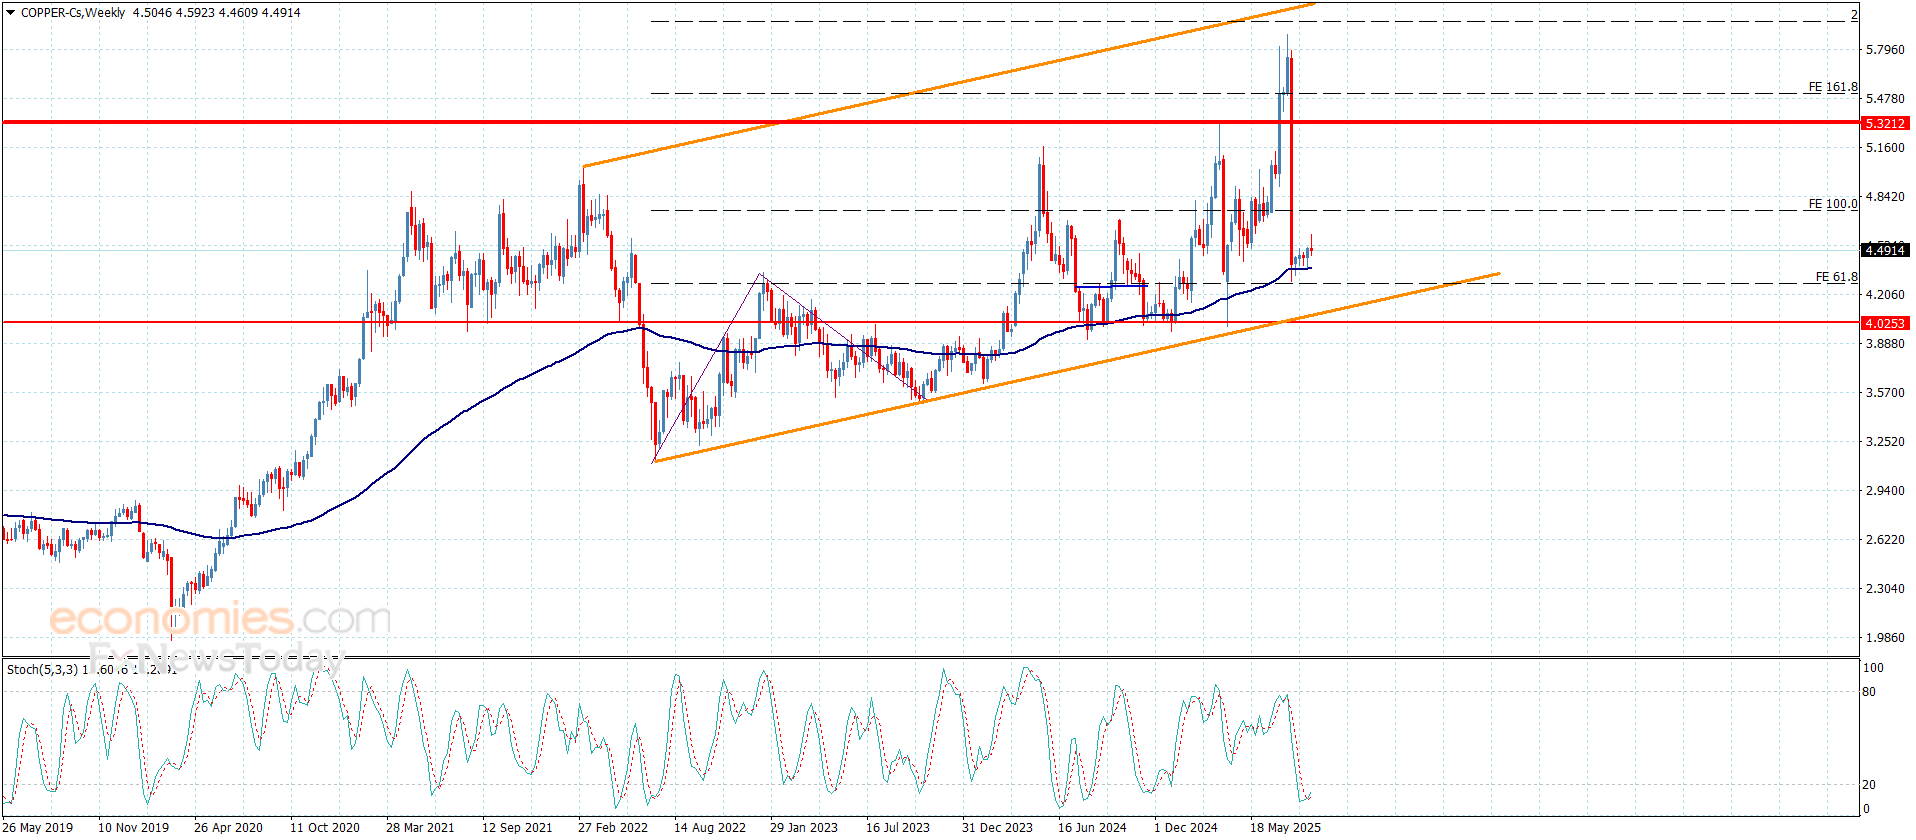
Copper price touched $4.5950 yesterday, to approach from the initial positive target, which forces it to form sideways fluctuation, due to its neediness to the positive momentum by the stability of stochastic with the oversold level.
While the stability of the price is within the bullish track, by moving away from the extra support at $4.2600, by providing positive momentum by the moving average 55, these factors make us keep the bullish suggestion, to expect surpassing $4.6200 level and reaching the next target near $4.7500.
The expected trading range for today is between $4.4200 and $4.7500
Trend forecast: Bullish
The USD/JPY pair has stabilized above the 148 handle, climbing to 148.75 with a 0.30% daily gain after wiping out yesterday’s decline. The rebound comes as U.S. data eased concerns about a stalling economy highlighted in the Beige Book, with traders repositioning ahead of Friday’s nonfarm payrolls. The pair’s price action since mid-August continues to confirm a sequence of higher lows and higher highs, reinforcing the short-term bullish channel that targets 149.00 and 150.75 if momentum persists.
U.S. economic data shows clear signs of cracks in the labor market. Job openings fell to 7.18 million in July from 7.36 million in June, the lowest in nearly a year. ADP reported private sector hiring of just 54,000 in August, down from July’s 104,000, while layoffs are ticking higher. The ISM Services survey showed employment stuck in contraction even as new orders remained firm. These signals highlight a cooling jobs market, bolstering expectations that the Federal Reserve will proceed with its widely anticipated 25 bps rate cut at the September 16–17 meeting. CME FedWatch places probability of the move above 95%, with a 53% chance of another cut on October 29. Fed’s John Williams reinforced the cautious easing stance, calling policy only “modestly restrictive” and leaving the door open for gradual rate reductions if inflation cools further.
The Bank of Japan remains cautious despite its first steps toward normalization earlier this year. Governor Kazuo Ueda has reiterated a gradual pace of rate hikes, contingent on inflation and growth alignment, but recent comments from Deputy Governor Ryuzo Himino stressed that uncertainty is too high to justify urgency. Current pricing assigns less than a 30% probability of a September hike. At the same time, Japan’s political backdrop is weakening the yen. Ruling party secretary-general Hiroshi Moriyama’s resignation, combined with speculation that Prime Minister Shigeru Ishiba may also step down, has fueled expectations that Sanae Takaichi—known for supporting ultra-low rates—could emerge as a successor. Political risk and the likelihood of continued accommodative BoJ policy underpin yen softness, helping drive USD/JPY back toward five-week highs near 149.14.
Technically, USD/JPY has been consolidating between the 147.85 support—coinciding with the 200-day EMA—and resistance near 149.10. A close above 149.12 would extend the rebound from 146.20 and retest the 150.90 zone, which represents both the prior high and the 61.8% Fibonacci retracement of the January–April downtrend. If bulls clear this hurdle, the path opens toward 151.22 and possibly 154.60. Momentum indicators support the bullish case: the MACD on the daily chart is preparing for a bullish crossover, and RSI remains in neutral territory with room to climb. On the downside, a break under 146.65 would end the bullish sequence, exposing 145.35 and the 23.6% Fibonacci retracement at 144.35 as deeper supports.
With USD/JPY pinned at 148.65–148.75 into Thursday’s U.S. close, traders are balancing Fed dovish expectations with BoJ’s cautious stance. Friday’s NFP will be decisive: consensus stands at 75,000 jobs added, barely above last month’s 73,000. A miss would accelerate dollar selling and test 147.85, while a stronger print could price out aggressive Fed cuts and propel the pair toward 151.00. Japanese household spending and labor earnings data due the same day will also provide insight into domestic demand, influencing how much leeway the BoJ has for policy shifts.