The main category of Forex News.
You can use the search box below to find what you need.
[wd_asp id=1]
The main category of Forex News.
You can use the search box below to find what you need.
[wd_asp id=1]
The euro has been trying to recover early on Monday, but in a very lackluster fashion. I think at this point, traders are out there trying to sort out what the Friday speech actually means for forex markets when Kevin Warsh basically eliminated the idea of Federal Reserve rate cuts that many traders had been trying to price in.
As usual, the market got way ahead of itself with that. We’ve been seeing this for a couple of years now where the market gets excited about potential rate cuts coming out of the United States for a couple of weeks, and then reality sets in. And I think that’s part of what’s going on here.
So, I’m watching the euro to sell it, not to buy it. Somewhere around the 1.1620 level, if we start to see signs of exhaustion, that would be about a 50% retracement of the move from Friday; I might look for getting short there.

The British pound, I think, is probably going to be somewhat range-bound, mainly because the British pound, of course, has a higher interest rate attached to it. So, it is a little insulated from US dollar strength, and I think most of the reaction was more about the US dollar than anything else.
I wouldn’t read too much into British pound weakness, because at this point in time, even if I want to buy the US dollar, I am going to short other currencies, weaker currencies.
The British pound for me is what I want to buy if the US dollar starts to roll over. Right now, it looks pretty weak, so while shorting the pound could be possible in this general vicinity, the reality is we will probably get more mileage out of other currencies.

The US dollar against the Canadian dollar is what I’m looking to buy on a little bit of a dip, and there’s a whole host of reasons for this, not the least of which is that the United States and Canada are still in a trade war, and quite frankly, that’s not an even match.
So, I like the idea of buying the US dollar on dips here, and it would not surprise me over the next day or two to go looking toward the 1.3950 level.
We’ll just see how this plays out. Rates in America continue to rise; that only adds more fuel to the fire.
If you’d like to know more about how to trade forex, please visit our educational area.
This article was originally posted on FX Empire
Silver (XAG/USD) is little changed on Monday, caught between a weaker US Dollar (USD) and lingering hawkish Federal Reserve (Fed) expectations, leaving the metal without clear direction after tumbling 4.11% on Friday in the wake of Fed Chair Kevin Warsh’s hawkish Jackson Hole comments. At the time of writing, XAG/USD trades around $66.25, down 0.23% on the day.
Warsh’s inflation-focused remarks at Jackson Hole initially pushed the US Dollar to over one-week highs, with the Dollar Index (DXY) climbing as high as 99.72, as traders revived bets on a September rate hike. The CME FedWatch Tool now shows a 65% probability of a 25-basis-point increase at next month’s meeting. The Greenback has since retraced most of those gains on Monday, with the DXY trading around 99.44 at the time of writing.
From a technical perspective, the latest leg lower has pushed XAG/USD back below the 100-day Simple Moving Average (SMA), tilting the near-term bias to bearish, though the metal still holds above the 50-day SMA at $61 and a Fibonacci support band between $60.97 (61.8% retracement) and $64.79 (38.2% level).
The Relative Strength Index (RSI) on the daily chart at 53 remains in neutral territory, having eased from above 60, suggesting bullish momentum is starting to fade while the Moving Average Convergence Divergence (MACD) indicator hovers near the zero line with a flattened profile, hinting at a consolidative phase before the next directional move.
On the topside, initial resistance emerges at the 23.6% Fibonacci retracement at $67.16, followed closely by the 100-day SMA near $68, where a sustained break would open the way toward the Fibonacci structural anchor at $70.99 and ultimately the 200-day SMA at $72.
On the downside, immediate support is seen at the 38.2% retracement at $64.79, with deeper demand located at the 50% level at $62.88 and the 61.8% retracement at $60.97, while the 50-day SMA at $61 reinforces this broader demand zone on any extended pullback.
(The technical analysis of this story was written with the help of an AI tool. Know more.)
The table below shows the percentage change of US Dollar (USD) against listed major currencies today. US Dollar was the strongest against the Australian Dollar.
| USD | EUR | GBP | JPY | CAD | AUD | NZD | CHF | |
|---|---|---|---|---|---|---|---|---|
| USD | -0.29% | -0.10% | -0.24% | -0.35% | -0.01% | -0.09% | -0.18% | |
| EUR | 0.29% | 0.18% | 0.06% | -0.03% | 0.23% | 0.22% | 0.11% | |
| GBP | 0.10% | -0.18% | -0.11% | -0.24% | 0.05% | 0.03% | -0.04% | |
| JPY | 0.24% | -0.06% | 0.11% | -0.12% | 0.22% | 0.17% | 0.08% | |
| CAD | 0.35% | 0.03% | 0.24% | 0.12% | 0.35% | 0.29% | 0.19% | |
| AUD | 0.01% | -0.23% | -0.05% | -0.22% | -0.35% | -0.04% | -0.09% | |
| NZD | 0.09% | -0.22% | -0.03% | -0.17% | -0.29% | 0.04% | -0.08% | |
| CHF | 0.18% | -0.11% | 0.04% | -0.08% | -0.19% | 0.09% | 0.08% |
The heat map shows percentage changes of major currencies against each other. The base currency is picked from the left column, while the quote currency is picked from the top row. For example, if you pick the US Dollar from the left column and move along the horizontal line to the Japanese Yen, the percentage change displayed in the box will represent USD (base)/JPY (quote).
The US Dollar (USD) is down 0.3% to near 159.65 against the Japanese Yen (JPY) during the European trading session on Monday. The USD/JPY pair declines as the Japanese currency outperforms its peers on hopes of support from the United States (US)-Japan joint intervention.
The table below shows the percentage change of Japanese Yen (JPY) against listed major currencies today. Japanese Yen was the strongest against the Australian Dollar.
| USD | EUR | GBP | JPY | CAD | AUD | NZD | CHF | |
|---|---|---|---|---|---|---|---|---|
| USD | -0.15% | -0.03% | -0.26% | -0.14% | 0.04% | -0.05% | -0.14% | |
| EUR | 0.15% | 0.10% | -0.09% | 0.00% | 0.15% | 0.11% | 0.00% | |
| GBP | 0.03% | -0.10% | -0.19% | -0.10% | 0.04% | -0.00% | -0.08% | |
| JPY | 0.26% | 0.09% | 0.19% | 0.10% | 0.29% | 0.22% | 0.14% | |
| CAD | 0.14% | -0.01% | 0.10% | -0.10% | 0.19% | 0.12% | 0.02% | |
| AUD | -0.04% | -0.15% | -0.04% | -0.29% | -0.19% | -0.06% | -0.11% | |
| NZD | 0.05% | -0.11% | 0.00% | -0.22% | -0.12% | 0.06% | -0.08% | |
| CHF | 0.14% | -0.01% | 0.08% | -0.14% | -0.02% | 0.11% | 0.08% |
The heat map shows percentage changes of major currencies against each other. The base currency is picked from the left column, while the quote currency is picked from the top row. For example, if you pick the Japanese Yen from the left column and move along the horizontal line to the US Dollar, the percentage change displayed in the box will represent JPY (base)/USD (quote).
Analysts at Scotiabank flag that the recent “defensive price action is notable, and somewhat worrisome for policymakers at the BoJ, as well as officials at the MoF,” particularly as media reports highlight “the aggregate $96.4bn intervention effort to support the yen from July 30 to August 26.”
US Treasury Secretary Scott Bessent stated that Washington would intervene with Japan to shore up the Asia-Pacific currency, if needed. These comments came after the US and Japan jointly intervened in late July, as USD/JPY jumped to a multi-decade high near 164.00.
Meanwhile, the US Dollar trades lower, with investors shifting their focus to a slew of US economic data, starting with ISM Manufacturing PMI for August and the JOLTS Job Openings data for July releasing on Tuesday.
As of writing, the US Dollar Index (DXY), which gauges the Greenback’s value against six major currencies, trades 0.16% lower to near 99.50.
In the daily chart, USD/JPY trades at 159.66. The pair holds a mildly bullish near-term bias as spot remains above the 20-day exponential moving average (EMA) at 159.55, suggesting ongoing demand on dips.
The Relative Strength Index (RSI) at 49.39 sits just below the 50 mark, hinting at consolidative conditions rather than overextended momentum, but still compatible with a gradual topside bias while price holds over the short-term EMA.
On the downside, the August 19 low at 158.05 is the key support level. Looking up, the major hurdle is the Friday high at 160.20, followed by the July 31 high at 160.88.
(The technical analysis of this story was written with the help of an AI tool. Know more.)
The Japanese Yen (JPY) is one of the world’s most traded currencies. Its value is broadly determined by the performance of the Japanese economy, but more specifically by the Bank of Japan’s policy, the differential between Japanese and US bond yields, or risk sentiment among traders, among other factors.
One of the Bank of Japan’s mandates is currency control, so its moves are key for the Yen. The BoJ has directly intervened in currency markets sometimes, generally to lower the value of the Yen, although it refrains from doing it often due to political concerns of its main trading partners. The BoJ ultra-loose monetary policy between 2013 and 2024 caused the Yen to depreciate against its main currency peers due to an increasing policy divergence between the Bank of Japan and other main central banks. More recently, the gradually unwinding of this ultra-loose policy has given some support to the Yen.
Over the last decade, the BoJ’s stance of sticking to ultra-loose monetary policy has led to a widening policy divergence with other central banks, particularly with the US Federal Reserve. This supported a widening of the differential between the 10-year US and Japanese bonds, which favored the US Dollar against the Japanese Yen. The BoJ decision in 2024 to gradually abandon the ultra-loose policy, coupled with interest-rate cuts in other major central banks, is narrowing this differential.
The Japanese Yen is often seen as a safe-haven investment. This means that in times of market stress, investors are more likely to put their money in the Japanese currency due to its supposed reliability and stability. Turbulent times are likely to strengthen the Yen’s value against other currencies seen as more risky to invest in.
Gold (XAU/USD) shows marginal gains on Monday, with price action hovering around $4.450 at the time of writing yet unable to take off from last week’s lows in the $4,400 area after depreciating more than 4% late last week. Rising bets that the Federal Reserve (Fed) will hike interest rates in September, coupled with the resumption of hostilities in Iran, are buoying the US Dollar and weighing on precious metals.
Bullion tanked on Friday as Fed Chairman Kevin Warsh conveyed an unexpectedly hawkish message at the Jackson Hole summit. Warsh urged policymakers to focus on prices, and said that the central bank has “work to do” to bring inflation to the bank’s 2% target. Investors ramped up bets of a September hike to 61% from 36% the day before, according to the CME’s FedWatch Tool.
Apart from that, the US and Iran exchanged attacks on Sunday to put an end to about one month of a tense truce. The US military attacked the Iranian island of Larak on Sunday, where the Islamic Revolutionary Guard Corps (IRGC) were allegedly preparing missiles to place sea mines in the Strait of Hormuz. Tehran responded by targeting US airbases in Jordan and the United Arab Emirates. The risk-off reaction has underpinned support to the safe-haven US Dollar.
XAU/USD trades at $4,450 after an impulsive reversal on Friday that pushed price action below the 200-day simple moving average (SMA) at $4,528. This is a very popular indicator for traders, and Friday’s clear move below it gives fresh hope for bears.
Momentum indicators in the bearish charts show a neutral-to-negative stance, with the Relative Strength Index (RSI) at 54.36 easing into a more neutral zone and the Moving Average Convergence Divergence (MACD) indicator drifting into negative territory, which hints at waning upside momentum and scope for further consolidation or downside probes.
Immediate support is seen at Friday’s floor in the $4,400 area, followed by the August 14 low near $4,310 and the August 6 low, near $4,225. Bulls, on the other hand, are likely to be challenged at the mentioned 200-day SMA, at $4,528, and the August 27 low near $4,565 ahead of last week’s highs, near $4,700.;
(The technical analysis of this story was written with the help of an AI tool. Know more.)
Gold has played a key role in human’s history as it has been widely used as a store of value and medium of exchange. Currently, apart from its shine and usage for jewelry, the precious metal is widely seen as a safe-haven asset, meaning that it is considered a good investment during turbulent times. Gold is also widely seen as a hedge against inflation and against depreciating currencies as it doesn’t rely on any specific issuer or government.
Central banks are the biggest Gold holders. In their aim to support their currencies in turbulent times, central banks tend to diversify their reserves and buy Gold to improve the perceived strength of the economy and the currency. High Gold reserves can be a source of trust for a country’s solvency. Central banks added 1,136 tonnes of Gold worth around $70 billion to their reserves in 2022, according to data from the World Gold Council. This is the highest yearly purchase since records began. Central banks from emerging economies such as China, India and Turkey are quickly increasing their Gold reserves.
Gold has an inverse correlation with the US Dollar and US Treasuries, which are both major reserve and safe-haven assets. When the Dollar depreciates, Gold tends to rise, enabling investors and central banks to diversify their assets in turbulent times. Gold is also inversely correlated with risk assets. A rally in the stock market tends to weaken Gold price, while sell-offs in riskier markets tend to favor the precious metal.
The price can move due to a wide range of factors. Geopolitical instability or fears of a deep recession can quickly make Gold price escalate due to its safe-haven status. As a yield-less asset, Gold tends to rise with lower interest rates, while higher cost of money usually weighs down on the yellow metal. Still, most moves depend on how the US Dollar (USD) behaves as the asset is priced in dollars (XAU/USD). A strong Dollar tends to keep the price of Gold controlled, whereas a weaker Dollar is likely to push Gold prices up.
The British pound, I think, is probably going to be somewhat range-bound, mainly because the British pound, of course, has a higher interest rate attached to it. So, it is a little insulated from US dollar strength, and I think most of the reaction was more about the US dollar than anything else.
I wouldn’t read too much into British pound weakness, because at this point in time, even if I want to buy the US dollar, I am going to short other currencies, weaker currencies.
The British pound for me is what I want to buy if the US dollar starts to roll over. Right now, it looks pretty weak, so while shorting the pound could be possible in this general vicinity, the reality is we will probably get more mileage out of other currencies.
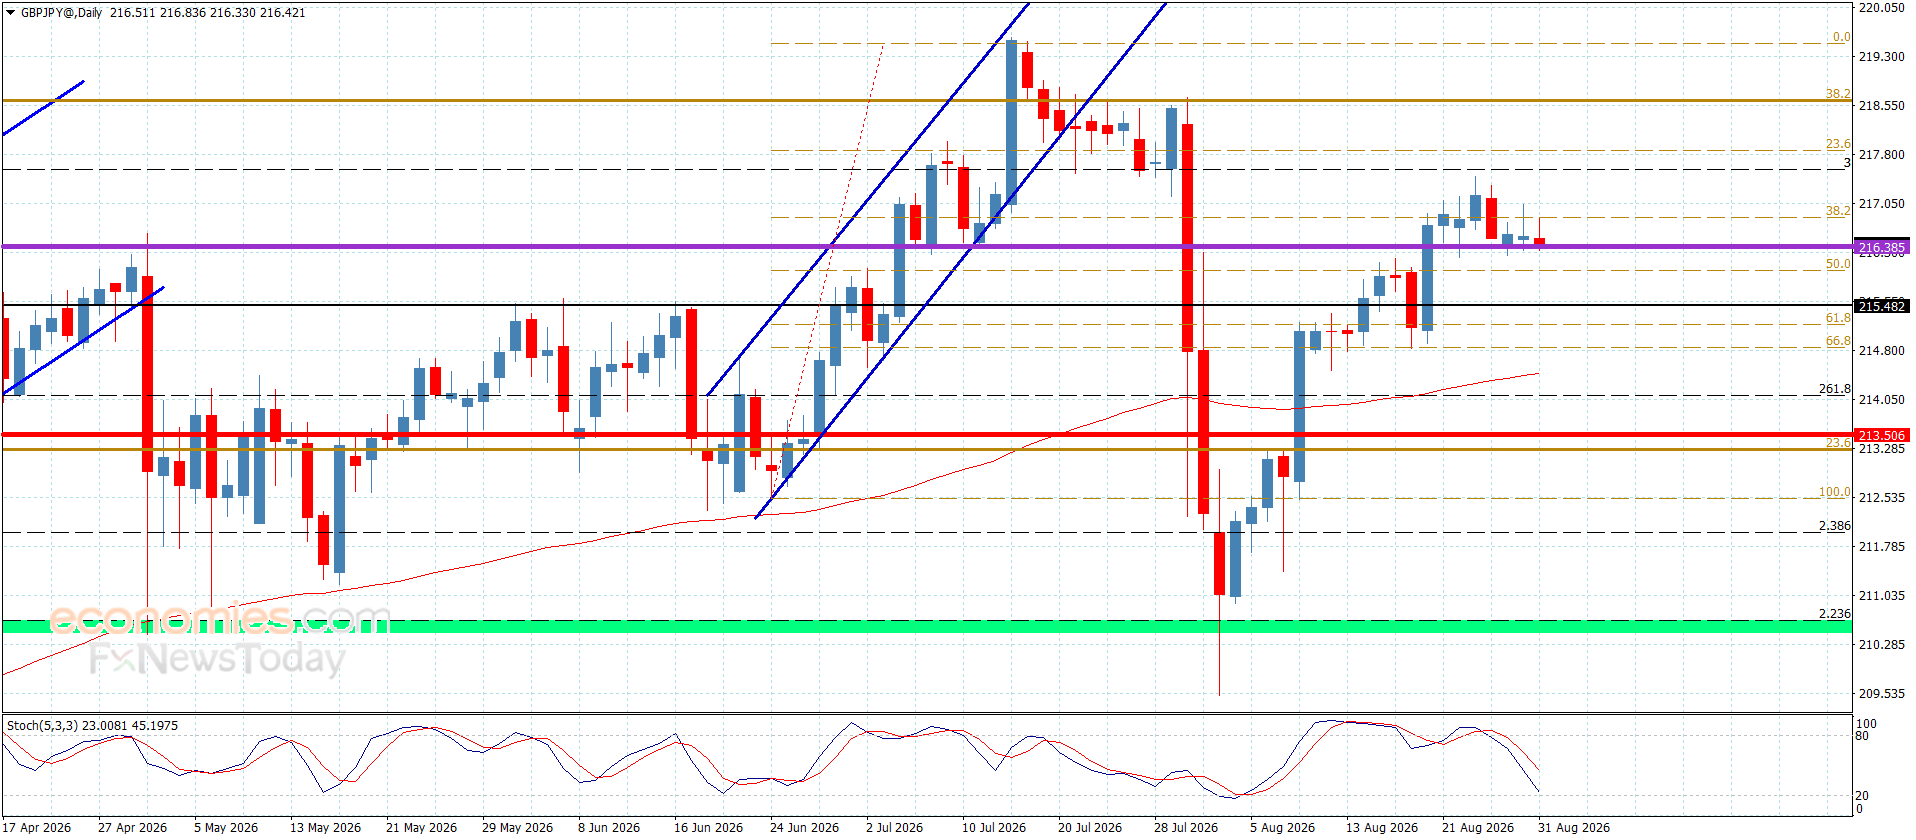
The GBPJPY pair lost its positive momentum as stochastic falls below the 50 level, forcing the pair to post further negative closes below the barrier at 217.85. As a result, the pair is currently forming some corrective waves while stabilizing near the additional support level at 216.35.
Continued exposure to negative pressure will increase the chances of breaking the current support, confirming the pair’s submission to the bearish corrective bias. We therefore expect it to target 215.55 soon, followed by the additional support level near 214.90.
The expected trading range for today is between 215.55 and 217.10.
Trend forecast: Bearish
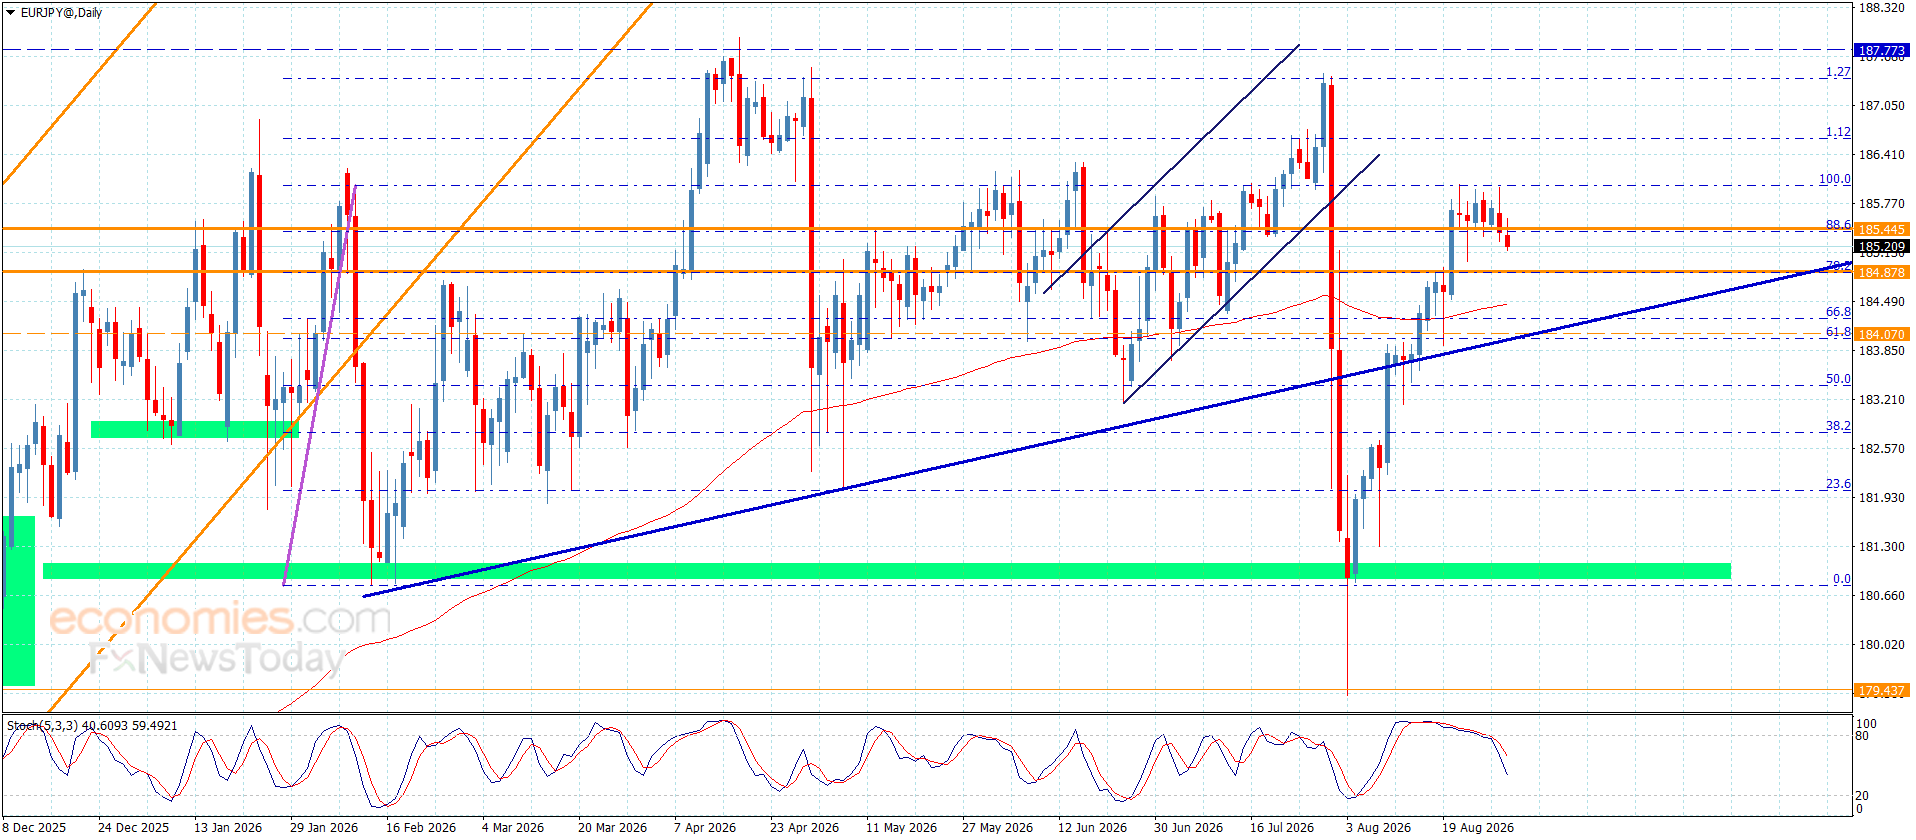
The EURJPY pair confirmed its submission to the bearish corrective bias by posting a new negative close below the barrier at 186.05. The pair is currently responding to the negative pressure from the Stochastic indicator, slipping toward 185.20.
We expect the pair to resume its corrective attempts, targeting 184.85 and 184.40 respectively. However, a successful break above the previously mentioned barrier and holding above it would confirm the pair’s readiness to resume its main bullish attack, with the next target expected at 186.65.
The expected trading range for today is between 184.40 and 185.50.
Trend forecast: Bearish
Welcome, my fellow traders! I have prepared a price forecast for the USCrude, XAUUSD, and EURUSD using a combination of the margin zones method and technical analysis. Based on the market analysis, I suggest entry signals for intraday traders.
Last week, gold’s short-term trend turned bearish.
The article covers the following subjects:
Last week, oil tested the key support of 81.30–80.70 within the short-term uptrend. Bulls managed to hold this zone, and the price began to rise, reaching the first buy target of 84.02 today. The next target is the August high of 87.36. Therefore, consider keeping the remaining long positions open with a stop-loss order at breakeven.
Hold part of long trades opened at support B of 81.30–80.70. TakeProfit: 87.36. StopLoss: at breakeven.
Last week, gold shifted from a short-term uptrend to a downtrend. Today, the price continued to decline, but it has not yet reached the Target Zone of 4,388–4,358. Currently, the price is correcting higher. If the correction persists, the asset may climb to resistance A of 4,509–4,499. Consider short trades near this zone, targeting 4,453 and 4,396.
Sell near resistance A of 4,509–4,499. TakeProfit: 4,453, 4,396. StopLoss: 4,534.
Last week, the euro reached the key support of 1.1585–1.1572 within the short-term uptrend. Long trades can be considered near this zone, with the first target at 1.1642 and the second one around 1.1711.
If the EURUSD pair breaks below the support zone B of 1.1585–1.1572, the trend will turn bearish. In this case, one may consider short trades on the next trading day, targeting the lower Target Zone of 1.1459–1.1434.
Buy near support B of 1.1585–1.1572. TakeProfit: 1.1642, 1.1711. StopLoss: 1.1540.
Would you like to learn more about technical analysis methods and principles? Explore our comprehensive guide.
P.S. Did you like my article? Share it in social networks: it will be the best “thank you” 🙂
Useful links:
The content of this article reflects the author’s opinion and does not necessarily reflect the official position of LiteFinance broker. The material published on this page is provided for informational purposes only and should not be considered as the provision of investment advice for the purposes of Directive 2014/65/EU.
According to copyright law, this article is considered intellectual property, which includes a prohibition on copying and distributing it without consent.
The USD/JPY pair retreats from the 160.20 area, or a one-month high retested earlier this Monday, and, for now, seems to have snapped a five-day winning streak. Spot prices slide to the 159.80-159.75 region during the Asian session, though the downside potential seems limited.
A modest US Dollar (USD) downtick is seen as a key factor exerting some downward pressure on the USD/JPY pair amid rising bets for faster interest rate hikes by the Bank of Japan (BoJ). However, expectations that the US Federal Reserve (Fed) will raise borrowing costs next month, along with escalating US-Iran tensions, might hold back USD bears from placing aggressive bets.
Furthermore, the wide US-Japan interest rate gap, along with concerns about Japan’s worsening fiscal condition, should keep a lid on any meaningful appreciation for the Japanese Yen (JPY) and help limit losses for the USD/JPY pair. Hence, strong follow-through selling is needed to confirm that the recent recovery from the 155.25-155.20, or the monthly low, has run out of steam.
The USD/JPY pair retains a modest bullish bias above both the 100-period Simple Moving Average (SMA) on the 4-hour chart and the 50.0% Fibonacci retracement of the recent corrective decline from a four-decade high. Moreover, the Moving Average Convergence Divergence (MACD) indicator is marginally positive, while the Relative Strength Index (RSI) is around 59.
Momentum oscillators, in turn, hint that upside momentum is constructive but not yet stretched. The USD/JPY pair, however, likely remains capped by the 200-period SMA at 160.33. This is followed by a dense Fibonacci ceiling higher up – the 61.8% level at 16.62 and the 78.6% retracement at 162.09, which together outline the next bullish objectives if buyers extend the move.
On the downside, initial support appears at the 50.0% retracement at 159.58, with the 100-period SMA at 159.13 reinforcing the floor ahead of deeper Fibonacci cushions at 158.55 and 157.27. Only a drop toward the cycle low area near 155.20 would seriously undermine the current constructive outlook and pave the way for some meaningful downside for the USD/JPY pair.
(The technical analysis of this story was written with the help of an AI tool. Know more.)
The table below shows the percentage change of Japanese Yen (JPY) against listed major currencies this month. Japanese Yen was the strongest against the Swiss Franc.
| USD | EUR | GBP | JPY | CAD | AUD | NZD | CHF | |
|---|---|---|---|---|---|---|---|---|
| USD | -0.53% | -0.56% | 0.19% | -0.84% | -1.89% | -0.61% | 0.56% | |
| EUR | 0.53% | -0.05% | 0.70% | -0.29% | -1.37% | -0.09% | 1.09% | |
| GBP | 0.56% | 0.05% | 0.80% | -0.23% | -1.35% | -0.03% | 1.15% | |
| JPY | -0.19% | -0.70% | -0.80% | -0.98% | -2.21% | -0.99% | 0.32% | |
| CAD | 0.84% | 0.29% | 0.23% | 0.98% | -1.11% | -0.24% | 1.48% | |
| AUD | 1.89% | 1.37% | 1.35% | 2.21% | 1.11% | 1.33% | 2.54% | |
| NZD | 0.61% | 0.09% | 0.03% | 0.99% | 0.24% | -1.33% | 1.19% | |
| CHF | -0.56% | -1.09% | -1.15% | -0.32% | -1.48% | -2.54% | -1.19% |
The heat map shows percentage changes of major currencies against each other. The base currency is picked from the left column, while the quote currency is picked from the top row. For example, if you pick the Japanese Yen from the left column and move along the horizontal line to the US Dollar, the percentage change displayed in the box will represent JPY (base)/USD (quote).
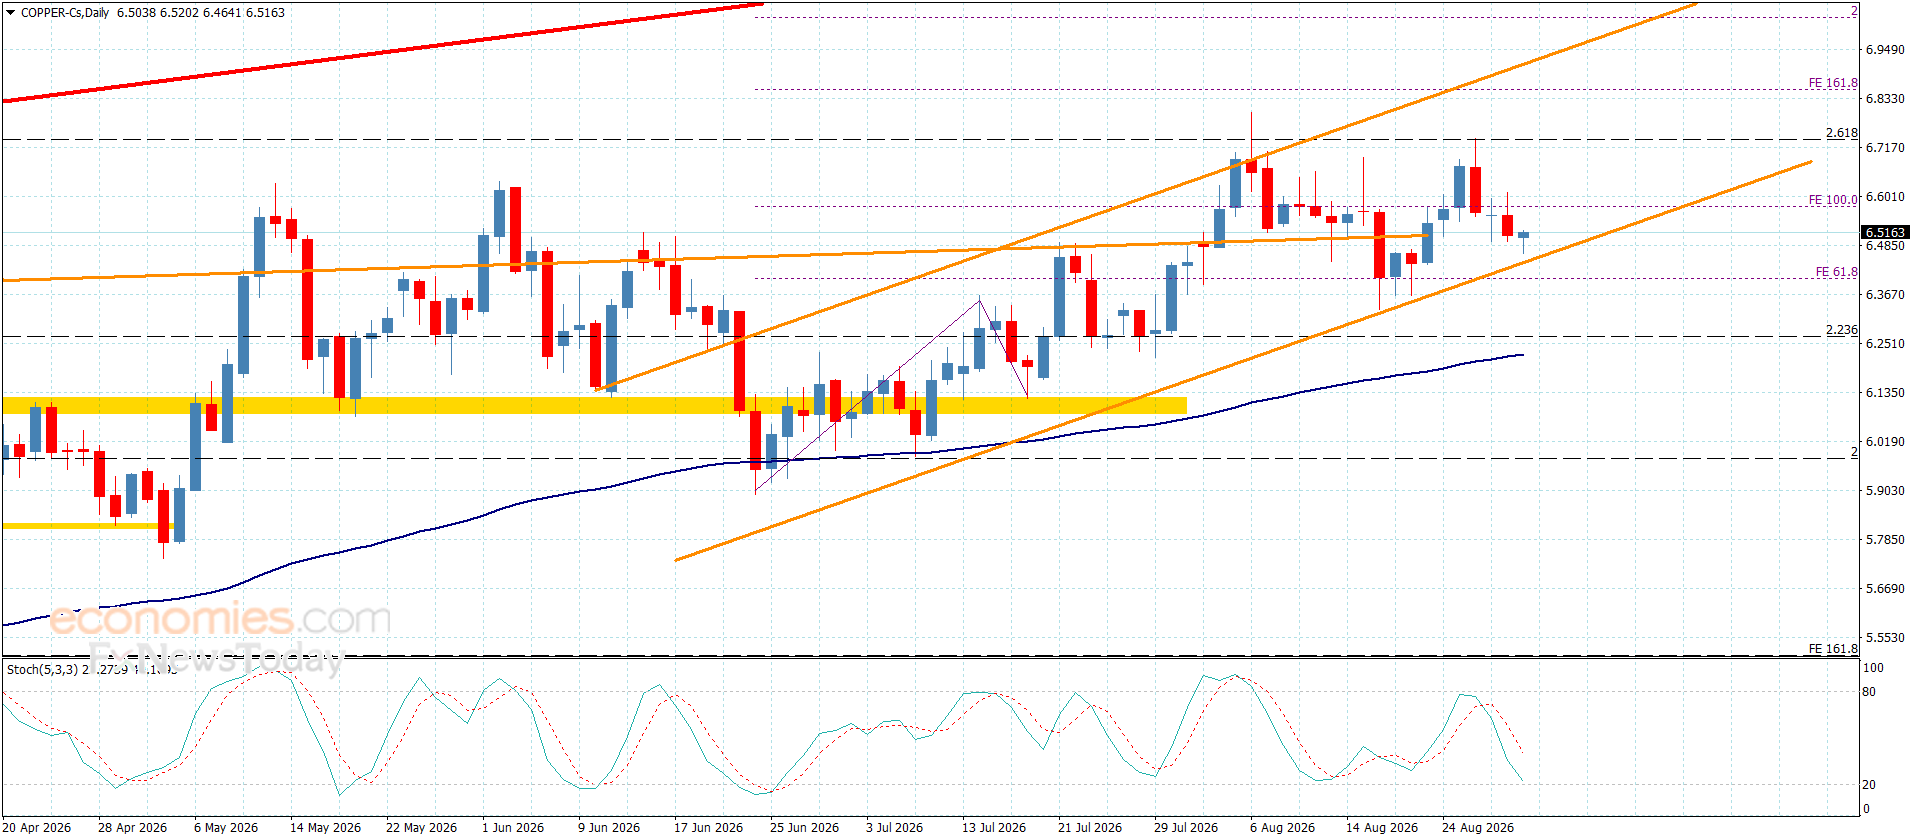
Despite Copper price neediness to the positive momentum in the last period, it didn’t affect its main bullish trend due to its stability above $6.3300 support, besides its attempt to settle above the bullish channel’s support at $6.4400.
The price needs a new bullish momentum to ease the mission of surpassing the barrier at $6.7400, to begin targeting new stations by its rally towards $6.8500 reaching $7.0200, while reaching below $6.3300 and providing a negative close will confirm its move to the negative track again, forcing it to suffer several losses by reaching $6.2000.
The expected trading range for today is between $6.4400 and $6.7400
Trend forecast: Bullish