The main category of Forex News.
You can use the search box below to find what you need.
[wd_asp id=1]
The main category of Forex News.
You can use the search box below to find what you need.
[wd_asp id=1]
– Written by
James Fuller
STORY LINK Pound-to-Dollar Forecast: Hawkish Warsh Boosts USD, GBP Retreats to 1.3530
The Pound to Dollar (GBP/USD) exchange rate came under renewed pressure at the end of last week as a hawkish Jackson Hole speech from Federal Reserve Chair Kevin Warsh strengthened expectations of another US interest-rate increase.
GBP/USD retreated to around 1.3535 on Friday, down almost 0.5% on the day and well below the six-month highs above 1.3670 recorded earlier in August.
The Pound was unable to make headway in global markets, while the Dollar received fresh support as investors reassessed the outlook for Federal Reserve policy.
There remains an important support area around 1.3500-1.3550.
Scotiabank had maintained a constructive technical stance; “We see near-term support around 1.3600 and 1.3550. The trend from late June remains bullish however.”
Friday’s move below 1.3550 therefore weakens the immediate technical picture, although GBP/USD remains above the broader summer lows.
Get better rates and lower fees on your next international money transfer.
Compare TorFX with top UK banks in seconds and see how much you could save.
Federal Reserve Chair Kevin Warsh used his first Jackson Hole speech to reinforce the central bank’s commitment to returning inflation to its 2% target.
Warsh warned that financial conditions remained relatively loose and indicated that the Fed could need to raise interest rates if inflation fails to moderate sufficiently.
His comments represented a more hawkish message than investors had expected.
Markets subsequently raised the probability of a September rate increase to around 55%, compared with roughly 35% ahead of the speech.
This shift in expectations provided renewed support for US bond yields and the Dollar.
Danske Bank had commented ahead of the speech; “Markets will look for any hints about monetary policy in September.”
The speech ultimately provided a clearer signal than many investors had anticipated.

ING had previously maintained that the Fed would remain on hold in September, but acknowledged that stronger data or more hawkish communication could change market pricing.
The coming US inflation and employment figures will now carry even greater importance.
Energy prices will continue to be an important backdrop for monetary policy on both sides of the Atlantic.
MUFG commented; “The price of crude oil continues to defy expectations of sharper price rises and how the energy price story plays out over the coming weeks will be an important backdrop heading into a heavy month of G10 central bank meetings.”
Every major G10 central bank is due to meet during September, leaving markets unusually sensitive to shifts in inflation expectations and bond yields.
Higher energy prices would strengthen the argument for tighter monetary policy, while a sustained decline would reduce pressure on central banks to act.
UK rate expectations have moved in the opposite direction to the US in recent sessions.
Markets no longer fully price another Bank of England rate increase until early 2027, with only a limited probability attached to a September move.
Most economists expect the BoE to keep Bank Rate unchanged at 3.75% for the remainder of 2026.
Wider US economic fundamentals also continue to provide some support for the Dollar.
Brown Brothers Harriman global head of markets strategy Elias Haddad commented; “The big support for the dollar here is that the U.S. economy continues to outpace that of other major economies.”
He nevertheless remains cautious over the medium-term outlook.
Haddad added; “I don’t expect the dollar to make new highs, because of the risk of a more dovish Fed repricing and the lack of U.S. fiscal credibility are two big headwinds.”
US fiscal concerns remain significant, particularly after the recent surge in long-term Treasury yields and the Treasury’s decision to expand bond buybacks.
European central bankers have also expressed unease over increasingly unconventional US Treasury actions and the risk that political pressure could spill over into monetary and currency policy.
GBP/USD has now surrendered most of the gains made during the middle of August.
The 1.3500-1.3530 area is the immediate support zone.
A sustained break below 1.3500 would weaken the short-term structure further and could expose 1.3450 followed by the August low around 1.3420.
On the upside, Sterling would need to regain 1.3600 to ease the immediate downward pressure.
A recovery above 1.3650 would be required to restore the stronger bullish structure seen earlier in August.
The combination of higher Fed rate expectations and weaker Bank of England tightening bets favours the Dollar, leaving upcoming US inflation and labour-market data crucial for the next GBP/USD move.
International Money Transfer? Ask our resident FX expert a money transfer question or try John’s new, free, no-obligation personal service! ,where he helps every step of the way,
ensuring you get the best exchange rates on your currency requirements.
TAGS: Pound Dollar Forecasts
The Pound to Dollar (GBP/USD) exchange rate ended Friday at 1.3534, down 0.46% after Kevin Warsh revived expectations for another Federal Reserve rate increase.
That leaves Cable well below its August high at 1.3675, but UBS has made no retreat from its bullish medium-term Sterling path.
Its updated forecast table reads: “GBP/USD: 1.40 Dec 2026, 1.41 Mar 2027, 1.41 Jun 2027, 1.41 Sep 2027.”
The rationale was set out more fully by UBS strategists Constantin Bolz and Dominic Schnider earlier this month.
“UK politics have shifted from a headwind to a potential tailwind,” they said, while “[Pound] Sterling remains relatively under-owned.”
That under-ownership matters if investors return after Friday’s Dollar-driven correction.
UBS has also argued that “long-dollar positioning remains vulnerable to a reversal”, creating scope for “existing long-dollar positions [to] be unwound” if Fed expectations soften again.
Friday went the other way.
Warsh pushed the implied probability of a September Fed hike from around 35% before his speech to 57.5%, while Sterling suffered its first weekly decline against the Dollar in more than a month.
We previously examined UBS’s increasingly positive Sterling view before the Jackson Hole reversal.
The forecast now has a cleaner test: holding around 1.35 would leave the 1.40 year-end scenario plausible, while renewed Fed tightening pressure would make the first hurdle, around 1.38, considerably harder to clear.
Our currency coverage draws on live market data, official economic releases and published bank research.
The US Dollar to Japanese Yen (USD/JPY) exchange rate closed Friday at 160.10, almost five Yen above the lows reached after the extraordinary joint US-Japan intervention.
That rebound is the uncomfortable backdrop to UniCredit’s question: “Is FX intervention a ‘losing game’? The JPY’s case.” The current analysis was published on 26 August.
UniCredit analysts had already made their underlying objection unusually clear before the joint operation.
“It would be a waste of FX reserves if the USD is already strong due to factors outside of Japan’s control,” the bank argued in earlier Yen analysis.
At the same time, UniCredit expected officials to keep trying: “We expect intervention to resume.”
The issue was never whether intervention could move USD/JPY for a few sessions.
It was whether intervention could overcome the interest-rate gap, expansionary Japanese fiscal policy and the economic damage from high imported energy costs.
Japan has now spent a record ¥15.4tn, around $96.5bn, intervening between 30 July and 26 August, yet Dollar-Yen finished August back above 160.
That outcome gives the “losing game” thesis more force.
As we noted in our recent Yen forecast, markets increasingly need the Bank of Japan to do part of the work itself.
A September rate increase could help.
Without a credible path towards further tightening, another intervention may again prove spectacular in the moment and frustratingly temporary afterwards.
Our currency coverage draws on live market data, official economic releases and published bank research.
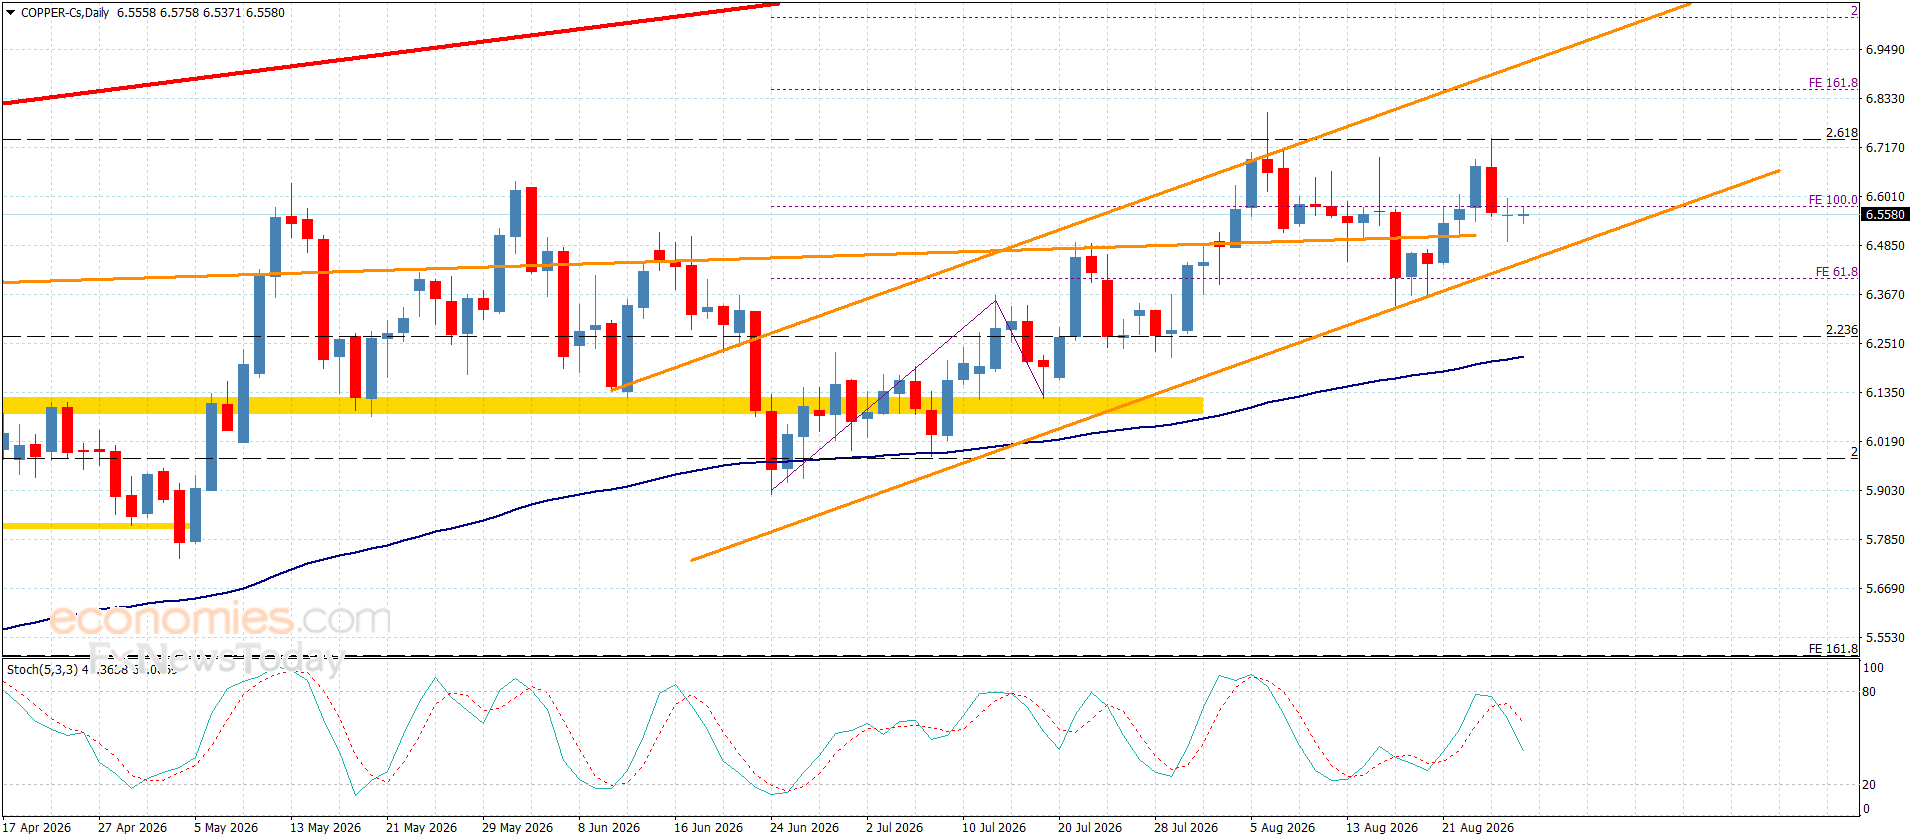
Copper price kept its stability above the minor bullish channel’s support at$6.4500, announcing the continuation of the previously suggested bullish scenario, the current sideways fluctuations are caused by the continuation of the main indicators’ contradiction, specifically by stochastic reach below 50 level.
Therefore, we expect to provide mixed sideways trading until gathering extra bullish momentum, to activate the bullish attempts by targeting $6.7400 initially, and surpassing it will extend the trading towards the extra targets near $6.8500 and $7.0200.
The expected trading range for today is between $6.5000 and $6.7400
Trend forecast: Bullish
The Euro to Dollar (EUR/USD) exchange rate ended Friday at 1.1582 after Kevin Warsh’s Jackson Hole speech triggered the Dollar’s strongest daily advance in more than two months.
The pair had spent most of the previous 48 hours between 1.1640 and 1.1660 before collapsing through 1.1600, leaving Friday’s close close to the bottom of the session range.
Rabobank still expects the broader picture to remain frustratingly two-sided rather than turn into a clean Dollar rally.
“We see scope for further choppy range trading in EUR/USD in the coming months with an upside bias likely lifting the currency pair to the 1.18 area into the spring.”
That forecast looks more interesting after Friday.
Warsh pushed the market-implied probability of a September Fed hike from around 35% to 57.5%, while EUR/USD fell roughly 0.6% to 1.1582.

Friday’s break lower interrupted what had been a surprisingly resilient August for the Euro, but Rabobank does not think the pair will be driven primarily by European developments from here.
“In view of the imbalance of uncertainties, we expect that price action in EUR/USD in the coming weeks will continue to be dominated by news pertaining to the USD rather than the EUR.”
Rabobank’s argument centres on an increasingly awkward relationship between the US Treasury and the Fed.
“Since the announcement last week that the US Treasury would at least double the size of its bond buyback operations, the market has been discussing the potential for a ‘Bessent put’ and how willing the US Treasury Secretary may be to stem a rise in long-term interest rates.”
The bank sees an obvious political incentive ahead of November’s mid-term elections, but also a cost.
“The market’s ability to signal concerns over fiscal policy, inflation and reflect a true balance between supply and demand could be dampened.”
“This has raised questions over the Treasury’s credibility, which have re-opened the debate about USD debasement.”
Lower long-term yields could also keep financial conditions looser than they otherwise would be, potentially leaving inflation higher for longer and increasing the prospect of tension between Treasury policy and the Fed.
That tension was visible even before Warsh spoke, with Reuters highlighting the contrast between Treasury efforts to push long yields down and the Fed Chair’s emphasis on maintaining inflation discipline.

The Eurozone hardly has an easy inflation outlook either.
Rabobank notes that headline inflation reached 3.2% earlier this year as the Iran-war energy shock fed into consumer prices, with the duration of the conflict still critical for the outlook.
Yet the bank sees one important difference.
“The market has a strong belief in the ECB’s inflation fighting credentials. The Fed’s credibility, by contrast, is still up for debate.”
Eurozone inflation expectations have remained relatively contained, while Rabobank expects another ECB hike in September after June’s increase.
The economy has also held up better than feared.
“Stronger than expected Eurozone Q2 GDP growth data and a decent round of August PMI numbers reflect an economy which has been resilient in the face of this year’s energy price shock.”
That resilience has not translated into aggressive Euro buying.
“The market has been reluctant to build long EUR positions against the backdrop of the Iran war in view of the Eurozone’s energy importer status and the headwinds to growth and inflation that this status implies.”
Hence Rabobank’s near-term conclusion is deliberately restrained.
“In the absence of an end to the war, we expect the EUR’s upside potential to remain contained and favour choppy range trading for EUR/USD around the 1.16 to 1.17 area in the months ahead.”
That 1.16 floor is already being tested after Warsh.
We noted in our previous Rabobank EUR/USD forecast that the bank had brought forward its 1.18 target as US debt-market concerns intensified.
Friday has not removed that forecast, but it has made the path rather less comfortable.
If Fed hike pricing continues to build, EUR/USD can spend more time below Rabobank’s preferred 1.16-1.17 zone.
If Treasury intervention again pulls long yields lower while confidence in US policy comes under pressure, the Dollar side of the equation could reverse quickly.
For Rabobank, that tug of war is the forecast: messy around 1.16-1.17 first, then a gradual move towards 1.18 into spring.
| USD | EUR | GBP | JPY | CAD | AUD | NZD | CHF | |
|---|---|---|---|---|---|---|---|---|
| USD | +0.82% | +0.82% | +0.70% | +0.99% | +0.12% | +1.13% | +1.01% | |
| EUR | -0.81% | 0.00% | -0.11% | +0.17% | -0.69% | +0.31% | +0.19% | |
| GBP | -0.81% | 0.00% | -0.11% | +0.17% | -0.69% | +0.32% | +0.19% | |
| JPY | -0.70% | +0.11% | +0.11% | +0.29% | -0.58% | +0.43% | +0.30% | |
| CAD | -0.98% | -0.17% | -0.17% | -0.29% | -0.86% | +0.14% | +0.02% | |
| AUD | -0.12% | +0.70% | +0.69% | +0.58% | +0.87% | +1.01% | +0.88% | |
| NZD | -1.12% | -0.31% | -0.31% | -0.43% | -0.14% | -1.00% | -0.13% | |
| CHF | -1.00% | -0.19% | -0.19% | -0.30% | -0.02% | -0.88% | +0.13% |
The FX heat map compares how Euro (EUR) has performed against a basket of major currencies over the past week. The largest move was against the US Dollar, where Euro recorded its sharpest decline. Data comparing prices today (29/08/2026 18:21 UTC) and daily close on 22/08/2026.
To read the table, choose the base currency from the left-hand column and then move across to the quote currency along the top row. For example, the GBP row and USD column shows the weekly percentage move in GBP/USD.
On the London exchange, robusta coffee futures for September 2026 delivery fell by $65 (-1.78%) to $3,588/ton; November 2026 delivery fell by $77/ton (-2.09%) to $3,614/ton; January 2027 delivery fell by $81/ton (-2.2%) to $3,598/ton. Prices for other contracts also decreased by $84/ton.
Similarly, on the New York exchange, the price of Arabica coffee for September 2026 delivery fell by 13.8 US cents/pound (-3.72%) to 357.6 US cents/pound; the price for December 2026 delivery fell by 13.35 US cents/pound (-3.98%) to 322.15 US cents/pound; and the March 2026 delivery price decreased by 13.15 US cents/pound (-4.09%) to 308.1 US cents/pound. Prices for other contracts fell by 12.65-13.1 cents/pound.
According to Barchart , coffee prices fell to a one-week low as improved prospects for Brazilian supply prompted investors to close out long positions following a sharp rise earlier. Robusta prices also came under pressure as inventories on ICE rose to a nine-month high.
The market is being affected by conflicting factors: improved prospects for future supply, while the availability of coffee for immediate delivery remains scarce. The shift in long-term supply expectations outweighed the short-term shortages during Wednesday’s session.
Harvesting progress in Brazil is improving, although it is still slower than the same period last year.
According to Cooxupé, one of Brazil’s largest coffee cooperatives, 87.5% of the harvest had been completed by August 21, up 6 percentage points from a week earlier but still lower than the 91.3% recorded at the same time last year.
Previously, Safras & Mercado, a Brazilian agricultural consulting and analysis company, stated that as of August 12th, the country’s 2026-2027 coffee crop was 90% complete, lower than the 97% at the same time last year and the five-year average of 94%. Arabica coffee alone reached 86% completion, compared to 95% a year earlier.
Traders also said that rainfall in Brazil is forecast to improve this week and next, creating favorable conditions for some coffee flowering. This could improve the supply outlook for the coming months.
However, coffee is still very scarce in the short term.
One clear indicator is that the spread between September and December arabica futures is currently around 36 cents/pound, reflecting supply constraints in the near-term futures contract.
Earlier, September arabica futures rose to a 7.5-month high as investors holding short positions worried that the amount of coffee available for the nearest-term contract would not be enough to meet demand.
The fact that investors had to close their short positions by buying back contracts contributed to the sharp price increase in previous sessions.
Another paradox is emerging in Brazil: many warehouses are nearly full, but the amount of coffee available for delivery on the exchange remains very low.
Reports that some warehouses in Brazil are no longer accepting new coffee shipments suggest that farmers have been delaying sales in anticipation of further price increases. However, as storage capacity shrinks, more of this coffee may have to be released onto the market, putting additional pressure on prices.
Meanwhile, certified arabica stocks on ICE continued to decline. The amount of arabica coffee meeting delivery standards fell to just 224,617 bags on Wednesday, the lowest level in 2.75 years and near a multi-year low.
Brokerage firm ADMIS believes that slow harvesting progress and issues with coffee bean quality in Brazil are limiting the amount of coffee that meets the standards for certification and storage on the exchange.
Reuters quoted Mike Nugent, a coffee consultant and broker, as saying that delivery notifications for the near-term futures contract are proceeding quite slowly, with only a few dozen notifications issued.
This development shows that “the fact that coffee is available somewhere does not mean that coffee is available here, right now, and in a form suitable for delivery.”
While arabica is supported by the scarcity of coffee meeting delivery standards, robusta is under more significant pressure from increasing inventories.
Robusta inventories on the ICE exchange rose to 4,943 lots on Tuesday, the highest level in nine months. Robusta fell 2.9% on Wednesday to $3,691 per ton, after surging as much as 5.1% on Monday.
The contrasting trends between the two types of coffee indicate that the market has different assessments of the supply situation for arabica and robusta.
In the long term, the supply outlook is becoming an increasingly important factor for coffee prices.
The reversal in the futures market structure suggests that traders expect supply to improve in the future, but remain uncertain about the pace at which coffee from producing countries is shipped to consuming markets.
According to a Reuters survey , arabica prices are projected to fall by 8.8% by the end of 2026, while the market surplus for the 2026-2027 crop year could increase to 8.2 million bags, up from just 1.7 million bags in the previous crop year.
Source: https://baoninhbinh.org.vn/gia-ca-phe-hom-nay-278-giam-manh-xuong-thap-nhat-mot-tuan-truoc-ky-vong-nguon-c-260827053432239.html
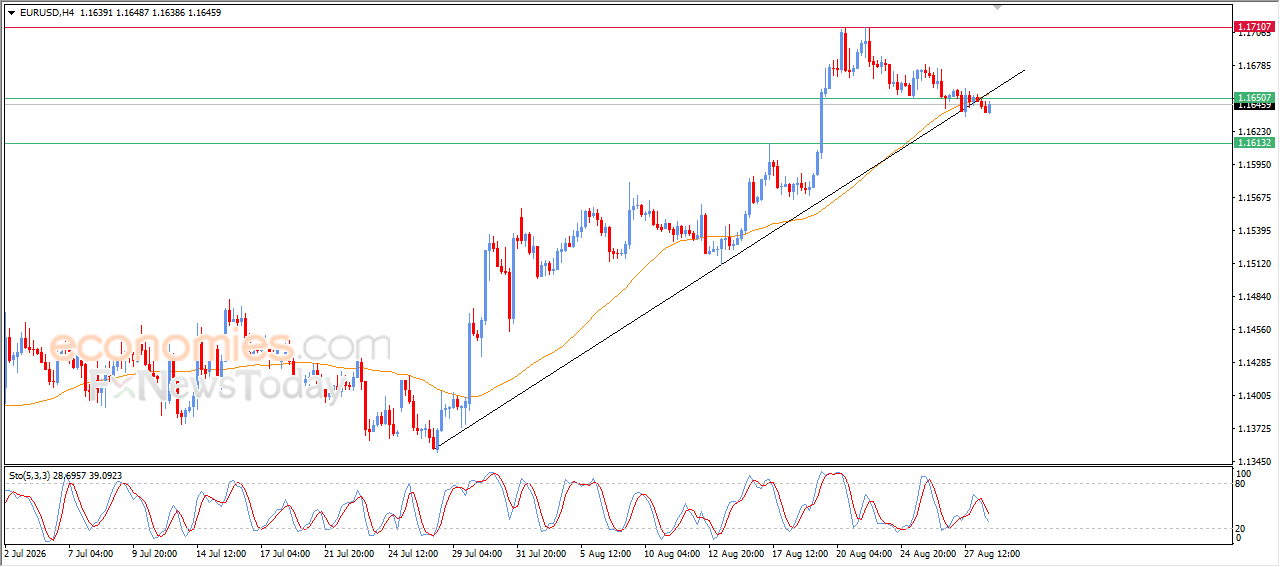
The EURUSD pair settles lower during its latest intraday trading, to break a main bullish trend on the short-term basis, accompanied by surpassing EMA50, which put it under negative pressure, suggesting more downside moves in the near upcoming period, especially with the emergence of the negative signals from the relative strength indicators.
The U.S. Dollar Index has almost reached 99.20 on the 4-hour chart as it has recovered from the 98.56 low and gone back above the 50-EMA, which is at 99.16, although the price is still below the 100-EMA and is still below the descending trendline, so the bullish structure on a short-term basis is still not fully in play.
The 99.25 pivot level is an important zone. This is close to the 61.8% Fibonacci level and is at 99.25. If this level is broken and successfully held above it, then the extension of the bullish structure would bring the price to at least 99.48, where it would then extend to 99.68 and 99.99. The next significant level would be 100.38, beyond which there is a clear price extension. If the price is not able to hold above this level, then 99.12 and 98.99, 98.82 and 98.56 would be the next support levels.
The RSI at this point is at 57 and is showing a bullish bias for the recovery and price structure. In my opinion, this is a critical level for the U.S. Dollar Index from a price structure point of view. A confirmed break above 99.25 and the descending trendline would suggest that a bullish structure is more likely, and a move back toward 98.99 to 98.82, with price extending below the trendline is likely.
Silver (XAG/USD) heads north for the second consecutive day on Friday, with all eyes on the Federal Reserve (Fed) Chairman Kevin Warsh’s speech at the Jackson Hole Symposium, due later on the day. The white metal extends gains to two-month highs a few cents below $71.00, after bouncing from the mid-range of the $67.00s on Thursday, on track to close a four-week rally.
Investors await Fed Warsh’s speech, eager for further insight about the central bank’s monetary policy, following the poor guidance provided at July’s monetary policy meeting. On Thursday, Kansas Fed President Jeffrey Schmidt and Cleveland Fed President Beth Hammack called for immediate monetary tightening, following hot US Personal Consumption Expenditures (PCE) Price Index figures the previous day.
XAG/USD trades at $70.44 with near-term price action showing a constructive bias from July’s trough below $55.00. Momentum indicators in the daily chart remain within positive territory, with the Relative Strength Index (14) at 66 approaching, but not yet at overbought levels, and the Moving Average Convergence Divergence (MACD) highlighting moderate bullish traction.
Bulls are likely to meet resistance at the mid-June highs between $71.35 and $71.55 ahead of the key resistance area at the 200-day Simple Moving Average (SMA), a closely watched indicator in FX markets, which is now lying at $72.50. A break above there would open the way toward the June 4 high near $75.00.
On the downside, Thursday’s low, at $67.63, is likely to provide support, ahead of a secondary floor near $63.25, which capped bears on August 18, and the August 6 low, near $60.90.
(The technical analysis of this story was written with the help of an AI tool. Know more.)
Silver is a precious metal highly traded among investors. It has been historically used as a store of value and a medium of exchange. Although less popular than Gold, traders may turn to Silver to diversify their investment portfolio, for its intrinsic value or as a potential hedge during high-inflation periods. Investors can buy physical Silver, in coins or in bars, or trade it through vehicles such as Exchange Traded Funds, which track its price on international markets.
Silver prices can move due to a wide range of factors. Geopolitical instability or fears of a deep recession can make Silver price escalate due to its safe-haven status, although to a lesser extent than Gold’s. As a yieldless asset, Silver tends to rise with lower interest rates. Its moves also depend on how the US Dollar (USD) behaves as the asset is priced in dollars (XAG/USD). A strong Dollar tends to keep the price of Silver at bay, whereas a weaker Dollar is likely to propel prices up. Other factors such as investment demand, mining supply – Silver is much more abundant than Gold – and recycling rates can also affect prices.
Silver is widely used in industry, particularly in sectors such as electronics or solar energy, as it has one of the highest electric conductivity of all metals – more than Copper and Gold. A surge in demand can increase prices, while a decline tends to lower them. Dynamics in the US, Chinese and Indian economies can also contribute to price swings: for the US and particularly China, their big industrial sectors use Silver in various processes; in India, consumers’ demand for the precious metal for jewellery also plays a key role in setting prices.
Silver prices tend to follow Gold’s moves. When Gold prices rise, Silver typically follows suit, as their status as safe-haven assets is similar. The Gold/Silver ratio, which shows the number of ounces of Silver needed to equal the value of one ounce of Gold, may help to determine the relative valuation between both metals. Some investors may consider a high ratio as an indicator that Silver is undervalued, or Gold is overvalued. On the contrary, a low ratio might suggest that Gold is undervalued relative to Silver.
The article covers the following subjects:
Consider long positions from corrections above 1.3516 with a target of 1.3870–1.4140.
Breakout and consolidation below 1.3516 will allow the pair to continue declining to the levels of 1.3275–1.3140.
On the weekly time frame, an ascending wave of larger degree (A) of B is developing. Within it, wave 1 of (A) has formed, a downward correction has been completed as wave 2 of (A), and the third wave 3 of (А) is unfolding. Apparently, the third wave iii of 3 is developing on the daily time frame, within which a local correction has formed as wave (ii) of iii. Wave (iii) of iii is developing on the H4 chart, with wave iii of (iii) unfolding as its part. If the presumption is correct, GBP/USD will continue to rise to 1.3870–1.4140. The level of 1.3516 is critical in this scenario as a breakout below it will enable the pair to continue declining to the levels of 1.3275–1.3140.
This forecast is based on the Elliott Wave Theory. When developing trading strategies, it is essential to consider fundamental factors, as the market situation can change at any time.
The content of this article reflects the author’s opinion and does not necessarily reflect the official position of LiteFinance broker. The material published on this page is provided for informational purposes only and should not be considered as the provision of investment advice for the purposes of Directive 2014/65/EU.
According to copyright law, this article is considered intellectual property, which includes a prohibition on copying and distributing it without consent.