The main category of Forex News.
You can use the search box below to find what you need.
[wd_asp id=1]
The main category of Forex News.
You can use the search box below to find what you need.
[wd_asp id=1]

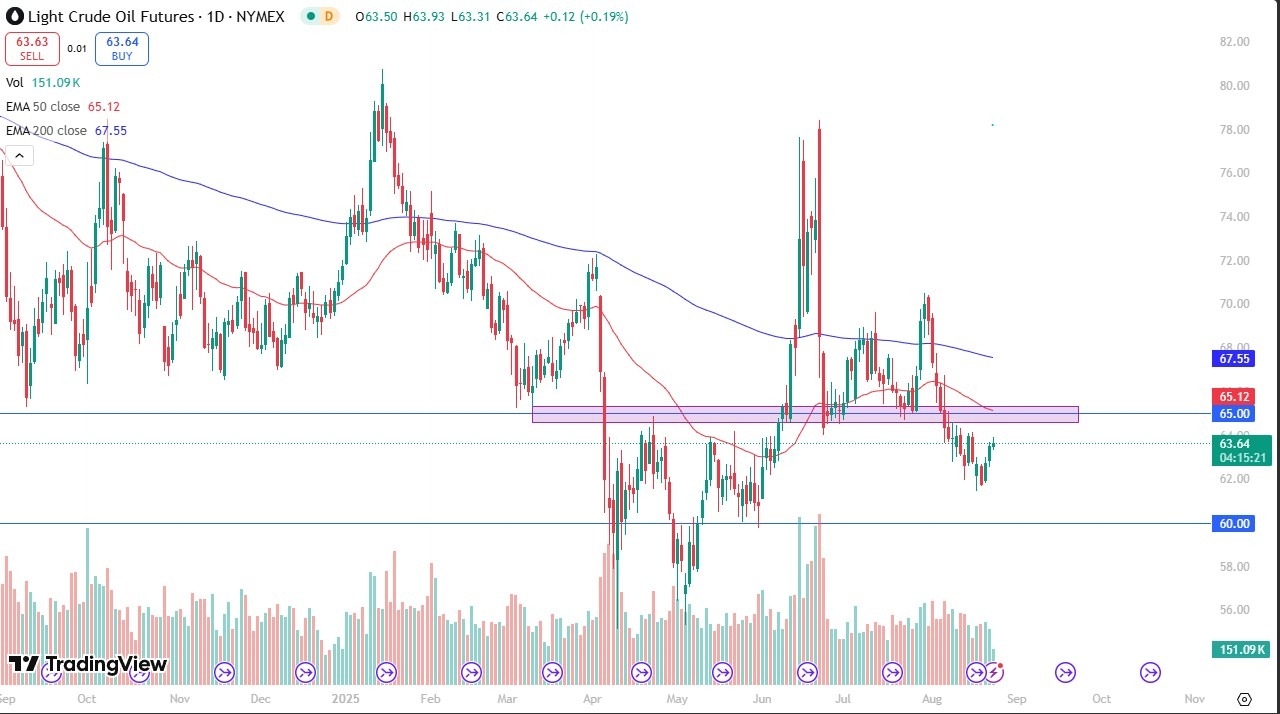
Keep in mind that the $65 level continues to be important from both a psychological standpoint, and of course from a “market memory” standpoint. It’s an area where we have seen a lot of support and resistance previously, and we do have the 50 Day EMA sitting right there as well offering resistance. If we can break above there, then the market is likely to take off toward the 200 Day EMA. On the other hand, if we reach their and show signs of exhaustion, I have no issues whatsoever in shorting the crude oil market, because there are a lot of things working against it. On a break down below the $62 level, it’s likely that WTI Crude will drop to the $60 handle.
Keep in mind that oversupply is going to continue to be a major issue here, as OPEC, Russia, and the United States are all producing massive amounts of crude oil at the moment. In fact, OPEC is set to add another 500,000 barrels to the market next month, meaning that it’s going to be very difficult for crude oil to hang on to any pricing power. This isn’t to say that we are suddenly going to fall apart and that crude oil is going to zero, but it wasn’t that long ago we had major issues with storage capacity, driving the futures markets to negative numbers. While I don’t necessarily look for that, we certainly have seen what this oversupply of crude can do to trading houses who find themselves suddenly on the hook to take delivery of something that can’t store. I think oil has plenty of headwinds at the moment.
Ready to trade daily crude oil price analysis? We’ve shortlisted the best Forex Oil trading brokers in the industry for you.
Christopher Lewis has been trading Forex and has over 20 years experience in financial markets. Chris has been a regular contributor to Daily Forex since the early days of the site. He writes about Forex for several online publications, including FX Empire, Investing.com, and his own site, aptly named The Trader Guy. Chris favours technical analysis methods to identify his trades and likes to trade equity indices and commodities as well as Forex. He favours a longer-term trading style, and his trades often last for days or weeks.
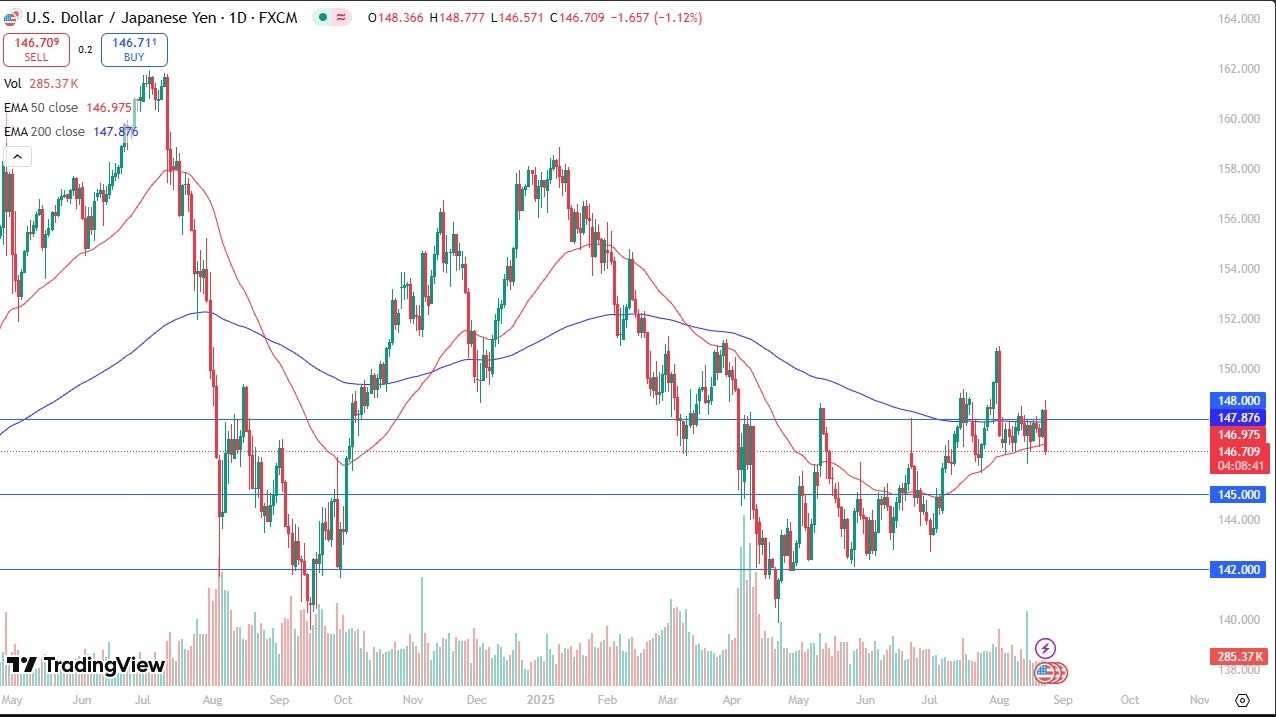
That being said, you have to be careful with these moves, because quite often, the initial “knee-jerk reaction” isn’t necessarily the correct one. After all, despite the fact that we have fallen rather significantly, we are basically just at the bottom of the consolidation area that we have been in for 2 weeks. The question then is whether or not this will change things? I don’t know if it will, I think it’s a little too early to make that determination, especially considering that even if the Federal Reserve were to cut twice this year, as the Fed Funds Futures markets expect, you are still talking about an interest rate differential that is wide enough to drive a truck through.
I’m watching the ¥149 level very closely, because if we were to break above there, then it would be very poor for the Japanese yen. Conversely, if we break down below the ¥146 level, then I think the US dollar could drop to the ¥145 level. Anything underneath there opens up the possibility of the ¥142 level being targeted.
Do not get me wrong, the candlestick is very ugly and could lead to something quite drastic. However, a couple of weeks ago we had a massive bearish engulfing candlestick that was followed up by nothing but sideways action. This is a very choppy and erotic currency pair, so make sure that you are careful with your position size.
Want to trade our USD/JPY forex analysis and predictions? Here’s a list of forex brokers in Japan to check out.
Christopher Lewis has been trading Forex and has over 20 years experience in financial markets. Chris has been a regular contributor to Daily Forex since the early days of the site. He writes about Forex for several online publications, including FX Empire, Investing.com, and his own site, aptly named The Trader Guy. Chris favours technical analysis methods to identify his trades and likes to trade equity indices and commodities as well as Forex. He favours a longer-term trading style, and his trades often last for days or weeks.
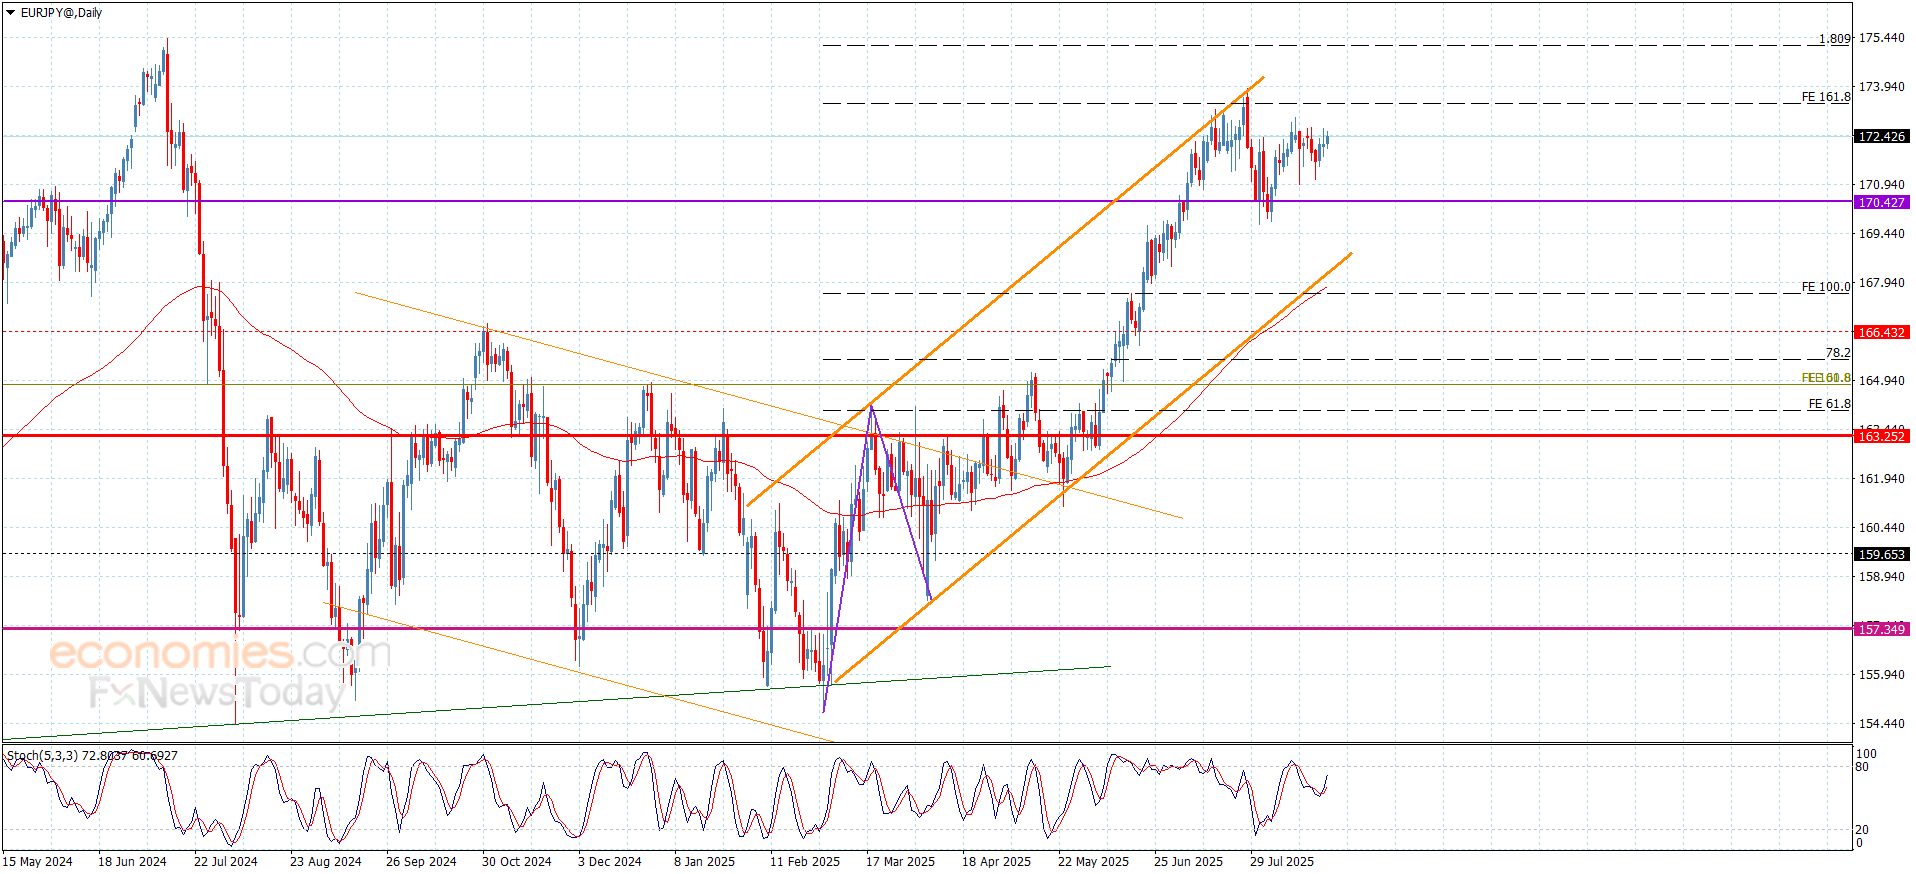
The EURJPY pair continued providing weak sideways trading by its repeated fluctuation near 172.00 level, reducing its effect as an extra barrier, taking advantage of providing positive momentum by stochastic rally above 50 level.
Reminding you that resuming the bullish attack requires forming several strong bullish waves, to reach the resistance at 173.40, to begin recording new gains by its rally towards 174.10, reaching the main target at 175.15.
The expected trading range for today is between 171.70 and 173.40
Trend forecast: Bullish
EUR/USD gained 1% on Friday and touched its highest level since late July near 1.1750. The pair corrects lower to start the new week and trades at around 1.1700.
The table below shows the percentage change of Euro (EUR) against listed major currencies last 7 days. Euro was the strongest against the New Zealand Dollar.
| USD | EUR | GBP | JPY | CAD | AUD | NZD | CHF | |
|---|---|---|---|---|---|---|---|---|
| USD | 0.10% | 0.35% | 0.07% | 0.10% | 0.23% | 0.94% | -0.39% | |
| EUR | -0.10% | 0.25% | -0.02% | -0.01% | 0.14% | 0.81% | -0.49% | |
| GBP | -0.35% | -0.25% | -0.36% | -0.25% | -0.10% | 0.56% | -0.78% | |
| JPY | -0.07% | 0.02% | 0.36% | 0.03% | 0.16% | 0.88% | -0.48% | |
| CAD | -0.10% | 0.01% | 0.25% | -0.03% | 0.11% | 0.85% | -0.52% | |
| AUD | -0.23% | -0.14% | 0.10% | -0.16% | -0.11% | 0.66% | -0.67% | |
| NZD | -0.94% | -0.81% | -0.56% | -0.88% | -0.85% | -0.66% | -1.36% | |
| CHF | 0.39% | 0.49% | 0.78% | 0.48% | 0.52% | 0.67% | 1.36% |
The heat map shows percentage changes of major currencies against each other. The base currency is picked from the left column, while the quote currency is picked from the top row. For example, if you pick the Euro from the left column and move along the horizontal line to the US Dollar, the percentage change displayed in the box will represent EUR (base)/USD (quote).
The US Dollar (USD) came under heavy selling pressure heading into the weekend and fuelled EUR/USD’s rally.
While delivering a speech on “Economic Outlook and Framework Review” at the annual Jackson Hole Economic Symposium on Friday, Federal Reserve (Fed) Chair Jerome Powell announced that they will adopt a new policy framework of flexible inflation targeting and eliminate ‘makeup’ strategy for inflation.
Commenting on the economic outlook, Powell acknowledged that downside risks to the labor market were rising and added that inflation effects of tariffs could be short-lived. The USD Index turned south and fell nearly 1% on Friday, reflecting the broad-based USD weakness.
On Monday, the data from Germany showed that the German IFO Business Climate Index rose to 89 in August from 88.6 in July, beating the market forecast of 88.6. On a negative note, the Current Economic Assessment Index edged lower to 86.4 from 86.5. Finally, the Expectations Index climbed to 91.6 from 90.7 in this period. These mixed figures don’t seem to be having a noticeable impact on the Euro’s valuation.
In the second half of the day, July New Home Sales will be the only data featured in the US economic calendar. In the meantime, US stock index futures lose between 0.1% and 0.2% in the early European session.
In case markets remain risk-averse in the second half of the day, EUR/USD could find it difficult to regain its traction. On the other hand, an improving risk mood is likely to weigh on the USD and open the door for another leg higher in the pair.
The Relative Strength Index (RSI) indicator on the 4-hour chart stays slightly above 60 and EUR/USD trades comfortably above the 20-period, 50-period, 100-period and the 200-period Simple Moving Averages (SMAs), highlighting a bullish stance in the near term.
On the upside, 1.1720 (static level) aligns as the immediate resistance level before 1.1760 (static level) and 1.1790-1.1800 (static level, round level). Looking south, support levels could be spotted at 1.1670 (50-period SMA), 1.1640 (100-period SMA, 200-period SMA) and 1.1600 (static level, round level).
The Euro is the currency for the 19 European Union countries that belong to the Eurozone. It is the second most heavily traded currency in the world behind the US Dollar. In 2022, it accounted for 31% of all foreign exchange transactions, with an average daily turnover of over $2.2 trillion a day.
EUR/USD is the most heavily traded currency pair in the world, accounting for an estimated 30% off all transactions, followed by EUR/JPY (4%), EUR/GBP (3%) and EUR/AUD (2%).
The European Central Bank (ECB) in Frankfurt, Germany, is the reserve bank for the Eurozone. The ECB sets interest rates and manages monetary policy.
The ECB’s primary mandate is to maintain price stability, which means either controlling inflation or stimulating growth. Its primary tool is the raising or lowering of interest rates. Relatively high interest rates – or the expectation of higher rates – will usually benefit the Euro and vice versa.
The ECB Governing Council makes monetary policy decisions at meetings held eight times a year. Decisions are made by heads of the Eurozone national banks and six permanent members, including the President of the ECB, Christine Lagarde.
Eurozone inflation data, measured by the Harmonized Index of Consumer Prices (HICP), is an important econometric for the Euro. If inflation rises more than expected, especially if above the ECB’s 2% target, it obliges the ECB to raise interest rates to bring it back under control.
Relatively high interest rates compared to its counterparts will usually benefit the Euro, as it makes the region more attractive as a place for global investors to park their money.
Data releases gauge the health of the economy and can impact on the Euro. Indicators such as GDP, Manufacturing and Services PMIs, employment, and consumer sentiment surveys can all influence the direction of the single currency.
A strong economy is good for the Euro. Not only does it attract more foreign investment but it may encourage the ECB to put up interest rates, which will directly strengthen the Euro. Otherwise, if economic data is weak, the Euro is likely to fall.
Economic data for the four largest economies in the euro area (Germany, France, Italy and Spain) are especially significant, as they account for 75% of the Eurozone’s economy.
Another significant data release for the Euro is the Trade Balance. This indicator measures the difference between what a country earns from its exports and what it spends on imports over a given period.
If a country produces highly sought after exports then its currency will gain in value purely from the extra demand created from foreign buyers seeking to purchase these goods. Therefore, a positive net Trade Balance strengthens a currency and vice versa for a negative balance.
The (silver) price declined in its last intraday trading, after it succeeded in breaching the current resistance at $38.70, gathering the gains of its rises, attempting to gain bullish momentum that might help it to recover and rise again, and it attempts to offload some of its clear overbought conditions on the (RSI), especially with the emergence of negative overlapping signals from there, amid the continuation of the positive support that comes from its trading above EMA50, and under the dominance of the main bullish trend and its trading alongside a minor supportive line for this trend on the near-term basis.
BestTradingSignal.com – Professional Trading Signals with high accuracy. Subscribe now to tailored packages for the world’s leading markets and receive signals instantly via Telegram from an expert team:
Check full VIP signals performance report for the week of August 18–22, 2025: Full Report
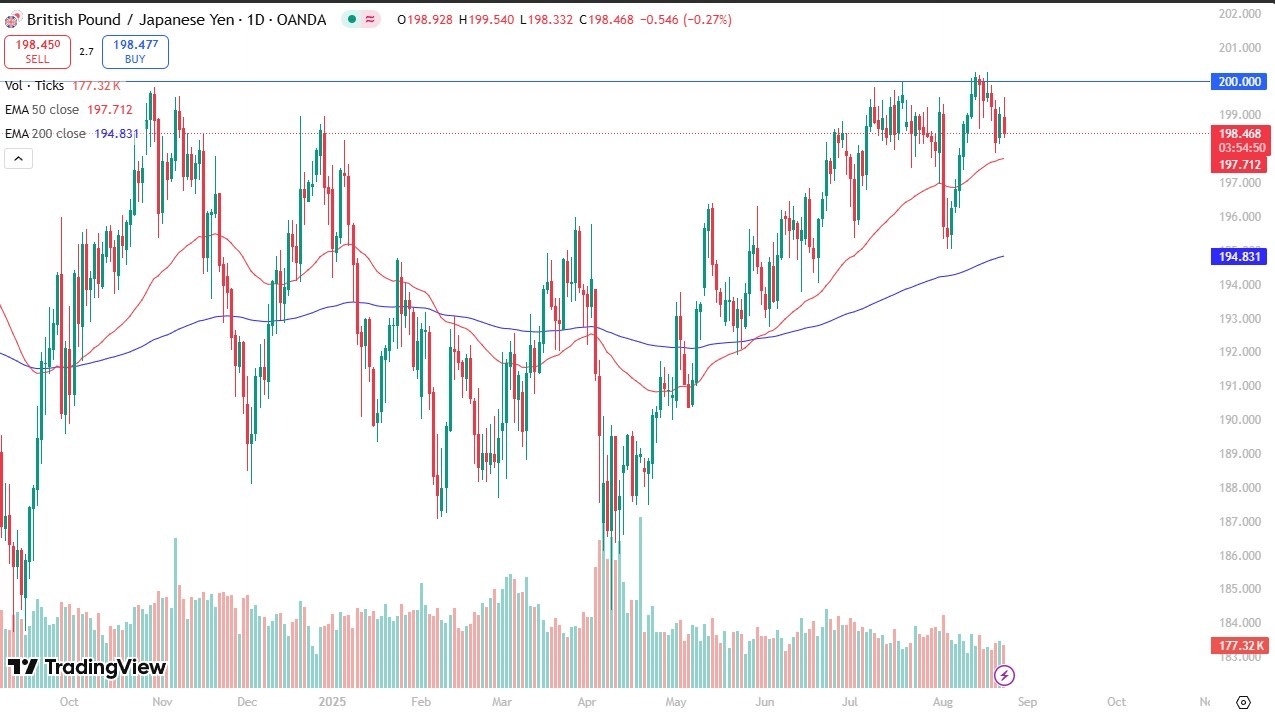
However, this is a little bit different in the situation because this should be moving higher with risk appetite increasing. Granted, the latest move to the upside has slammed into the 200 yen level again, which looks like it’s a brick wall. Underneath current levels, we have the 50 day EMA near the 198.40 yen level, which is rising and has for the most part acted like a bit of a trend line since the middle of May.
The question now is whether or not buyers will come back in and try to pick up value. The interest rate differential most certainly favors the British pound against the Japanese yen. But I find this move a little bit concerning due to the fact that it’s not moving how you would anticipate. Granted, the Japanese yen got a boost against the US dollar after that Jerome Powell speech, maybe this is a temporary thing. Obviously, if we can break above the 200 day EMA, then I think we could really go much higher, probably 204 yen, possibly even 208 yen.
If we drop from here and break down below the 50 day EMA, we could be looking at a move down to the 195 yen level. Perhaps traders are worried about the global economy slowing down. Maybe that’s what they got out of the Powell speech. If that’s the case, then a fall from this level would make quite a bit of sense as it is remarkable resistance as well. And of course, you could see a flood to safety assets. This is a pair that’s worth watching.
Begin trading our daily forecasts and analysis. Here is a list of Forex brokers in Japan to work with.
Christopher Lewis has been trading Forex and has over 20 years experience in financial markets. Chris has been a regular contributor to Daily Forex since the early days of the site. He writes about Forex for several online publications, including FX Empire, Investing.com, and his own site, aptly named The Trader Guy. Chris favours technical analysis methods to identify his trades and likes to trade equity indices and commodities as well as Forex. He favours a longer-term trading style, and his trades often last for days or weeks.
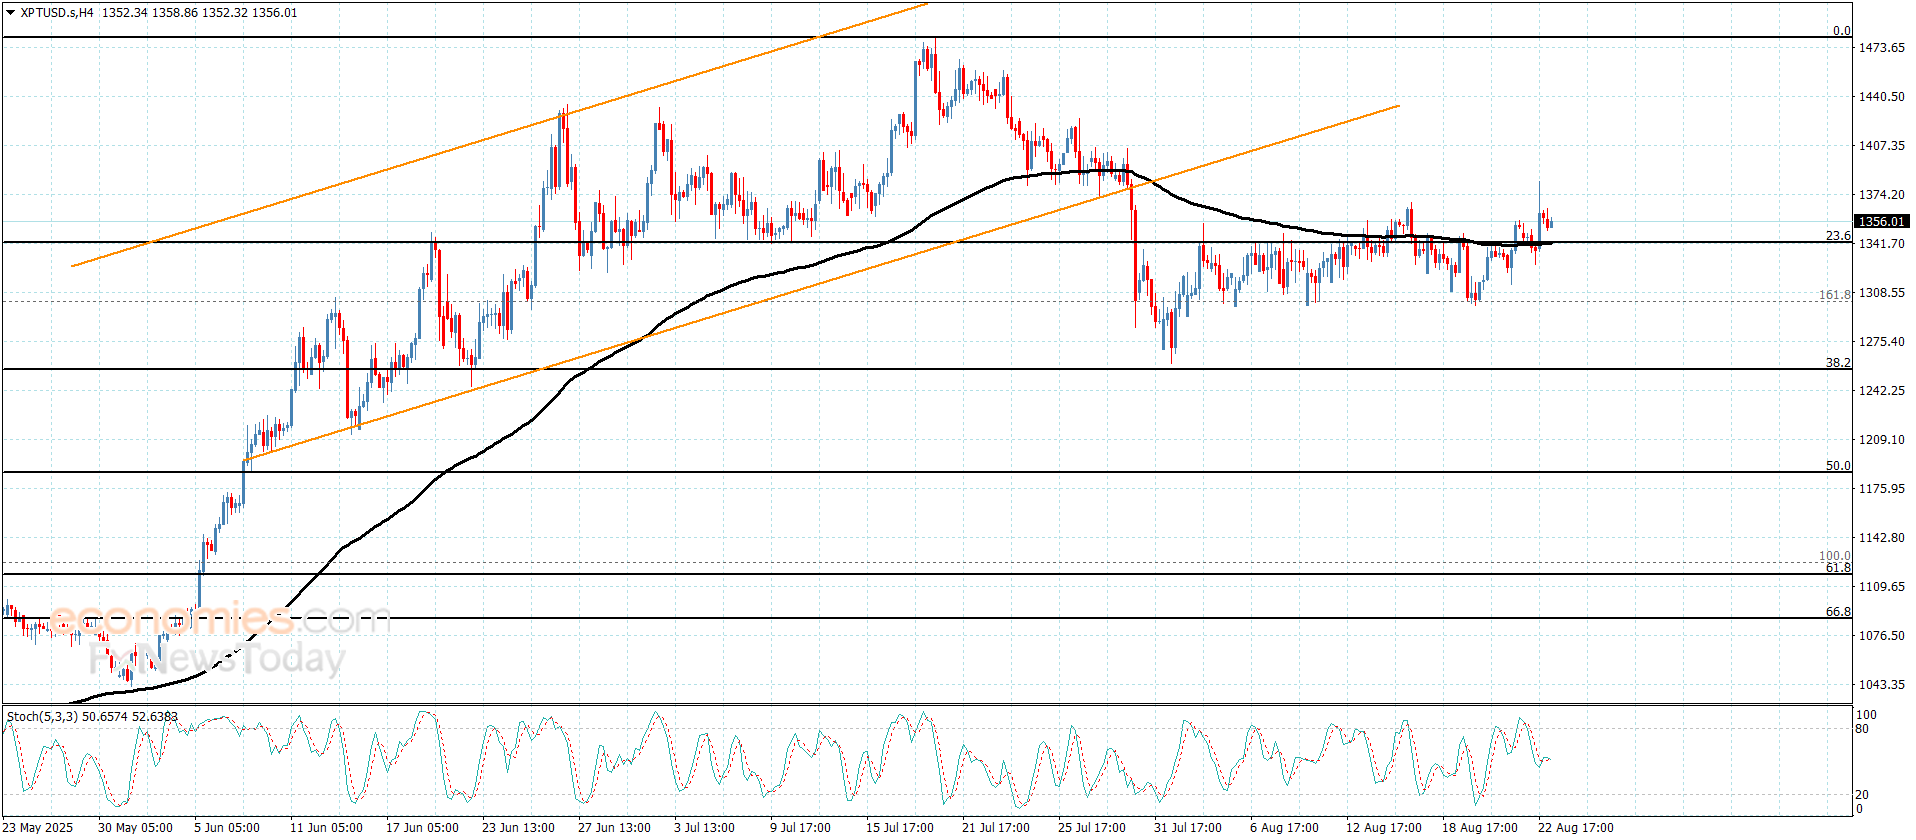
Platinum price took advantage of its repeated positive stability above the breached obstacle level at $1342.00, besides providing positive momentum by the main indicators, achieving the suggested targets by hitting $1383.60, to force it to provide some sideways trading by its fluctuation near $1355.00.
By the above image, we notice the stability of the moving average 55 near $1342.00 level, reinforcing the chances for forming an important extra support level, increasing the efficiency of the bullish track, to expect reaching $1383.00 and surpassing it will form the next main target for the bullish track at $1420.00 level.
The expected trading range for today is between $1340.00 and $1383.00
Trend forecast: Bullish
Platinum price took advantage of its repeated positive stability above the breached obstacle level at $1342.00, besides providing positive momentum by the main indicators, achieving the suggested targets by hitting $1383.60, to force it to provide some sideways trading by its fluctuation near $1355.00.
By the above image, we notice the stability of the moving average 55 near $1342.00 level, reinforcing the chances for forming an important extra support level, increasing the efficiency of the bullish track, to expect reaching $1383.00 and surpassing it will form the next main target for the bullish track at $1420.00 level.
The expected trading range for today is between $1340.00 and $1383.00
Trend forecast: Bullish
The Gold price (XAU/USD) edges lower to around $3,365 during the early Asian session on Monday, pressured by a firmer US Dollar (USD). Nonetheless, rising optimism of a September rate cut following comments by Federal Reserve (Fed) Chair Jerome Powell at the Jackson Hole symposium might cap the downside for the yellow metal.
The Fed’s Powell has opened the door to a rate reduction in the September meeting, but that position could become complicated if inflation pressures continue to rise. Powell added that the US economy is facing a “challenging situation,” with inflation risks now tilted to the upside and employment risks to the downside.
Traders are now pricing in nearly an 85% possibility of a 25 basis points (bps) rate cut next month, up from 75% before the speech, according to the CME FedWatch tool. Dovish remarks from Powell could provide some support to the precious metal, as lower interest rates could reduce the opportunity cost of holding Gold.
Additionally, the escalating tensions between Russia and Ukraine might contribute to the gold’s upside. Ukrainian President Volodymyr Zelensky said that the country would continue to fight for its freedom “while its calls for peace are not heard,” in a defiant address to the nation on its independence day, per BBC. His comments came after Moscow said Ukraine had attacked Russian power and energy facilities overnight, blaming drone attacks for a fire at a nuclear power plant in its western Kursk region.
Gold traders will keep an eye on the preliminary reading of the US Gross Domestic Product (GDP) for the second quarter (Q2), which will be released later on Thursday. The US economy is expected to grow at an annual rate of 3.0% in Q2. In case of a stronger-than-expected outcome, this could boost the Greenback and weigh on the USD-denominated commodity price.
Gold has played a key role in human’s history as it has been widely used as a store of value and medium of exchange. Currently, apart from its shine and usage for jewelry, the precious metal is widely seen as a safe-haven asset, meaning that it is considered a good investment during turbulent times. Gold is also widely seen as a hedge against inflation and against depreciating currencies as it doesn’t rely on any specific issuer or government.
Central banks are the biggest Gold holders. In their aim to support their currencies in turbulent times, central banks tend to diversify their reserves and buy Gold to improve the perceived strength of the economy and the currency. High Gold reserves can be a source of trust for a country’s solvency. Central banks added 1,136 tonnes of Gold worth around $70 billion to their reserves in 2022, according to data from the World Gold Council. This is the highest yearly purchase since records began. Central banks from emerging economies such as China, India and Turkey are quickly increasing their Gold reserves.
Gold has an inverse correlation with the US Dollar and US Treasuries, which are both major reserve and safe-haven assets. When the Dollar depreciates, Gold tends to rise, enabling investors and central banks to diversify their assets in turbulent times. Gold is also inversely correlated with risk assets. A rally in the stock market tends to weaken Gold price, while sell-offs in riskier markets tend to favor the precious metal.
The price can move due to a wide range of factors. Geopolitical instability or fears of a deep recession can quickly make Gold price escalate due to its safe-haven status. As a yield-less asset, Gold tends to rise with lower interest rates, while higher cost of money usually weighs down on the yellow metal. Still, most moves depend on how the US Dollar (USD) behaves as the asset is priced in dollars (XAU/USD). A strong Dollar tends to keep the price of Gold controlled, whereas a weaker Dollar is likely to push Gold prices up.
See today’s full USD/JPY forecast with chart setups and trade ideas.
Turning to the AUD/USD pair, the RBA cut interest rates this month as inflation cooled. A further easing in inflation could boost expectations of further policy easing in the fourth quarter. On Wednesday, August 27, the Monthly CPI Indicator may affect demand for the Aussie dollar. Economists expect the annual inflation rate to rise from 1.9% in June to 2.2% in July.
A higher-than-expected reading could temper expectations of a Q4 RBA rate cut, lifting the appetite for the Aussie dollar. Conversely, a softer inflation print may bolster bets on further policy easing. This week’s inflation data could be crucial for the AUD/USD pair given Fed Chair Powell’s policy pivot on Friday, August 22. AUD/USD rallied 1.09% to close the session at $0.64898 on Powell hinting at a September rate cut.
When do economists expect the RBA to ease policy further?
AMP Head of Investment Strategy and Chief Economist Shane Oliver projected a November rate cut and further policy easing in H1 2026, stating:
“We continue to see the RBA cutting rates again in November, February and May taking the cash rate down to 2.85%.”
AUD/USD: Key Scenarios to Watch
Explore our full AUD/USD analysis, including key trends and trade data, here.
While economists are betting on a November RBA rate cut, support for a September Fed rate cut sent AUD/USD toward $0.65.
Weaker-than-expected US economic data could raise expectations of multiple Fed rate cuts, narrowing the rate differential. A narrower rate differential may push the pair above the 50-day EMA. A break above the 50-day EMA and the $0.65 level may pave the way to the $0.6550 suppot level.
Conversely, stronger-than-expected data could signal a less dovish Fed rate path, potentially widening the rate differential. Under this scenario, AUD/USD could fall toward the 200-day EMA and the $0.6450 support level.
Beyond the data, traders should monitor FOMC members’ comments on the economy, inflation, and monetary policy.