The main category of Forex News.
You can use the search box below to find what you need.
[wd_asp id=1]
The main category of Forex News.
You can use the search box below to find what you need.
[wd_asp id=1]
Gold (XAU/USD) has decoupled from traditional supply-demand commodity dynamics, with pricing power increasingly concentrated in the hands of conviction buyers. Goldman Sachs research shows that roughly 70 percent of monthly price swings in gold are explained not by mine output but by central bank accumulation, ETF flows, and speculative positioning. A single block of 100 tonnes of net purchases by these conviction players can directly add upward pressure to gold’s price. This marks a sharp departure from oil or natural gas where higher prices typically spur new supply. In gold, higher prices rarely trigger liquidation because emerging-market households seldom sell, and mine production remains broadly inelastic regardless of price.
Central banks have transitioned from net sellers into structural buyers of gold, a reversal that accelerated after the global financial crisis and intensified following the freezing of Russia’s reserves in 2022. The reasoning is simple: gold held domestically cannot be seized, unlike foreign-held reserves. Emerging-market monetary authorities from Asia to Latin America have multiplied their gold holdings fivefold since then, altering the historical correlation between interest rates and bullion. This shift explains why gold prices have continued to rise despite intermittent ETF outflows, with sovereign demand overwhelming private selling.
The latest catalyst came from Federal Reserve Chair Jerome Powell’s speech at Jackson Hole. By explicitly recognizing labor-market weakness and stating that the balance of risks had shifted, Powell sent markets scrambling to reprice policy expectations. September rate cut odds surged from 72 percent to 91 percent within hours. Gold reacted instantly, rallying 1.07 percent to close the week at $3,371.23, marking a $35.53 daily gain and reclaiming bullish momentum after bouncing from the key pivot at $3,310.48. The U.S. Dollar Index closed at 97.732, down 0.11 percent, while the 10-year Treasury yield fell to 4.256 percent, removing critical headwinds and reinforcing gold’s breakout attempt.
The confirmation of $3,310 as weekly support has shifted traders’ attention to the resistance cluster at $3,409.43. A weekly close above that opens the path toward $3,439, $3,451, and the record peak at $3,500.20. Momentum indicators confirm the bullish undertone, yet sellers remain active around $3,400 where psychological resistance is strongest. If profit-taking triggers a pullback, dip buyers are expected to defend the 50-day moving average near $3,350, followed by the 20-day at $3,345 and the 100-day at $3,309. Downside risks expand if those levels break, exposing $3,268 and potentially $3,120, but so far the price action shows buyers willing to step in above $3,310.
The coming week is critical, with jobless claims and Core PCE inflation scheduled. Traders will watch Thursday’s claims print at 12:30 GMT closely, as Powell has tied future policy to labor stability. A weak claims number could cool easing bets, but a soft PCE on Friday would reignite the rally. Expectations center on a 0.3 percent monthly PCE increase. If inflation cools and claims remain elevated, gold could pierce $3,409 and extend into the mid-$3,400s. Any upside surprise in inflation, however, may stall the breakout.
The $3,400 level has emerged as a battleground. Bears are layering shorts near this threshold, betting on a dollar rebound, while bulls remain emboldened by Powell’s shift. Despite short-term turbulence, gold has gained 3.8 percent in the past month and a stunning 43 percent year-on-year. This performance underscores its safe-haven appeal amid tariff conflicts and global trade friction. Recent commentary from Fed officials including Michelle Bowman, who hinted at three cuts in 2025, further fuels bullish conviction. Futures markets currently price an 89 percent chance of a September cut, reinforcing expectations that dips will be bought aggressively.
Gold’s year-long resilience rests not only on central banks and ETFs but also on opportunistic household demand in emerging markets, which consistently absorbs supply without selling into rallies. That storage behavior creates a sticky demand base that keeps supply off the market. At the same time, ETF flows, though slower to react, magnify Fed policy shifts. With inflation pressures easing and employment data softening, the macro landscape continues to favor bullion over yield-bearing assets. Structurally, the 3,310 support zone remains the key defense line for bulls, while a decisive break of 3,409 would reset targets toward 3,452 and 3,500.
All current data points to a constructive view. Central banks remain net buyers, ETFs are positioned to respond positively to any further dovish tilt, and speculative profit-taking has been absorbed at higher lows. Gold at 3,371 sits comfortably above major support, with upside potential unlocked if $3,409 is cleared. Near term volatility will hinge on PCE and jobless claims, but the structural bull cycle driven by central bank conviction and weakening yields remains intact. The rating is Buy, with targets stretching toward 3,452 and 3,500 provided that the $3,310 floor continues to hold.
The gold market entered the final stretch of August with renewed bullish momentum, as spot gold (XAU/USD) closed the week at $3,373.89 per ounce, while U.S. gold futures settled even stronger at $3,418.50. The move was powered by dovish language from Federal Reserve Chair Jerome Powell at the Jackson Hole symposium, where he emphasized that risks are tilting toward softer growth and possible rate cuts in September. The probability of a 25 basis point cut surged to 85%, up from 75% just hours before Powell’s speech, according to CME FedWatch. That pivot translated immediately into a weaker U.S. dollar, down roughly 1% on the day, which amplified demand for non-yielding safe havens like gold.
The dollar’s sharp decline opened the door for gold to extend its breakout, and the correlation was direct. As yields on the 10-year U.S. Treasury eased to 4.26%, traders rotated capital into metals, lifting gold alongside silver, which spiked 2.2% to $39.01, while platinum and palladium registered firm gains. The RSI on gold rose to 66, showing bullish momentum without flashing overbought, while the MACD printed a bullish crossover, confirming the strength of the rally. Volume supported the upside, with conviction buying accelerating on the breakout above $3,342, where the 50-period SMA had capped previous attempts.
For much of the prior week, gold had consolidated in a triangular range between $3,313 and $3,378. Friday’s breakout candle marked a decisive shift from indecision to conviction. Traders are now eyeing the $3,405 resistance, followed by $3,433, which capped the July advance. Support lies at $3,351–$3,342, the breakout zone, with the next critical floor at $3,313. A daily close above $3,378 solidifies the bullish setup, with targets extending toward $3,500 in the medium term. If gold fails to hold above $3,313, however, momentum could reverse back to sellers, with $3,250 the next defensive line.
U.S. economic data last week painted a mixed picture. Jobless claims climbed to 235,000, the fastest rise in nearly three months, underscoring cracks in the labor market. Meanwhile, PMI readings surprised to the upside, and housing remains soft, pointing to a fragile growth environment. Powell’s acknowledgment of “shifting risks” was a direct nod to balancing full employment with price stability, a comment that markets interpreted as a green light for rate easing. Against this backdrop, gold’s safe-haven function remains intact, especially with upcoming catalysts like U.S. GDP (forecast 3.1% vs. prior 3.0%) and Core PCE inflation (expected +0.3%) set to shape Fed timing. Stronger growth could temporarily weigh on gold by reducing cut expectations, while weaker numbers may accelerate flows into XAU/USD.
Beyond the Fed, one of the strongest structural drivers for gold remains central bank accumulation. Goldman Sachs estimates that 100 tonnes of net central bank purchases translate into a 1.7% rise in gold prices. With global mine output relatively stable and inelastic, flows from conviction buyers like ETFs, sovereigns, and speculators are disproportionately impactful. Emerging-market central banks have been particularly aggressive buyers since the freezing of Russian reserves in 2022, a shift that redefined gold as the “unfreezable reserve asset.” This sovereign accumulation has offset ETF outflows at times, anchoring support under gold even during corrective phases.
Physical demand has shown regional divergences. In India, jewelers resumed restocking ahead of festival season, while demand in China has been tempered by volatility in yuan-denominated prices. Still, Asian retail demand typically reinforces support zones, cushioning pullbacks when Western paper markets trigger liquidations. With total global demand surpassing 4,900 tonnes in 2023, and central banks adding over 1,000 tonnes to reserves, the underlying bid remains firm even when speculative activity fluctuates.
The geopolitical layer cannot be overlooked. Domestically, President Donald Trump has intensified political pressure on the Fed, even threatening to dismiss Governor Lisa Cook, an unusual intervention that highlights institutional strain. Abroad, escalating tensions between Russia and Ukraine, particularly Putin’s demand for full control of Donbas and rejection of NATO expansion, remind investors of the enduring geopolitical hedge value of gold. Historically, such periods of uncertainty push gold well beyond fair-value models, as buyers seek refuge in the only globally liquid asset outside sovereign control.
Gold’s latest move has traders zeroed in on clear inflection points. The wide-bodied bullish candle carved out on Friday at $3,342 signaled a break from weeks of hesitation, shifting sentiment firmly back to the buyers. Momentum gauges back that shift: the RSI is climbing without yet being stretched, and the MACD has swung positive, underscoring strength behind the move. Positioning now favors buying into pullbacks around the breakout zone of $3,351–$3,342, with $3,313 marked as the line that would invalidate the setup. Upside targets are well defined at $3,405 and $3,433, where supply capped previous rallies. ETF flows remain soft, with modest outflows persisting, but the scale of central-bank and sovereign accumulation still sets the tone—big, conviction buyers are dictating direction even when shorter-term sentiment looks uneven.
The market remains above the long-term pivot at $65.38, supported further by the 200-day moving average at $63.99 and the 50-day at $62.10. The crossover of the 200-day above the 50-day signals a bullish bias in the broader trend. Price action continues to consolidate within this structure, awaiting a breakout catalyst.
Traders are closely tracking U.S. President Donald Trump’s tightened ultimatum on Russia, demanding progress toward ending the war in Ukraine within 10 to 12 days. The administration is threatening 100% secondary tariffs on countries continuing to trade Russian oil, a move aimed squarely at China and India—Moscow’s largest customers.
Analysts at JP Morgan expect India to comply with U.S. demands, potentially displacing 2.3 million bpd of Russian barrels. China, on the other hand, is unlikely to bend, raising the risk of tariff escalation. Treasury Secretary Scott Bessent warned that China could face significant duties if it maintains its Russian crude intake.
PVM’s John Evans noted that any resulting gap in global supply would take time to fill, even if Saudi Arabia and OPEC step in. This lag adds further support to near-term prices. Vanda Insights estimates a $4–$5 per barrel risk premium is already baked in.
Adding to supply-side pressure, Mexico’s Pemex slashed exports by 39% year-over-year in June, down to 458,103 bpd—the lowest monthly volume since records began in 1990. The drop aligns with Mexico’s ongoing push for energy “sovereignty,” prioritizing domestic refining. Output remains constrained at 1.6 million bpd, well below the company’s stated goal of 1.8 million.
Pemex also reduced refined product imports by 38% last month as its new Olmeca refinery absorbed more feedstock. While the company aims to boost production via private partnerships, execution remains limited.
Price action confirmed a breakout of a small falling wedge pattern. The initial target from the wedge points to the start of the pattern at the recent swing high of $3,409. A move through that level may lead to testing resistance along the top boundary of a symmetrical triangle consolidation. Traders should watch how gold reacts near $3,409, as it may either encounter resistance or signal a further upside breakout.
The current short-term upswing began at the recent swing low (C), suggesting momentum may not yet be strong enough to breach the triangle boundary decisively. A daily close above $3,439 would serve as a more definitive breakout trigger, confirming a sustained bullish move. Until that occurs, any advance should be viewed with caution, as breakouts are prone to failure without follow-through confirmation.
A breakout above this week’s high would trigger a weekly reversal and add to bullish momentum for gold. Conversely, a drop below $3,268 would undermine the short-term bullish case. On the monthly chart, gold is positioned to potentially end the period at its highest-ever monthly close. Even without a triangle breakout, such a close would be a strong bullish signal for the medium-term trend.
Traders should monitor $3,409 as the initial upside target and $3,439 as the confirmed breakout level. Support near $3,268 remains critical to watch for potential downside risk. Until either a clear breakout or a failure occurs, gold is in a decision zone that could define the next major directional move.
For a look at all of today’s economic events, check out our economic calendar.
– Written by
Tim Boyer
STORY LINK Pound Sterling Forecasts Warn Crash vs Euro, Dollar on 1976-Style UK Crisis
The British Pound faces its most alarming warning in decades, with GBP analysts bracing for heavy losses against the euro and US dollar. A former Bank of England policymaker has drawn chilling parallels with the economic crash of 1976 – when the UK was forced into an IMF bailout. With inflation stuck near 4%, gilt yields heading towards 5%, and government borrowing spiralling, fears are growing that the Pound Sterling could be sliding towards a historic collapse.
Former Bank of England (BoE) Monetary Policy Committee (MPC) Andrew Sentance has warned that the UK will see a repeat of the 1976 economic crisis with bonds and the Pound sliding in tandem.
Rachel Reeves is on course to deliver a Healey 1976-style crisis in late 2025 or 26. Like Healey, she has massively boosted public spending, borrowing and taxes – fuelling both demand-pull and cost-push inflation. Unless policies are reversed we are heading for an economic crash!
— Andrew Sentance (@asentance) August 20, 2025
There was a mini scare in January, but Sentance has warned that this is just a taster for more severe turbulence within the next few months.
ING expects the Pound to Euro (GBP/EUR) exchange rate to slide to 1.11 by the end of 2026.
There are parallels with 1976 in weather terms as that year was famous or infamous for a prolonged period of hot weather and drought with the government appointing a minister for drought.
It’s also worth noting that this was followed by heavy rain and floods.

As far as the economy is concerned, 1976 marked economic humiliation for the Callaghan government with Chancellor Healey forced to run to the IMF for an emergency loan as the Pound plummeted in currency markets.
The pound collapsed amid a widening budget deficit, a yawning current account imbalance and stubbornly persistent inflation with the Bank of England unable to support growth via cuts in interest rates.
The government secured a $3.9bn loan, half of which was drawn down by the administration.
Andrew Sentance, who was well known as a very hawkish voice on the MPC has issued a stark new warning.
According to Sentance; “Rachel Reeves is on course to deliver a Healey 1976-style crisis in late 2025 or 26. Like Healey, she has massively boosted public spending, borrowing and taxes – fuelling both demand-pull and cost-push inflation. Unless policies are reversed we are heading for an economic crash!”
The latest official inflation data recorded headline and core inflation at 3.8%, but Sentence considers that the data is underestimating inflation.
Looking at a wider range of indicators, Sentance considers that inflation is already 4.1% and set to increase further.

The 10-year bond yield has increased to above 4.75% and close to 4-month highs. According to Sentence, the yield could increase to 5% before long.
The Pound posted sharp losses in January as fears surrounding UK economic policy increased.
As bond yields continue to move higher, the cost of debt servicing continues to increase. This risks a vicious cycle as bond markets and the Pound crash in tandem.
Sentance has also continued to criticise Bank of England policy.
According to Sentance; “The shocking surge in UK inflation continues. When will the MPC recognise that control of inflation requires policy action to bear down on price rises with interest rates. Cutting rates while inflation is rising is a perverse and irresponsible policy.”
Danske Bank is wary over UK fundamentals and expects GBP/EUR losses to 1.1235 on a 6-12-month view. According to Danske; “The key risk to seeing EUR/GBP trade substantially higher than our forecast is a sharp sell-off in global risk and/or renewed focus on the UK’s fragile fiscal position.”
International Money Transfer? Ask our resident FX expert a money transfer question or try John’s new, free, no-obligation personal service! ,where he helps every step of the way,
ensuring you get the best exchange rates on your currency requirements.
TAGS: Pound Sterling Forecasts
– Written by
David Woodsmith
STORY LINK 2025 Forecast: Pound Sterling to Strengthen Against Dollar, Not the Euro
The latest Pound Sterling forecasts point to a split outlook: analysts see the Pound to Dollar (GBP/USD) forecast turning more positive, while the Pound to Euro (GBP/EUR) forecast remains subdued. Markets expect Sterling to push higher against the US Dollar towards 1.39 over the next 12 months, but struggle to break above 1.16 against the Euro.
Consensus suggests a diverging path for Sterling, shaped by resilient UK economic data, stubborn inflation at 3.8%, and an uncertain Bank of England (BoE) policy outlook.
The Pound to Dollar exchange rate failed to re-test the 1.36 level this week, retreating to near 1.34 amid a tentative dollar recovery. Nevertheless, consensus forecasts are for GBP/USD to strengthen to 1.39 on a 12-month view as markets anticipate lower Federal Reserve interest rates.
Not all banks are aligned: Wells Fargo expects GBP/USD will retreat to 1.30 by the end of 2026 on renewed dollar gains, while UBS sees scope for a move back to 1.39 by late 2025, citing “the outlook for lower Federal Reserve rates, White House policy uncertainty, and international investors raising hedge ratios for dollar assets.”
The Federal Reserve remains the key driver. Earlier in the week, markets were convinced that the Fed would cut rates in September, but stronger US data has cast doubt. Fed members remain split, with Cleveland Fed President Hammack stating current conditions “do not justify a rate cut at this stage.”
Markets are now pricing just over a 70% chance of a September cut. A cautious stance from Chair Powell at Jackson Hole could see the Dollar regain ground in the short term, but longer-term expectations still lean towards weakness, underpinning the more positive GBP/USD forecast.
The Pound to Euro exchange rate has consolidated around 1.1570 after failing again to hold above 1.16. Consensus forecasts point to limited losses, with GBP/EUR seen at 1.15 on a 12-month horizon.
Danske Bank is more bearish, forecasting a retreat to 1.1235 within 6-12 months on the back of weak UK fundamentals. It argues that relative growth dynamics are turning against Sterling:
“We increasingly see domestic factors and the relative growth outlook between the UK and the euro area as becoming GBP negatives. This is further amplified by divergence in fiscal policy, with UK fiscal policy set to be tightened in the Autumn.”
Societe Generale also warns that Sterling’s underlying support is fading:
“GBP has decent short-term support, even if its medium-term support is rotting away in the face of a depressing fiscal outlook. Higher taxes are coming and so is slower growth and further GBP weakness.”
SocGen highlights the Euro’s strengthening base, noting that EUR/GBP support has risen steadily from 0.8250 early in the year to 0.86 by July. By the autumn, it expects support to climb to 0.87 — implying GBP/EUR below 1.15.
UK data continues to paint a mixed picture. Manufacturing PMI remains in contraction, while services activity hit a 12-month high. Inflation data came in stronger than expected at 3.8% for both headline and core, raising stagflation concerns.
The Eurozone, meanwhile, reported a 15-month high in its composite output index, supported by gains in both manufacturing and services despite ongoing global trade headwinds.
The Pound Sterling forecast remains finely balanced. Against the Dollar, expectations of Fed easing underpin projections for GBP/USD to strengthen towards 1.39, but short-term risks remain if Powell pushes back on cuts. Against the Euro, Sterling continues to struggle, with GBP/EUR likely capped around 1.15 and downside risks highlighted by Danske and SocGen.
For now, Sterling’s fate will rest on a tug of war between UK fundamentals, BoE caution, and external drivers from Washington and Frankfurt.
International Money Transfer? Ask our resident FX expert a money transfer question or try John’s new, free, no-obligation personal service! ,where he helps every step of the way,
ensuring you get the best exchange rates on your currency requirements.
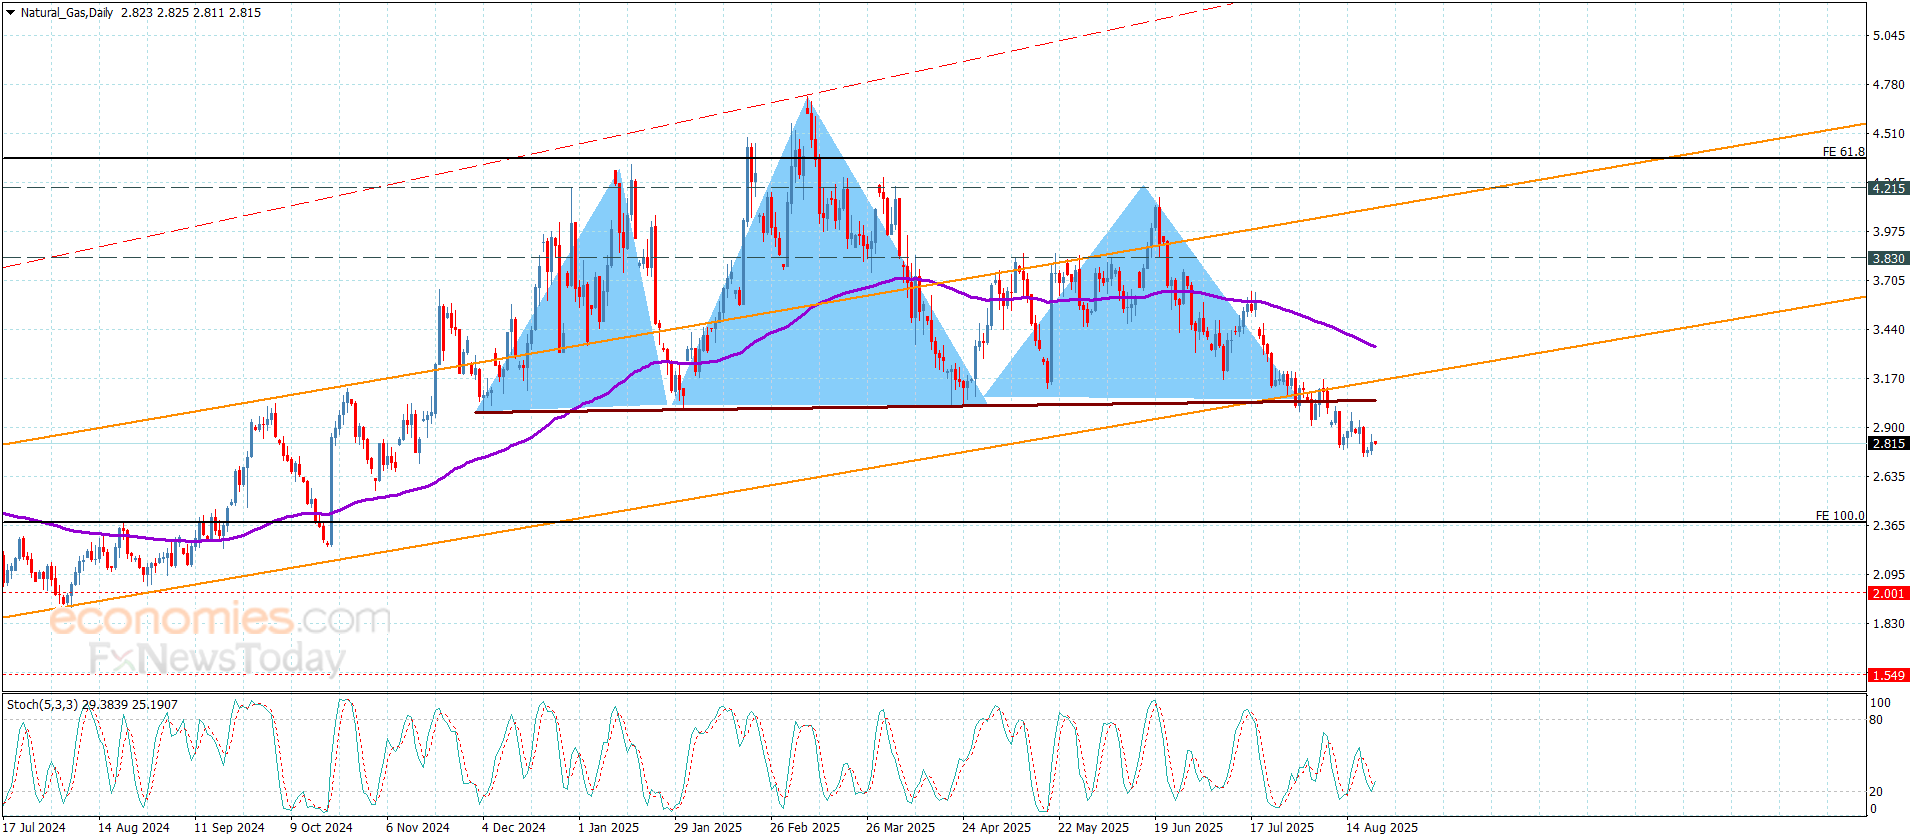
Recent price action shows that natural gas was never able to push through the short downtrend line created during the declining consolidation phase. That failure left the market exposed, and when long-term support finally gave way after multiple tests, it triggered a decisive shift lower. Momentum has since accelerated, reinforcing the dominance of sellers.
The next measured move lower is defined by a falling ABCD pattern, which projects to $2.63. However, given the strength of the decline, that level may offer little more than a temporary pause. A more significant confluence of support lies below, between $2.54 and $2.51. This zone combines both Fibonacci projections and prior swing activity, making it an important area where traders may watch for stabilization or reversal signals.
Natural gas continues to trade beneath the midline of a descending trend channel. This positioning keeps pressure directed toward the channel’s lower boundary, which aligns closely with the $2.54 area. Adding weight to this outlook is a declining trendline drawn from the 2023 peak, which could converge with price zone if weakness extends further. The overlap of channel and trendline support makes the lower zone technically significant.
The weekly chart is turning decisively negative. A close near the lows of the week underscores sustained selling pressure and the lack of meaningful buying interest. Long candles at trend lows often indicate exhaustion, but so far, the bears are clearly in chart. This leaves natural gas vulnerable to additional declines in the near term.
For buyers to regain conviction, natural gas would need to reclaim $2.85, the interim swing high from Thursday. Only a decisive and sustained move above that level would begin to challenge the prevailing bearish structure. Until then, the path of least resistance remains lower, with traders watching for reactions at deeper support.
For a look at all of today’s economic events, check out our economic calendar.
The GBPJPY pair provided temporary positive trading, attempting to recover some of its losses by its rally to 199.35, to begin declining affected by stochastic negativity, approaching from 20 level as appears in the above image.
The attempts of forming an extra barrier at 199.60 level confirms the price confinement within the bearish track, to keep preferring the negative attempts, that might target 198.20 reaching 197.45, to face 61.8%Fibonacci correctional level.
The expected trading range for today is between 198.20 and 199.40
Trend forecast: Bearish
Gold (XAU/USD) extended its rally on Friday, climbing 1% to $3,372.60 per ounce in spot trading while U.S. futures reached $3,416.90, their strongest close in nearly two weeks. December futures (GC=F) opened at $3,383.30, up from Thursday’s $3,336.90, and have gained 35.1% year-on-year from $2,504.10. The latest rebound comes as Powell’s Jackson Hole speech strengthened bets for a 25 basis point Fed cut in September, with CME FedWatch placing odds at 90%, compared to 75% just a day earlier. The softer dollar, down 0.7% on the DXY, and cooling Treasury yields reinforced bullion’s safe-haven appeal.
Gold’s trajectory is defined by pivotal chart levels. Immediate resistance stands at $3,400, a threshold that, if broken, opens the door toward $3,452 and $3,500. Support rests at $3,353, with deeper cushions at $3,319 and $3,300. The 50-day EMA around $3,344–$3,348 is being closely tracked as a pivot zone. Bulls argue that a sustained move above this band would solidify momentum and confirm an extension toward new highs, while a break below $3,350 risks exposing July’s lows.
At Jackson Hole, Powell acknowledged a “challenging situation” for the Fed, with inflation still sticky yet labor market momentum showing cracks. Jobless claims hit 235,000, their highest since 2021, and continuing claims reached 1.972 million. Powell admitted the balance of risks has shifted, giving the market confidence that the Fed is moving closer to an easing cycle. Still, dissent remains: Cleveland’s Beth Hammack and Kansas City’s Jeffrey Schmid cautioned that inflation risks persist, while Atlanta Fed’s Raphael Bostic forecast just one rate cut in 2025, highlighting internal divisions. Despite the hawkish pushback, traders focused on Powell’s softer tone.
Regional markets highlight the sensitivity of physical gold to local currencies. In the Philippines, prices eased to ₱6,112.34 per gram from ₱6,132.23, with a troy ounce fetching ₱190,130.30. Thailand saw gold flows affecting the baht, with stronger exports lifting the currency. These trends underscore gold’s dual role as both an inflation hedge and a currency stabilizer, particularly in Asia, where households frequently turn to bullion as a store of value during volatility.
Geopolitical risk continues to underpin demand. Russia renewed its demands on Ukraine regarding Donbas and NATO restrictions, boosting safe-haven positioning. Meanwhile, U.S. Treasury yields remain capped, with the 10-year at 4.328% and real yields near 1.978%, still favorable for gold. Dollar weakness against the euro and pound added to the bullish backdrop, while USD/JPY’s retreat reflected broader unwinding of long-dollar trades.
Banks and funds remain firmly positive. Goldman Sachs projects $3,700 by end-2025, citing relentless central bank buying and tariff uncertainty. UBS and Citi echoed upside potential as Fed cuts draw closer. Central bank accumulation remains a key driver, with purchases at 50-year highs since January. On a structural level, Crescat Capital estimated that a revaluation of U.S. gold reserves relative to liabilities could justify astronomical prices between $25,000 and $55,000 per ounce — far from tactical reality but a reminder of bullion’s underlying leverage.
Silver (SI=F) surged 2.2% to $39.01, nearing its July peak of $39.91. Platinum added 0.7% to $1,362.90, and palladium advanced 1.4% to $1,125.53. Silver’s outperformance in percentage terms suggests investors are broadening exposure to the precious metals complex, using gold’s breakout as a signal to diversify into correlated assets.
Physical demand in India remains restrained due to high prices, though festival season may revive buying. In the U.S., gold’s mainstream reach expanded as Costco (COST) reported outsized demand for gold bars, silver coins, and platinum. With all three products up more than 22% YTD, retail penetration shows how bullion is becoming embedded in household wealth strategies beyond institutional and central bank demand.
The gold price forecast hinges on whether XAU/USD clears the $3,400 ceiling. A confirmed break higher signals a buy, targeting $3,452 and $3,500. If momentum stalls and $3,350 gives way, a tactical pullback toward $3,319 is likely. With Fed cuts looming, dollar softness, and robust central bank purchases, the structural case remains bullish, and the recommendation is Buy on dips toward $3,350 while maintaining upside exposure to $3,500.
The (ETHUSD) price rose in its last intraday trading, attempting to offload some of its clear oversold on the (RSI), especially with the emergence of the positive signals from there, amid the dominance of the bearish correctional trend on the short-term basis, and its trading alongside a supportive bias line for this track, with the continuation of the negative pressure that comes from its trading below EMA50, intensifying the negative pressure around the price, and prevents the price recovery on the near-term basis.
BestTradingSignal.com – Professional Trading Signals with high accuracy. Subscribe now to tailored packages for the world’s leading markets and receive signals instantly via Telegram from an expert team:
Check full VIP signals performance report for the week of August 11–15, 2025: Full Report