The main category of Forex News.
You can use the search box below to find what you need.
[wd_asp id=1]
The main category of Forex News.
You can use the search box below to find what you need.
[wd_asp id=1]
If gold breaks decisively below the triangle’s lower boundary, a bearish signal would be triggered. However, confirmation requires further weakness, specifically a decline through the higher swing low at $3,268. A close below that level would confirm a breakdown from the triangle, setting up a test of the May swing low at $3,121. That level also marks the completion of a 38.2% Fibonacci retracement ($3,149) measured from April’s $3,500 record high.
Should $3,121 fail to hold, volatility could increase sharply, as failed consolidation patterns often lead to extended moves. Given that this triangle has formed at the top of a long-term bull trend, the expectation under normal conditions would be for an eventual upside breakout. If that does not occur, the 200-Day moving average, now at $3,043, becomes the next major downside target. Whether it is reached or not it indicates increasing seller pressure.
While bearish risks dominate in the short term, traders should also remain alert to the potential for false breakdowns. A reversal back into the triangle after a failed move lower could set the stage for renewed bullish momentum. A breakout above the $3,439 swing high, which helps define the triangle’s upper boundary, would confirm such a reversal and signal a return to the longer-term uptrend.
Until gold breaks decisively beyond the symmetrical triangle boundaries, momentum is likely to remain muted. Within this consolidation phase, short-term patterns are less likely to follow through. For now, bears control the short-term picture, but both $3,268 on the downside and $3,439 on the upside remain pivotal levels for the next decisive move.
For a look at all of today’s economic events, check out our economic calendar.
Silver price gains marginally to near $38.00 amid caution ahead of meeting between US President Trump and Ukrainian President Zelenskiy.
The Fed is expected to cut interest rates in September.
Silver price wobbles near the 20-day EMA around $37.90.
Silver price (XAG/USD) edges higher to near $38.00 during the European trading session on Monday. The white metal attracts slight bids as the market sentiment is slightly cautious, with investors awaiting the meeting between United States (US) President Donald Trump and Ukrainian President Volodymyr Zelenskiy at the White House on Monday.
US Secretary of the State Marco Rubio has confirmed that a bunch of European and NATO members are joining Trump and Zelenskyy at the White House to discuss concessions proposed by Russian leader Vladimir Putin for ending war in Ukraine.
Signs of a truce between Russia and Ukraine would be unfavorable for safe-haven assets, such as Silver, which tends to perform strongly in heightened geopolitical tensions.
However, firm expectations that the Federal Reserve (Fed) will reduce interest rates in the September meeting continue to provide support to the Silver price. Lower interest rates by the Fed bode well for non-yielding assets, such as Silver.
According to the CME FedWatch tool, the probability of the Fed to cut interest rates in September is 82.6%. Traders have remained confident about Fed’s interest rate cuts in the policy meeting next month due to cooling labor market conditions.
Silver price gains marginally to near $38.10 on Monday. The white metal demonstrates a sharp contraction in volatility due to the Descending Triangle formation on a daily timeframe. The horizontal support of the above-mentioned chart pattern is plotted from the July 7 low around $36.16, while the downward-sloping border is placed from the July 23 high near $39.53.
The asset wobbles near the 20-day Exponential Moving Average (EMA), which trades around $37.90, suggesting a sideways trend
The 14-day Relative Strength Index (RSI) oscillates inside the 40.00-60.00 range, indicating indecisiveness among market participants.
Looking down, the June 24 low of $35.28 will act as key support for the major. On the upside, the July 23 high near $39.53 will be a critical hurdle for the pair.
See today’s full USD/JPY forecast with chart setups and trade ideas.
Turning to the AUD/USD pair, investors are bracing for crucial wage data. Wage growth trends are a key consideration for the RBA and monetary policy decisions.
Rising wages may fuel consumer spending and demand-driven inflation. A higher inflation outlook could reduce expectations of a Q4 RBA rate cut, lifting demand for the Aussie dollar.
On the other hand, softer wage growth could dampen demand-driven inflation, supporting further RBA rate cuts.
According to the ABA, total wages and salaries paid by employers rose 0.9% month-on-month in March and by 5.8% year-on-year. The Wage Price Index, a separate wage growth indicator, rose 0.8% quarter-on-quarter in the second quarter, down from 0.9% in the previous quarter.
AMP Head of Investment Strategy and Chief Economist Shane Oliver projected a November rate cut and further policy easing in H1 2026, stating:
“We continue to see the RBA cutting rates again in November, February and May taking the cash rate down to 2.85%.”
Will today’s wage data confirm Oliver’s forecast—or surprise markets?
Beyond the data, the People’s Bank of China’s loan prime rate decision could influence AUD/USD trends. Markets predict the PBoC will leave the one-year and five-year LPRs at 3% and 3.5%, respectively. A surprise cut to LPRs could boost domestic demand, potentially improving Aussie trade terms.
For context, Australia has a trade-GDP ratio of over 50%, with roughly one-third of shipments bound for China.
AUD/USD: Key Scenarios to Watch
Explore our full AUD/USD analysis, including key trends and trade data, here.
Later today, Fed speeches will draw interest as the Jackson Hole Symposium looms. Recent US inflation-linked data have affected Fed rate cut bets and US-Aussie rate differentials.
Hawkish Fed signals, calling for a delay to interest rate cuts, would widen the rate differential in favor of the US dollar. A wider rate differential could push AUD/USD toward the $0.6400 support level. If breached, the $0.63500 mark would be the next key support level.
Conversely, increased support for a September Fed rate cut and cuts in the fourth quarter would narrow the rate differential. A narrower rate differential may send AUD/USD above the 200-day EMA, paving the way to the 50-day EMA.
Today’s weakness follows last Friday’s failed attempt to push higher, where resistance was met at a long-term anchored volume weighted average price (AVWAP) with a peak at $2.97. That test aligned closely with additional resistance near $3.00, and the 20-Day moving average, now at $2.99, which represents dynamic resistance in the broader downtrend. Any rallies from current levels are expected to face headwinds in this $2.97–$2.99 zone, keeping bears in control.
The breakdown has opened the path to lower targets, with $2.63 as the first level of interest. This comes from a smaller descending ABCD pattern, where symmetry between the AB and CD legs projects a 100% match at $2.63.
Beyond $2.63, attention shifts to a lower confluence zone between $2.54 and $2.51. Multiple technical factors point toward this region, strengthening its significance as a potential magnet for price. It includes a 78.6% Fibonacci retracement at $2.54 and aligns with a larger ABCD pattern, measured from this year’s peak, that projects a 78.6% downside target also at $2.54. Combined, these overlapping levels define a high-probability area where natural gas may eventually seek support if the bearish correction continues.
With today’s continuation signal and sellers maintaining control, natural gas remains biased lower. Until the 20-Day average is reclaimed, momentum favors additional downside toward $2.63 initially, and potentially into the $2.54–$2.51 support band.
For a look at all of today’s economic events, check out our economic calendar.
– Written by
David Woodsmith
STORY LINK GBP/USD Forecast: Pound Sterling Flat despite Downbeat Market Mood
The Pound Sterling was trapped in a narrow range against the US Dollar on Tuesday despite a risk-off market sentiment.
While largely steady versus the Pound (GBP), the US Dollar (USD) managed to gain ground against several other major currencies on Tuesday.
Even in the absence of market-moving releases, the ‘Greenback’ drew support from a prevailing risk-off market mood.
The cautious tone bolstered the Dollar’s safe-haven appeal, particularly against its riskier rivals.
At the same time, investors remained hesitant to take aggressive positions on the Dollar ahead of key events later in the week, including the upcoming FOMC meeting minutes and the Jackson Hole Symposium.
On Tuesday, the Pound (GBP) showed little conviction, with a quiet UK economic calendar leaving Sterling largely influenced by overall market sentiment.

Amid a downbeat market mood, the currency fell back against a number of safe-haven peers, highlighting its sensitivity to shifts in risk appetite.
Equally, the risk environment allowed GBP to make small gains against more risk-sensitive currencies on Tuesday.
With no new domestic data to guide its movement, Sterling fluctuated against most of its key counterparts.
Looking ahead to Wednesday, the GBP/USD pair is expected to respond to key economic releases from both the UK and the US.
In the United States, investors will focus on the latest FOMC meeting minutes, which could weigh on the US Dollar if they signal a dovish stance and reinforce expectations of upcoming Federal Reserve interest rate cuts.
Meanwhile, the UK is set to publish July’s consumer price index (CPI), with forecasts pointing to a modest rise from 3.6% to 3.7%.

Should the inflation data meet expectations, Sterling may find support, potentially pushing GBP higher against the US Dollar during Wednesday’s European session.
International Money Transfer? Ask our resident FX expert a money transfer question or try John’s new, free, no-obligation personal service! ,where he helps every step of the way,
ensuring you get the best exchange rates on your currency requirements.
Spot Gold came under selling pressure during American trading hours, easing towards the $3,320 area. The bright metal retreated as the US Dollar (USD) gathered momentum amid fresh optimism about a resolution of the Russian Ukraine war. On Monday, United States (US) President Donald Trump met with the Kyiv leader, Volodymyr Zelenskyy, and different European authorities to discuss the conditions for a peace agreement.
After the meeting, Trump reported progress and said he would help Ukraine get secure conditions for a peace deal, but excluded the country from joining the North Atlantic Treaty Organization (NATO). He also stated the next meeting should be between Zelenskyy and Russian President Vladimir Putin.
Later, Trump offered an interview to FOX News, in which he added that he hopes Putin “will be good,” and if he’s not, it will become a “rough situation.”
Other than that, investors kept an eye on Canadian inflation data. Canada’s headline Consumer Price Index (CPI) recorded an annual 1.7% increase in July, down from the 1.9% posted in June and matching estimates, according to Statistics Canada. The Bank of Canada (BoC) core annual CPI printed at 2.6% for the year to July, slightly below the previous 2.7%.
Market players are now waiting for the Federal Open Market Committee (FOMC) meeting Minutes scheduled for Wednesday, and the Jackson Hole Symposium taking place this week. Policymakers’ words are closely watched for potential hints on upcoming monetary policy decisions.
The XAU/USD pair trades near an intraday low of $3,320.98, and technical readings in the daily chart show that a mildly bearish 20 Simple Moving Average (SMA) keeps offering dynamic resistance, currently at around $3,348.00. At the same time, a bullish 100 SMA is losing its bullish strength at around $3,309.00, providing support. Finally, technical indicators diverge, as the Momentum indicator aims north above its midline, while the Relative Strength Index (RSI) indicator gains downward traction at around 45.
In the near term, and according to the 4-hour chart, the XAU/USD pair is bearish. The 20 SMA accelerated south below converging 100 and 200 SMAs, with the shorter, in line with increased selling interest. At the same time, technical indicators head south within negative levels, in line with lower lows ahead.
Support levels: 3,320.00 3,309.00 3,295.80
Resistance levels: 3,339.20 3,348.00 3,372.30
The US dollar initially rallied against the Japanese yen during trading here on Tuesday, but at this juncture, it just looks like a market that continues to see a lot of noise at the 148 yen level. If and when we can finally leave this area, the next target might be 151 yen, as that’s basically where we saw all the massive selling from a couple of weeks ago.
And keep in mind that despite the fact there is a general consensus that the Federal Reserve is going to start cutting, the interest rate differential still heavily favors the US dollar. And that’s something that eventually will come back into the picture. The 50-day EMA underneath offering support is worth paying close attention to because if we break down below there, we could find ourselves dropping to 146 yen.
The Australian dollar has done next to nothing in the early hours here on Tuesday, perhaps waiting for the interest rate decision out of New Zealand, as the two currencies move somewhat lockstep with each other, because there will be a sympathy related move when we get that announcement early in Wednesday trading. So, I think at this point, it makes a certain amount of sense that a pair that’s been admittedly quiet and sideways anyways, isn’t doing much. The 0.6550 level continues to be an area of resistance that I’m willing to fade at the first signs of exhaustion.
For a look at all of today’s economic events, check out our economic calendar.
Weather remains a primary driver, and the latest models are providing little support. According to NatGasWeather, a strong upper ridge remains in control through Tuesday with highs ranging from the upper 80s to 100s across much of the country. However, the forecast turns cooler midweek, especially across the Midwest, Northeast, and Ohio Valley, with highs dropping to the 60s and 70s.
The 8–15 day outlook trends even cooler, showing the dominant ridge weakening and retreating into the southern U.S. That’s keeping national cooling degree days (CDDs) near or slightly below normal—hardly the setup for a late-summer demand surge.
The EIA reported a 56 Bcf injection into storage for the week ending August 8, bringing total inventories to 3,186 Bcf. That’s 79 Bcf below last year’s levels but still 196 Bcf above the five-year average. Regional builds were broad-based, with the East and Midwest adding 21 Bcf each.
Even with stockpiles running slightly behind last year, current levels remain well within the five-year range, muting any urgency for supply-side concerns. Traders are viewing the steady pace of injections—and the likelihood of continued moderate weather—as evidence that end-of-season storage targets can be met without price pressure.
The GBP/USD price analysis shows the pound steady after a recent collapse due to dollar strength. The dollar paused its rally as safe-haven demand dropped after the meeting between Trump and Zelensky ended well. Meanwhile, focus is shifting towards the Jackson Hole symposium for clues on Fed rate cuts.
Trump and Zelenskiy’s meeting went well, with the two leaders seeming to be on the same page. The US has promised to guarantee Ukraine’s safety in case of a peace deal with Russia. Last week, the meeting between Trump and Putin also ended well. The US president noted that Putin was more willing to work towards a peace deal instead of a ceasefire deal. Nevertheless, markets remain uncertain about the future.
Elsewhere, the Fed will meet during the Jackson Hole Symposium, and traders will watch Powell’s tone. After recent US data, traders are pricing an over 80% chance of a cut in September. Moreover, they expect policymakers to sound more dovish. However, experts have warned that Powell might not give a clear signal on rate cuts.
Market participants are not anticipating any high-impact economic releases from the UK or the US.
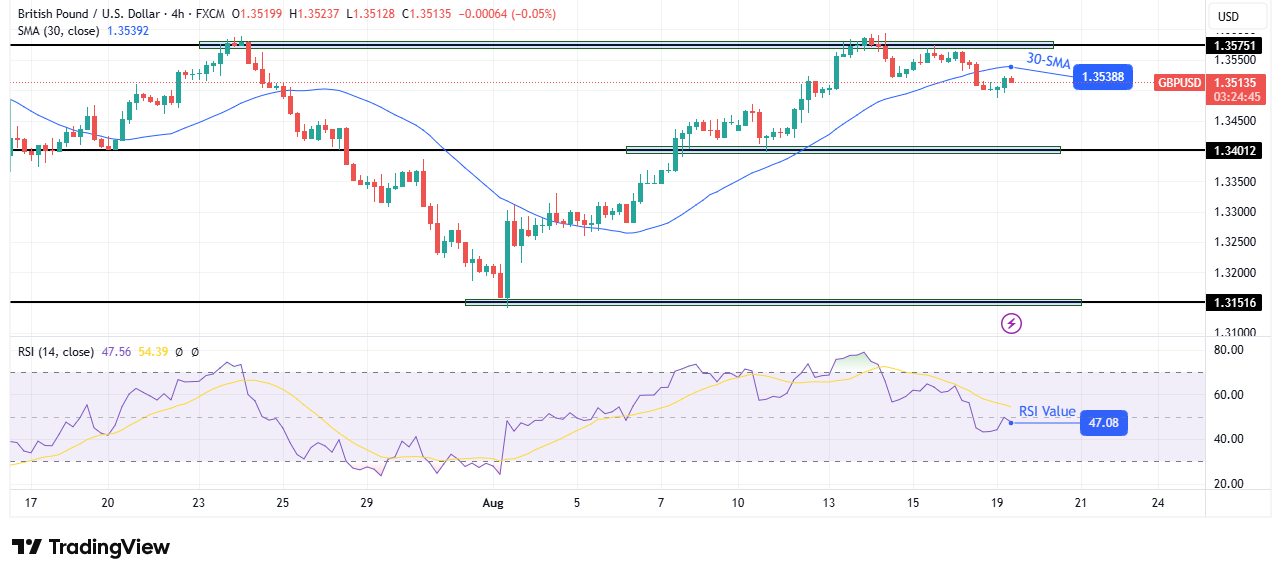
On the technical side, the GBP/USD price has broken below the 30-SMA after failing to break above the 1.3575 resistance level. The break indicates a bearish shift in sentiment. At the same time, the RSI has broken below 50, suggesting a surge in bearish momentum.
–Are you interested to learn more about forex tools? Check our detailed guide-
Initially, the price was climbing in a developed bullish trend, with the price keeping above the 30-SMA. However, the price failed to make a higher high when bulls met the 1.3575 resistance level. Instead, it made a lower high and broke below the SMA to make a lower low. This pattern shows the beginning of a downtrend.
However, bears must keep the price below the SMA and respect it as a resistance. If this happens, the price will likely drop to retest the 1.3401 support level. On the other hand, if bulls regain momentum, the price will likely retest the 1.3575 resistance.
Looking to trade forex now? Invest at eToro!
67% of retail investor accounts lose money when trading CFDs with this provider. You should consider whether you can afford to take the high risk of losing your money.
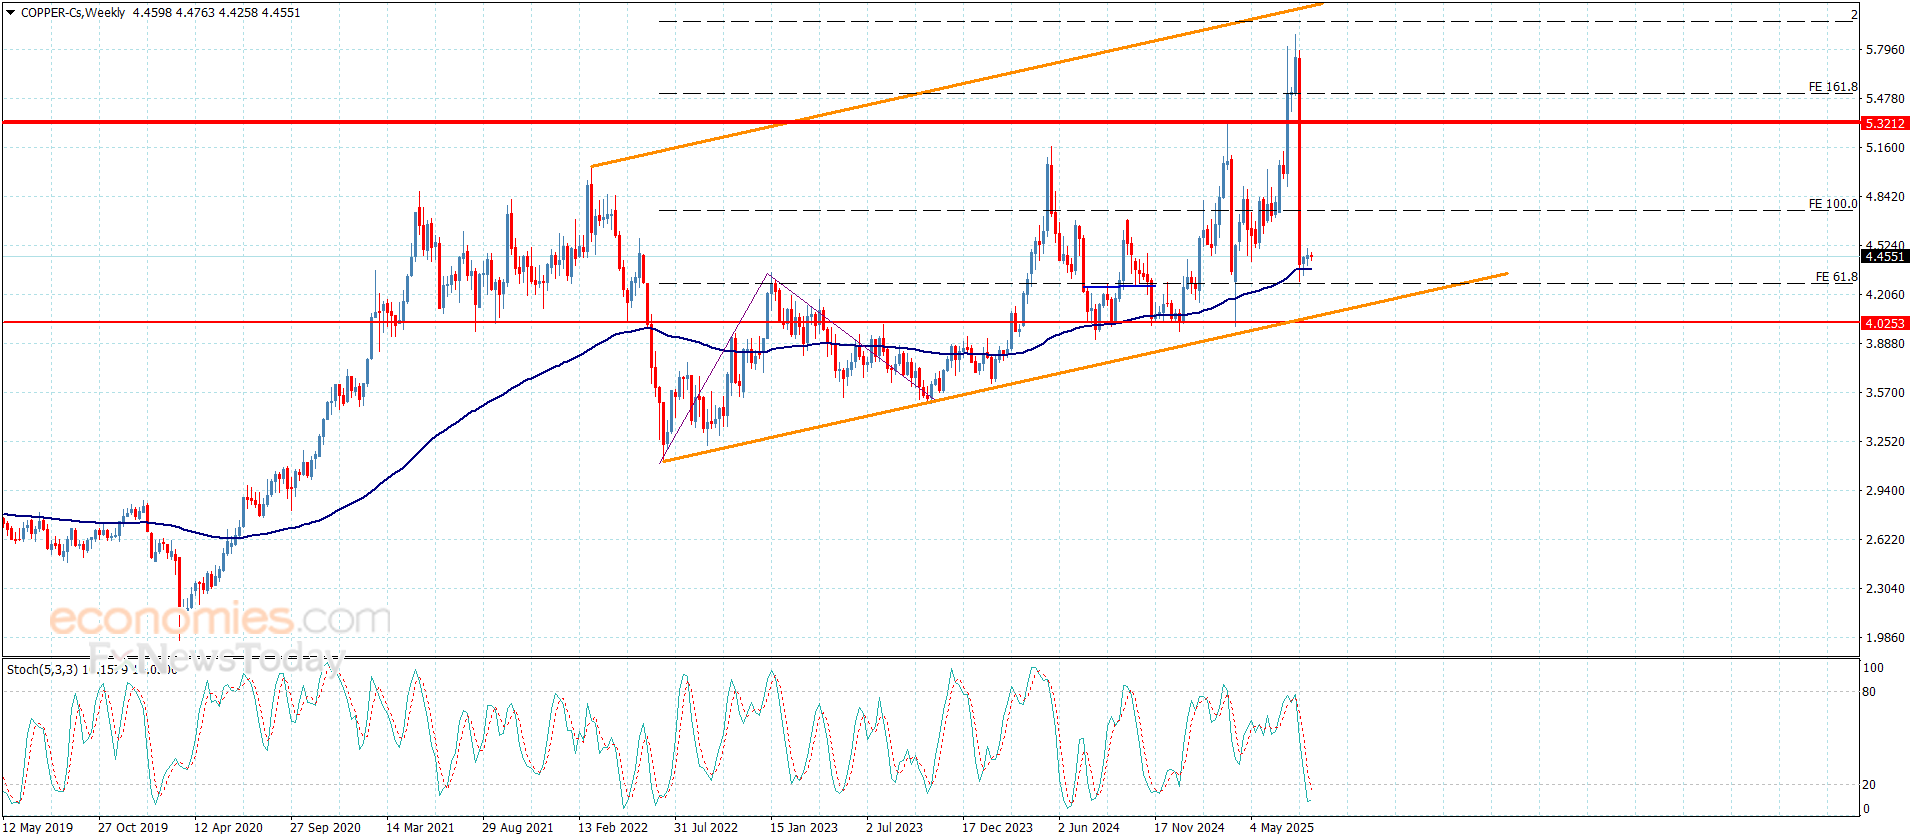
Copper price didn’t move anything, to keep providing slow sideways trading by its fluctuation near $4.4500, affected by the continuation of the main indicators’ contradiction, due to the stability of stochastic within the oversold level, to reduce the chances for renewing the suggested bullish attempts.
The stability above the extra support at $4.2600 assists to confirm the price confinement within the bullish track, to keep waiting for gathering the required positive momentum for reaching the positive stations near $4.6200 and $4.7400.
The expected trading range for today is between $4.330 and $4.6300
Trend forecast: Bullish