The main category of Forex News.
You can use the search box below to find what you need.
[wd_asp id=1]
The main category of Forex News.
You can use the search box below to find what you need.
[wd_asp id=1]
The GBP/USD price analysis shows the pound steady after a recent collapse due to dollar strength. The dollar paused its rally as safe-haven demand dropped after the meeting between Trump and Zelensky ended well. Meanwhile, focus is shifting towards the Jackson Hole symposium for clues on Fed rate cuts.
Trump and Zelenskiy’s meeting went well, with the two leaders seeming to be on the same page. The US has promised to guarantee Ukraine’s safety in case of a peace deal with Russia. Last week, the meeting between Trump and Putin also ended well. The US president noted that Putin was more willing to work towards a peace deal instead of a ceasefire deal. Nevertheless, markets remain uncertain about the future.
Elsewhere, the Fed will meet during the Jackson Hole Symposium, and traders will watch Powell’s tone. After recent US data, traders are pricing an over 80% chance of a cut in September. Moreover, they expect policymakers to sound more dovish. However, experts have warned that Powell might not give a clear signal on rate cuts.
Market participants are not anticipating any high-impact economic releases from the UK or the US.
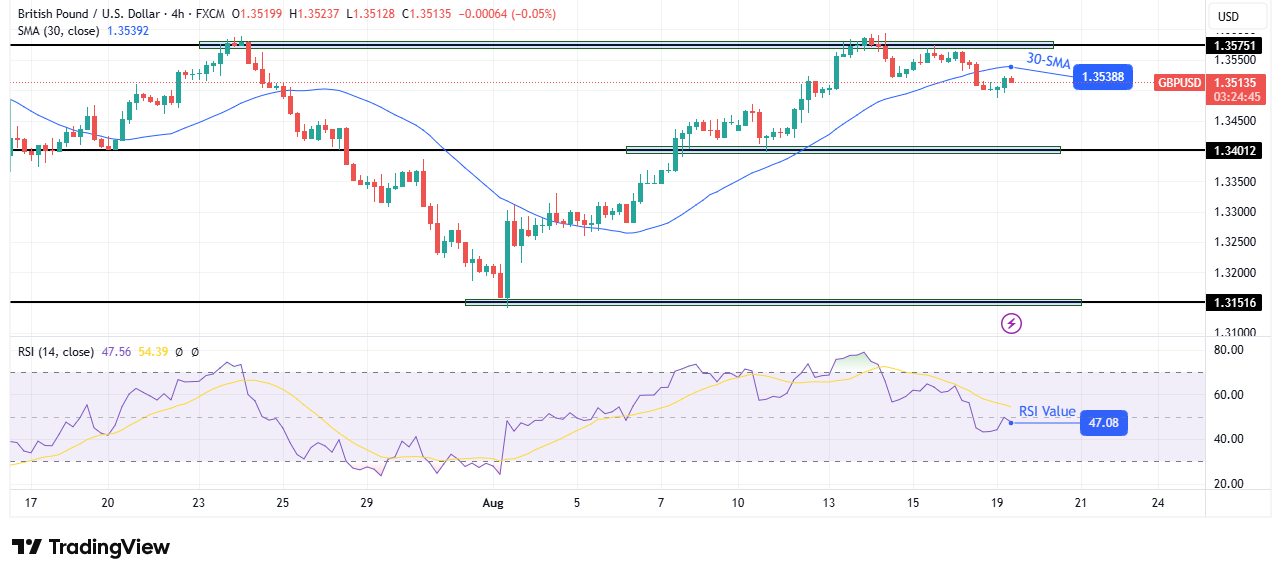
On the technical side, the GBP/USD price has broken below the 30-SMA after failing to break above the 1.3575 resistance level. The break indicates a bearish shift in sentiment. At the same time, the RSI has broken below 50, suggesting a surge in bearish momentum.
–Are you interested to learn more about forex tools? Check our detailed guide-
Initially, the price was climbing in a developed bullish trend, with the price keeping above the 30-SMA. However, the price failed to make a higher high when bulls met the 1.3575 resistance level. Instead, it made a lower high and broke below the SMA to make a lower low. This pattern shows the beginning of a downtrend.
However, bears must keep the price below the SMA and respect it as a resistance. If this happens, the price will likely drop to retest the 1.3401 support level. On the other hand, if bulls regain momentum, the price will likely retest the 1.3575 resistance.
Looking to trade forex now? Invest at eToro!
67% of retail investor accounts lose money when trading CFDs with this provider. You should consider whether you can afford to take the high risk of losing your money.
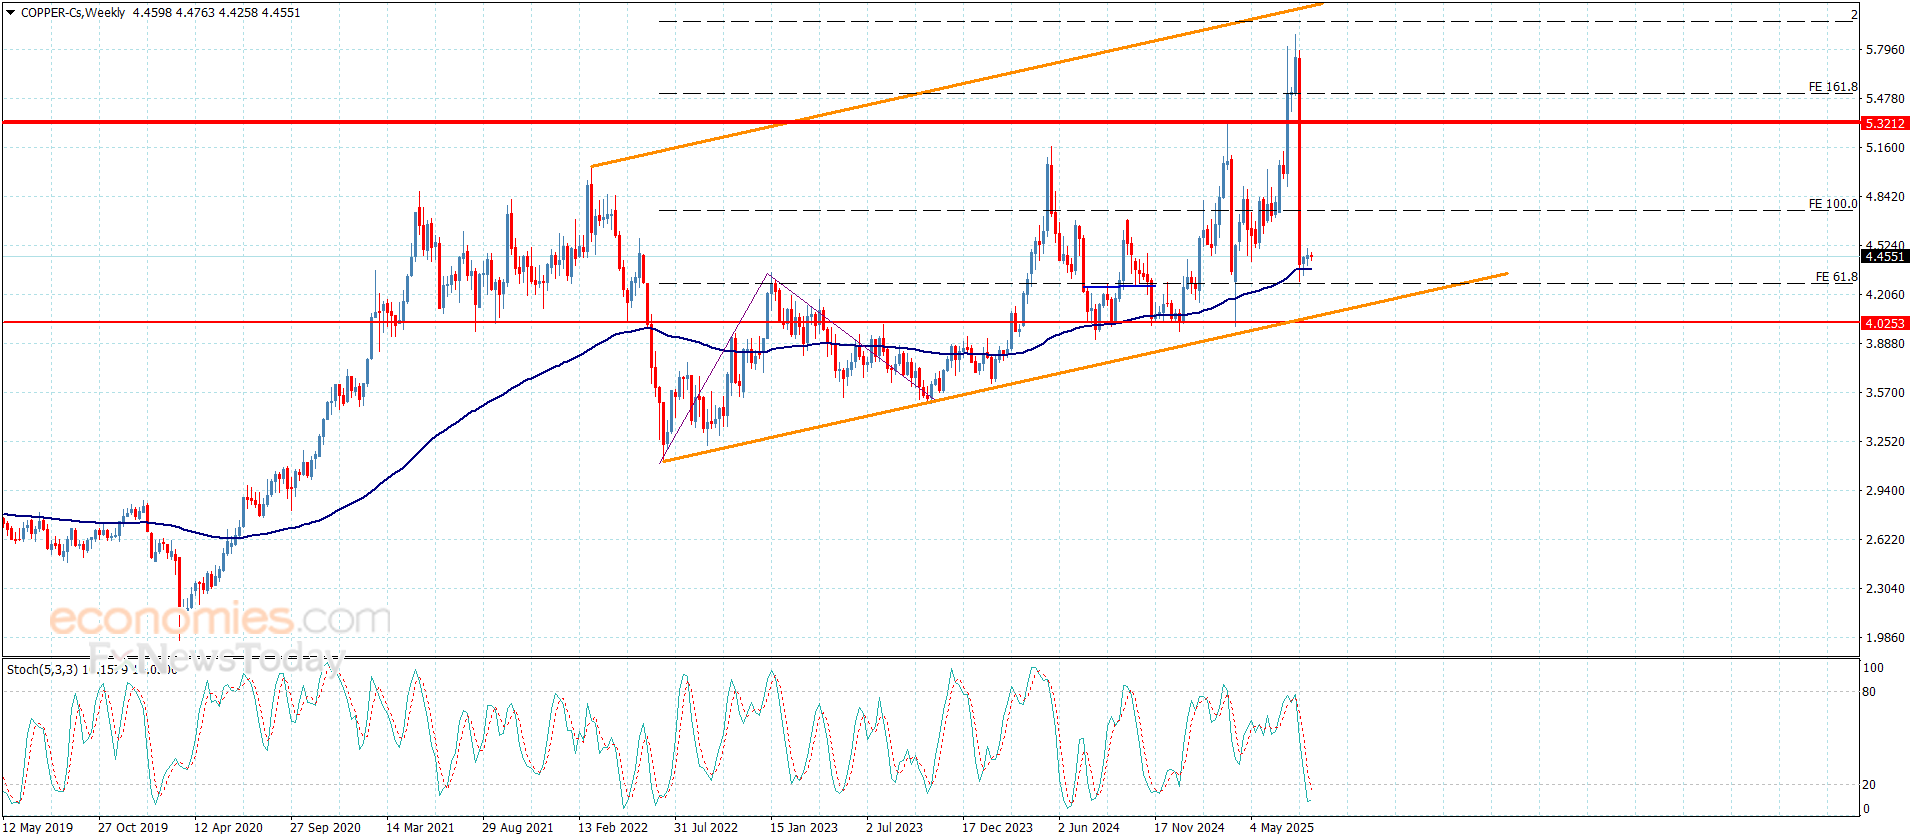
Copper price didn’t move anything, to keep providing slow sideways trading by its fluctuation near $4.4500, affected by the continuation of the main indicators’ contradiction, due to the stability of stochastic within the oversold level, to reduce the chances for renewing the suggested bullish attempts.
The stability above the extra support at $4.2600 assists to confirm the price confinement within the bullish track, to keep waiting for gathering the required positive momentum for reaching the positive stations near $4.6200 and $4.7400.
The expected trading range for today is between $4.330 and $4.6300
Trend forecast: Bullish

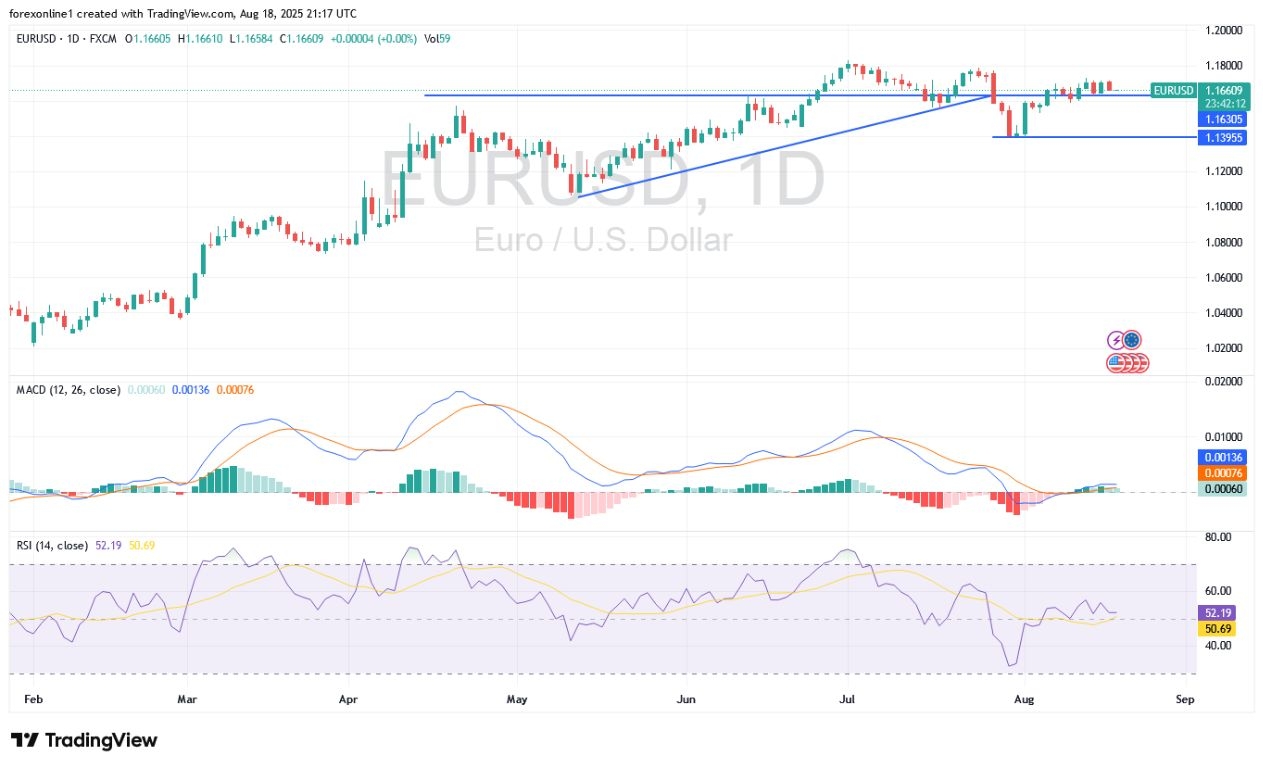
The EUR/USD pair is still trading in a limited, cautious, and neutral-to-bullish range. According to reliable trading platforms, the euro’s half-percent gain against the dollar last Friday was a strong reminder that the single currency continues to attract solid buying interest on any dips. As the EUR/USD heads for another climb in August, a move past the 1.1735 resistance, and from there to the psychological peak of 1.1800, is possible this week. Success, however, will depend on whether Ukraine and Russia make progress toward a peace agreement and whether Jerome Powell meets market expectations for a September rate cut.
According to forex trading experts, this week will be dominated by Ukrainian peace talks and Federal Reserve Chair Jerome Powell’s speech at the Jackson Hole Economic Symposium on Friday. Given these risks, the chart shows the EUR/USD pair is on the rise again. Our weekly forecast model is positive, as the EUR/USD is holding above the nine-day exponential moving average (EMA), which is currently at 1.1664 and rising. Above this level, our outlook for the week is positive. The Relative Strength Index (RSI) is also above 50, although it appears somewhat stable, which may reflect the consolidation we saw last week.
Overall, this consolidation in the rebound is embodied by the 61.8% and 78.6% Fibonacci retracement levels of the July and August declines. However, the move is upward, and we expect a breakout of the 1.1735 resistance level. To continue the upward trend, we need to break the 78.6% level, from which the July 24 high of 1.1788 becomes clear, followed by the psychological high of 1.1800.
Apart from technical analysis, we have some important risks to consider.
The first is the meeting at the beginning of the week between US President Donald Trump and Ukrainian President Volodymyr Zelensky. Markets are already anticipating progress, as volatility indicators have dropped significantly in recent days, which is expected to support the EUR/USD. The surge in oil and gas prices in the summer of 2022, and the negative terms-of-trade shock for the Eurozone, caused the EUR/USD pair to fall below parity. Unless the Ukraine-Russia negotiations completely collapse and Trump’s “excessive rapprochement” with Putin reverses, causing oil prices to rise, we believe favorable global conditions can prevent the EUR/USD from trending downwards.
On the economic front, according to the economic calendar, eurozone inflation data is due midweek and is expected to show that inflation is within the European Central Bank’s 2.0% target, although it would take a smaller-than-expected surprise to convince the market that the ECB will make further interest rate cuts going forward.
However, the surprise factor is fading, as all major European countries will have released their domestic data, meaning the eurozone-wide figure will already be expected. The surprise factor is likely to emerge in the August PMI survey, due next Thursday. The July PMI surprised markets with its rise, revealing the economy’s return to growth, boosting euro trading. A repeat performance could help it rise again.
However, the US dollar side is the most important factor for the EUR/USD relationship. All eyes are on Jackson Hole, Wyoming, on Friday, where Federal Reserve Chair Jerome Powell will speak. He is expected to confirm market expectations of a 25 basis point rate hike given the slowdown in US labor markets. However, he will likely dismiss hopes of a 50-basis point hike given that inflation remains elevated.
As is well known, Jackson Hole has a long history of significance for markets, as the Federal Reserve Chairman has consistently used his speech to signal shifts in monetary policy. At last year’s Jackson Hole Economic Symposium, Fed Chairman Powell sent a clear signal that it was time to begin cutting interest rates, followed by a larger 50 basis point cut at the FOMC meeting in September.
Last year, Powell said, “The time has come to adjust policy. The direction is clear,” with inflation remaining on a “sustainable path” toward its target.
At this month’s Jackson Hole Symposium, market participants will be listening closely to see if Chair Powell will endorse the pricing for a resumption of rate cuts next month. The risk is that Chair Powell refrains from giving a clear signal on the timing of the next rate cut, giving the Fed more time to continue assessing incoming data before the September FOMC meeting. Obviously, this could help to alleviate the downward pressure on the US dollar in the short term. However, analysts at ING Bank believe the speech will lean toward being cautious on the US dollar.
Trading Advice:
Traders on TradersUp are advised to avoid trading EUR/USD for now until the outcomes of the Russian-Ukrainian conflict-resolution meetings are clear, as these have the strongest impact on the euro’s trajectory against other major currencies.
Ready to trade our free daily Forex trading signals? We’ve shortlisted the best Forex trading brokers in the industry for you.
Copper price didn’t move anything, to keep providing slow sideways trading by its fluctuation near $4.4500, affected by the continuation of the main indicators’ contradiction, due to the stability of stochastic within the oversold level, to reduce the chances for renewing the suggested bullish attempts.
The stability above the extra support at $4.2600 assists to confirm the price confinement within the bullish track, to keep waiting for gathering the required positive momentum for reaching the positive stations near $4.6200 and $4.7400.
The expected trading range for today is between $4.330 and $4.6300
Trend forecast: Bullish
Copper price didn’t move anything, to keep providing slow sideways trading by its fluctuation near $4.4500, affected by the continuation of the main indicators’ contradiction, due to the stability of stochastic within the oversold level, to reduce the chances for renewing the suggested bullish attempts.
The stability above the extra support at $4.2600 assists to confirm the price confinement within the bullish track, to keep waiting for gathering the required positive momentum for reaching the positive stations near $4.6200 and $4.7400.
The expected trading range for today is between $4.330 and $4.6300
Trend forecast: Bullish
The $37.51 support zone aligns closely with an uptrend line and the 50-Day moving average, currently at $37.33. This convergence provides a key lower boundary for the bull trend. A breakdown below $37.51 could trigger weakness, but the 50-Day line is likely to act as significant dynamic support if tested, limiting downside momentum. Notably, silver successfully tested this moving average as support across three consecutive sessions recently, reinforcing its importance.
On the upside, resistance remains clearly defined at the $38.74 swing high. That level completed a 78.6% Fibonacci retracement of the most recent short-term advance, and so far, has ended attempts at recovering that level. Until silver can close decisively above $38.74, upward momentum remains limited, leaving the consolidation pattern intact. Traders will be watching closely to see which side of the $37.33–$38.74 band is resolved first.
The broader technical backdrop also carries weight. Silver continues to trade within a large ascending parallel channel that has guided price swings since early 2024. The upper boundary of that channel, which capped rallies in October and again earlier this year, when price briefly broke above the top line before falling back, remains an important marker of potential resistance. Historically, once a reversal occurs from one boundary of the channel, momentum often swings toward the opposite side.
While this remains only a possibility, it highlights the potential for downside pressure should silver fail to hold the 50-Day moving average. A sustained close below $37.33 would increase the likelihood of a deeper retracement within the channel. Until then, traders face a waiting game, as silver remains trapped between Fibonacci resistance above and moving average support below.
For a look at all of today’s economic events, check out our economic calendar.
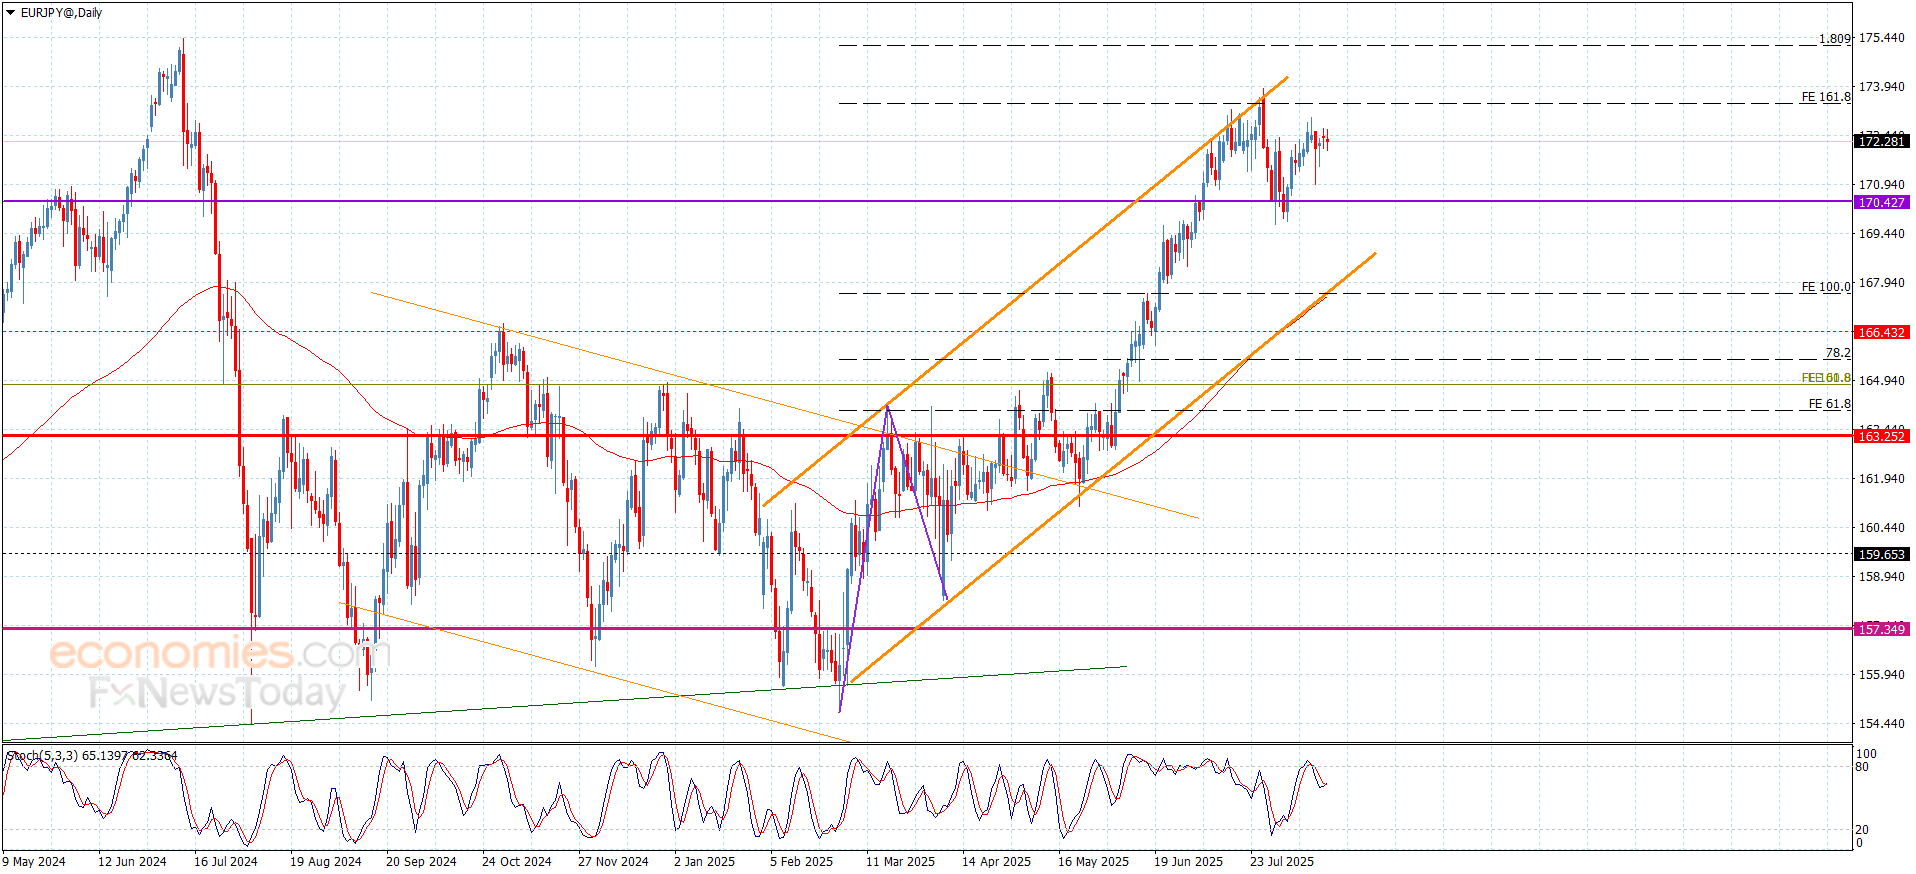
Despite the stability of the EURJPY pair within the bullish channel’s levels and its fluctuation above the extra support at 172.00, but we notice forming sideways fluctuation by its stability near 172.35 due to stochastic exit from the overbought level and providing negative momentum, to contradict with the suggested bullish scenario.
The stability of the price above the extra support will make it renew the bullish attempts, to target 173.20 and 173.55 level, while the decline below the support will force it to activate the bearish correctional track again, waiting for attacking 170.40 level, which represents the line of confirming the expected trend on the medium period trading.
The expected trading range for today is between 172.00 and 173.55
Trend forecast: Bullish
Despite the stability of the EURJPY pair within the bullish channel’s levels and its fluctuation above the extra support at 172.00, but we notice forming sideways fluctuation by its stability near 172.35 due to stochastic exit from the overbought level and providing negative momentum, to contradict with the suggested bullish scenario.
The stability of the price above the extra support will make it renew the bullish attempts, to target 173.20 and 173.55 level, while the decline below the support will force it to activate the bearish correctional track again, waiting for attacking 170.40 level, which represents the line of confirming the expected trend on the medium period trading.
The expected trading range for today is between 172.00 and 173.55
Trend forecast: Bullish
– Written by
David Woodsmith
STORY LINK Can GBP/USD Hit Fresh 5-Week Highs? Pound to Dollar Forecast
The Pound to Dollar exchange rate (GBP/USD) has continued to be held below the 1.3600 resistance area and traded around 1.3550 in European trading on Monday.
According to UoB; “The price movements still appear to be part of a consolidation phase, most likely between 1.3520 and 1.3585.”
It still sees scope for GBP/USD to hit 5-week highs above 1.3620 once the consolidation phase is completed.
ING maintains a positive Pound stance; “Some sticky UK inflation for July looks unlikely to alter the market’s view of the BoE over the coming days. This should keep GBP/USD bid this week, where a break of 1.3585/3600 could see 1.3680/3700 by the end of the week.”
Overall volatility levels remain subdued while equity markets globally have held firm which should help underpin the Pound in global markets.
ING pointed to benign risk conditions; “Without much fanfare, Chinese benchmark equity markets are pushing up to the highest levels in a decade as investors seem happy to look through the impact of tariffs and welcome the prospect of stronger domestic demand in the Rest of the World – powered by rate cuts and looser fiscal policy.”

It added; “With risk assets bid and energy prices offered, we expect the dollar to stay under a little pressure as dollar-based investors continue to put money to work.”
One key economic event will be Fed Chair Powell’s speech on Friday at the Jackson Hole economic symposium.
Markets will be expecting hints over the September policy decision.
Traders are now pricing in around a 15% chance that the Fed will not cut rates at the September meeting and Powell’s comments will be crucial for those expectations.
According to ING; “it may be too early for Powell to all but confirm a Fed rate cut in September. Yet when the facts of a ‘solid’ labour market change, Powell will have to acknowledge it.”
Commonwealth Bank of Australia head of international and sustainable economics Joseph Capurso commented; “Given market pricing is very high for a rate cut in September, I think the risk is that Powell is hawkish, or is perceived to be hawkish, if he gives a balanced view of the U.S. economy.”
As far as the UK is concerned, the latest inflation data will be released on Wednesday.

Consensus forecasts are for the headline rate to increase slightly to 3.7% from 3.6% the previous month with the core rate holding at 3.7%.
The data on the services sector will be a key element for expectations surrounding Bank of England (BoE) interest rates.
According to MUFG; “The recent hawkish shift in BoE policy communication has been triggered by concerns over the risk of more persistently higher inflation in the UK.”
International Money Transfer? Ask our resident FX expert a money transfer question or try John’s new, free, no-obligation personal service! ,where he helps every step of the way,
ensuring you get the best exchange rates on your currency requirements.
TAGS: Pound Dollar Forecasts
The short-term picture highlights the 20-Day moving average as a critical resistance line, now sitting near $3.02. A decisive move above today’s $2.92 high would be encouraging, but the real short-term test remains Friday’s $2.97 peak. That level coincided with an anchored VWAP (AVWAP) measured from the long-term 2024 bottom – a line that previously provided support on two occasions during bearish corrections the past year. Its breakdown last week and subsequent test as resistance signals a shift in market control back to sellers. For now, the AVWAP at $2.96 and the declining 20-Day average create a tight overhead resistance zone.
Reclaiming the 20-Day line is essential for bulls to regain momentum, and even then, natural gas would quickly confront another key barrier at the lower swing high of $3.15. A sustained rally above this zone would signal a potential bullish reversal. Until then, the broader structure still leans bearish, with rallies facing headwinds from declining averages and confirmed resistance zones.
On the downside, a drop below Monday’s $2.80 low would indicate fresh weakness, but a confirmed continuation only unfolds if the $2.76 support gives way on a daily close. Should that occur, attention turns to Fibonacci-based targets tied to an extended ABCD pattern from the March peak. The large ABCD projects a 78.6% extension aligning near $2.51, which also matches a 78.6% retracement and a 127.2% target from a smaller ABCD formation. This confluence strengthens the case for $2.51 as the next major bearish objective if support fails.
For a look at all of today’s economic events, check out our economic calendar.