The main category of Forex News.
You can use the search box below to find what you need.
[wd_asp id=1]
The main category of Forex News.
You can use the search box below to find what you need.
[wd_asp id=1]
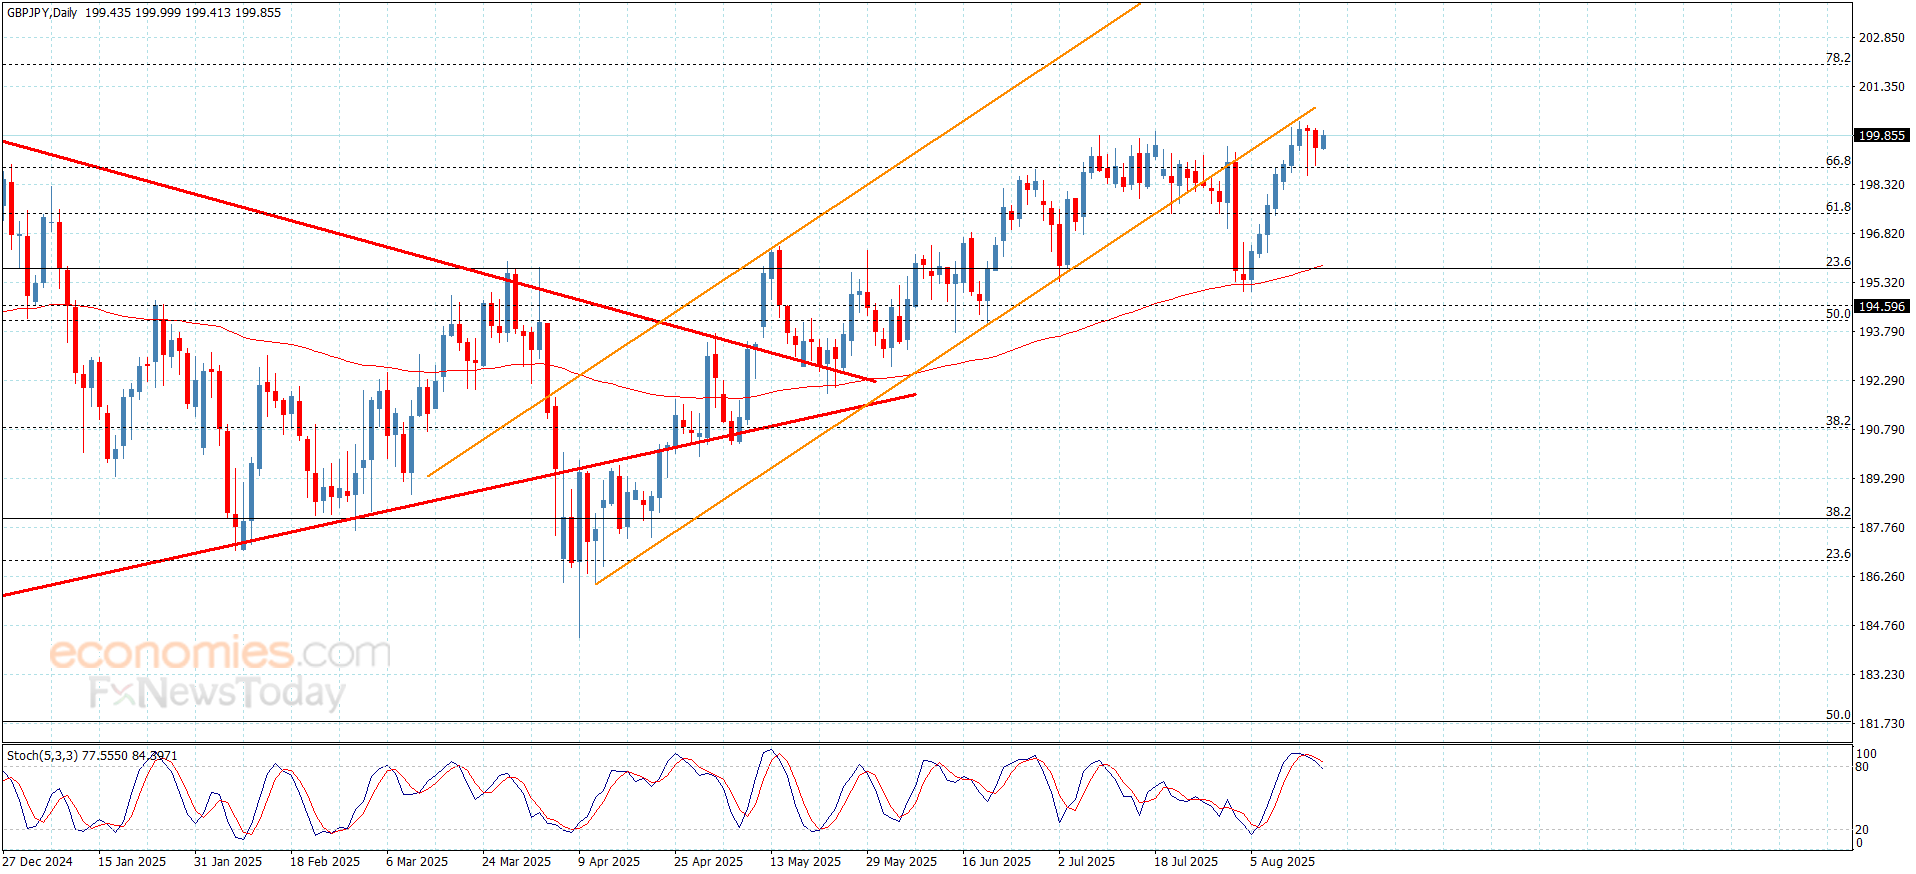
The GBPJPY pair failed to resume the bearish correctional attack, affected by forming an obstacle at 66.8%Fibonacci correction level at 198.80, forcing it to provide mixed trading by its stability near 199.90.
Note that regaining bullish bias will be by breaching the resistance at 200.65, while holding below it and stochastic attempt to exit the overbought level confirms the dominance of the sideways bias in the current period, to expect the trading confinement between the mentioned main levels, to keep monitoring the price behavior to confirm the trend by surpassing these levels.
The expected trading range for today is between 198.85 and 200.60
Trend forecast: Sideways
(Brent) price declined in its last trading on the intraday levels, amid its trading alongside a minor bearish trend line, indicating the dominance of this negative track, especially with the continuation of the negative track, especially with the continuation of the negative pressure, due to its trading below EMA50, besides the emergence of the negative signals on the (RSI), after reaching overbought levels.
BestTradingSignal.com – Professional Trading Signals with high accuracy. Subscribe now to tailored packages for the world’s leading markets and receive signals instantly via Telegram from an expert team:
Check full VIP signals performance report for the week of August 11–15, 2025: Full Report
The GBPJPY pair failed to resume the bearish correctional attack, affected by forming an obstacle at 66.8%Fibonacci correction level at 198.80, forcing it to provide mixed trading by its stability near 199.90.
Note that regaining bullish bias will be by breaching the resistance at 200.65, while holding below it and stochastic attempt to exit the overbought level confirms the dominance of the sideways bias in the current period, to expect the trading confinement between the mentioned main levels, to keep monitoring the price behavior to confirm the trend by surpassing these levels.
The expected trading range for today is between 198.85 and 200.60
Trend forecast: Sideways
The Gold price (XAU/USD) attracts some sellers to around $3,330 during the early Asian session on Monday. The precious metal edges lower after unexpectedly strong US Producer Price Index (PPI) data. Investors will closely monitor a meeting between US President Donald Trump and Ukrainian President Volodymyr Zelenskiy later on Monday for further developments.
Hotter-than-expected PPI inflation data released on Thursday prompted traders to trim wagers on rate cuts by the Federal Reserve (Fed) in September, which creates a headwind for the yellow metal. The US Producer Price Index (PPI) rose 3.3% YoY in July, versus the 2.4% increase prior. This reading came in stronger than the expectations of 2.5% by a wide margin.
Furthermore, data released by the US Census Bureau on Friday showed that the US Retail Sales increased by 0.5% MoM in July, versus a rise of 0.9% seen in June (revised from 0.6%). This reading came in line with the market consensus.
However, the cautious mood in the market might boost the safe-haven flows and help limit gold’s losses. Bloomberg reported on Sunday that US special envoy Steve Witkoff said that Trump and Russian President Vladimir Putin agreed on Ukraine security pledges.
Witkoff further stated that the deal did not enable Ukraine to achieve its goal of NATO membership, as Russia objected to NATO admission. Gold traders will take more cues from the Trump and Zelenskiy meeting later in the day as details from the US-Russia talks remain unclear.
Gold has played a key role in human’s history as it has been widely used as a store of value and medium of exchange. Currently, apart from its shine and usage for jewelry, the precious metal is widely seen as a safe-haven asset, meaning that it is considered a good investment during turbulent times. Gold is also widely seen as a hedge against inflation and against depreciating currencies as it doesn’t rely on any specific issuer or government.
Central banks are the biggest Gold holders. In their aim to support their currencies in turbulent times, central banks tend to diversify their reserves and buy Gold to improve the perceived strength of the economy and the currency. High Gold reserves can be a source of trust for a country’s solvency. Central banks added 1,136 tonnes of Gold worth around $70 billion to their reserves in 2022, according to data from the World Gold Council. This is the highest yearly purchase since records began. Central banks from emerging economies such as China, India and Turkey are quickly increasing their Gold reserves.
Gold has an inverse correlation with the US Dollar and US Treasuries, which are both major reserve and safe-haven assets. When the Dollar depreciates, Gold tends to rise, enabling investors and central banks to diversify their assets in turbulent times. Gold is also inversely correlated with risk assets. A rally in the stock market tends to weaken Gold price, while sell-offs in riskier markets tend to favor the precious metal.
The price can move due to a wide range of factors. Geopolitical instability or fears of a deep recession can quickly make Gold price escalate due to its safe-haven status. As a yield-less asset, Gold tends to rise with lower interest rates, while higher cost of money usually weighs down on the yellow metal. Still, most moves depend on how the US Dollar (USD) behaves as the asset is priced in dollars (XAU/USD). A strong Dollar tends to keep the price of Gold controlled, whereas a weaker Dollar is likely to push Gold prices up.
The U.S. Energy Information Administration (EIA) cut its Brent spot average crude oil price forecast for 2025 and 2026 in its latest short term energy outlook (STEO), which was released on August 12.
According to that STEO, the EIA sees the Brent spot price averaging $67.22 per barrel this year and $51.43 per barrel next year. In its previous STEO, which was released in July, the EIA projected that the Brent spot price would average $68.89 per barrel in 2025 and $58.48 per barrel in 2026.
The EIA revealed in its latest STEO that it sees the Brent spot price average coming in at $67.40 per barrel in the third quarter of this year, $58.05 per barrel in the fourth quarter, $49.97 per barrel in the first quarter of next year, $49.67 per barrel in the second quarter, $52 per barrel in the third quarter, and $54 per barrel in the fourth quarter.
In its previous July STEO, the EIA projected that the Brent spot price would average $68.02 per barrel in the third quarter of 2025, $64.02 per barrel in the fourth quarter, $60 per barrel in the first quarter of 2026, $59 per barrel in the second quarter, $58 per barrel in the third quarter, and $57 per barrel in the fourth quarter.
Both STEOs highlighted that the Brent spot price averaged $80.56 per barrel in 2024.
“Significant growth in oil supply will cause crude oil prices to fall in the coming months,” the EIA warned in its August STEO.
“In our forecast, the Brent crude oil spot price falls from $71 per barrel in July to $58 per barrel in 4Q25 and $49 per barrel in March and April 2026,” it added.
“On August 3, OPEC+ members again agreed to accelerate their scheduled production increases. The 2.2 million barrels per day of production cuts announced in November 2023 and initially scheduled to be fully unwound by September 2026 will now be fully unwound by September of this year,” the EIA pointed out in its STEO.
“We expect this increase will contribute to large inventory builds through 2026, putting significant downward pressure on oil prices,” it continued.
In its STEO, the EIA said it now forecasts global liquid fuels production will rise by 2.0 million barrels per day on average in the second half of 2025, compared with the first half of the year.
“OPEC+ will contribute half of this increase. Non-OPEC producers led by the United States, Brazil, Norway, Canada, and Guyana provide the other half,” the EIA said in the STEO.
“At the same time, we expect global liquid fuels demand in 2H25 will be up 1.6 million barrels per day from the first six months of the year, meaning the pace at which oil is put into inventory will accelerate by almost 0.5 million barrels per day in 2H25,” it added.
“With inventories already building at a rate of 1.4 million barrels per day in 1H25, we now expect inventories will build by 1.9 million barrels per day in 2H25 and 2.3 million barrels per day in the first quarter of 2026,” it continued.
“During similar periods when global inventory builds exceeded one million barrels per day for a sustained time period – including 2020, 2015, and 1998 – crude oil prices declined by 25 percent – 50 percent from the previous year,” it went on to state.
The EIA noted in its August STEO that inventory builds of this size will cause market participants to seek increasingly expensive options for storing crude oil.
“As available commercial storage on land fills, other methods such as floating storage or strategic stock building might be increasingly used to match large imbalances between supply and demand,” the EIA said.
“In this case, crude oil prices will fall to reflect the higher marginal cost of storage,” it pointed out.
The EIA went on to state in its STEO that it expects that prices dropping below $50 per barrel will cause some producers to reduce supply.
“Particularly, we expect that OPEC+ will reduce crude oil production by 0.2 million barrel per day in 2026 compared with 4Q25. Some non-OPEC countries that rely on supply from short-investment cycles will also see oil production drop,” the EIA said.
“Most notable among these countries is the United States, where we expect annual average crude oil production in 2026 will decrease 0.1 million barrels per day on average from the record in 2025,” it added.
Falling oil prices will also cause a small increase in demand in 2026, the EIA noted in its August STEO.
“Combined with the slowdown in supply, we expect inventory builds will moderate slightly. Inventory builds in our forecast fall to near one million barrels per day in 2H26, which we expect will push the Brent price back to an average of $54 per barrel in 4Q26,” it added.
The EIA warned in its STEO that “significant uncertainty” is still present in its price forecast.
A report sent to Rigzone on Tuesday by the Standard Chartered team showed that Standard Chartered is projecting that the ICE Brent nearby future crude oil price will average $61 per barrel in 2025 and $78 per barrel in 2026.
In that report, the company predicted that the commodity will average $65 per barrel in the fourth quarter of 2025, $71 per barrel in the first quarter of next year, $76 per barrel in the second quarter, $81 per barrel in the third quarter, and $83 per barrel in the fourth quarter.
A J.P. Morgan research note sent to Rigzone by the JPM Commodities Research team on Monday showed that J.P. Morgan sees the Brent crude price averaging $66 per barrel this year and $58 per barrel next year.
J.P. Morgan projected in that note that the commodity will average $63 per barrel in the third quarter, $61 per barrel in the fourth quarter, $55 per barrel in the first quarter of next year, $57 per barrel across the second and third quarters, and $60 per barrel in the fourth quarter.
To contact the author, email andreas.exarheas@rigzone.com
– Written by
David Woodsmith
STORY LINK Euro to US Dollar Forecast: EUR/USD’s “Upward Momentum has Faded”
The Euro to Dollar exchange rate (EUR/USD) posted net gains on Friday, reversing the bulk of Thursday’s losses as the dollar was subjected to fresh selling.
Despite higher-than-expected inflation data on Thursday, markets remain confident that the Fed will cut rates next month, while pressure on the Fed continues.
The Trump-Putin talks will be monitored closely with some hopes for progress on the Ukraine situation helping to underpin the Euro.
UoB was not expecting a retreat below 1.1645, although there was only a brief excursion below this level.
It added; “The breach of the ‘strong support’ indicates that upward momentum has faded. The current price movements are likely part of a consolidation phase between 1.1585 and 1.1705.”
Scotiabank remains generally positive on the pair; “The EUR’s broader August rebound remains intact, with the market carving out a succession of higher highs and higher lows following the brief August 1 dip under 1.14. Support intraday is 1.1640, ahead of 1.1590/00. A push through this week’s high at 1.1730 should pave the way for a retest of the upper 1.17s.”
The dollar was helped in part by stronger-than-expected wholesale price inflation data on Thursday.

Headline prices increased 3.3% in the year to July from 2.4% previously and well above consensus forecasts of 2.5 while core inflation increased sharply to 3.7% from 2.6%.
Scotiabank commented; “Yesterday’s unexpectedly large US PPI gains indicated that business margins are increasing, which is perhaps not what would be expected if tariffs were being absorbed. That may mean that higher retail prices become more apparent shortly.”
MUFG added; “Overall, the report has provided support for the US dollar by dampening expectations for more aggressive Fed easing but is unlikely on its own to reverse the current weakening trend for the US dollar in the near-term.”
Markets are still extremely confident that the Fed will cut rates at the September meeting with traders still pricing in over a 90% chance of a cut, although talk of a larger 50 basis-point cut has faded dramatically.
The Fed still faces a tough underlying decision.
According to Joseph Carpuso, head of international economics at the Commonwealth Bank of Australia; “The combination of elevated inflation and weak growth in jobs is a conundrum for the Fed.”
Scotiabank added; “If the Fed does opt to ease amid intense political pressure for lower rates and stubborn inflation, investors may become more concerned that the Fed’s inflation anchor is slipping which can only weaken the appeal of the USD.”

Friday’s data recorded a 0.5% increase in retail sales for July, marginally below consensus forecasts of a 0.6% gain for the month while core sales met expectations with a 0.3% increase.
The New York Empire manufacturing survey improved to 11.9 for August from 5.5 previously and compared with expectations of a -1.
International Money Transfer? Ask our resident FX expert a money transfer question or try John’s new, free, no-obligation personal service! ,where he helps every step of the way,
ensuring you get the best exchange rates on your currency requirements.
TAGS: Euro Dollar Forecasts
– Written by
Tim Boyer
STORY LINK Pound to Dollar Forecast: GBP/USD Unable to Break Resistance Levels
The Pound to Dollar exchange rate (GBP/USD) found support above 1.35 on Thursday and advanced to 1.3565 after Friday’s New York open as the dollar failed to hold Thursday’s gains.
There was a limited retreat for the FTSE 100 index, although overall risk appetite held firm while volatility levels remain contained.
The Pound will tend to perform well if risk appetite holds firm.
UBS commented; “For the time being, we think the GBP can outperform against peers on a total return basis thanks to its attractive carry proposition.
UoB expects narrow ranges will prevail; “Outlook for GBP remains positive, and it may rise to 1.3620; the chances of it reaching 1.3660 this time around are more limited.”
According to Scotiabank; “Sterling is firmer on the session but yesterday’s peak and minor reversal from the 1.3595 area warrants attention as the pound topped out at a similar point in late July.
It added; “Cable has put together a solid run of gains since basing in early August but spot needs to push on through to a 1.36 handle to extend gains.”
Scotiabank added; “The pound is lagging some of its G10 peers somewhat this morning but has had a solid week overall, rising against the USD and EUR, as markets rethink the outlook for UK monetary policy after last week’s BoE decision.”
The latest UK inflation data will be released next week and will be significant for near-term Bank of England policy expectations.
Berenberg now has a more positive outlook on the UK economy and does not expect further Bank of England rate cuts, potentially underpinning the Pound.
According to the bank; “Forward looking measures of real interest rates are below pre-financial crisis. Assuming that the neutral real interest rate has rebounded from its 2010s nadir, monetary policy may not be overly restrictive now. Indeed, rising company and household inflation expectations were one reason why the BoE became more hawkish last week. We expect the central bank to pause its cutting cycle with bank rate at 4.00% until 2026.”
Federal Reserve policy will remain a key market influence. Markets remain convinced that the Fed will cut rates in September, but expectations of a 50 basis-point cut have dipped sharply following recent firm data.
Thursday’s US producer prices data was stronger than expected and indicated that there would be more serious upward pressure on consumer prices over the next few months.
US retail sales increased 0.5% for July, marginally below consensus forecasts of a 0.6% advance with a 0.3% increase in core sales.
The New York Empire manufacturing index improved further to 11.9 for August from 5.5 the previous month and well above market expectations of -1.0.
There were weaker readings for employment while inflation pressures increased slightly.
International Money Transfer? Ask our resident FX expert a money transfer question or try John’s new, free, no-obligation personal service! ,where he helps every step of the way,
ensuring you get the best exchange rates on your currency requirements.
Important DisclaimersThe content provided on the website includes general news and publications, our personal analysis and opinions, and contents provided by third parties, which are intended for educational and research purposes only. It does not constitute, and should not be read as, any recommendation or advice to take any action whatsoever, including to make any investment or buy any product. When making any financial decision, you should perform your own due diligence checks, apply your own discretion and consult your competent advisors. The content of the website is not personally directed to you, and we does not take into account your financial situation or needs.The information contained in this website is not necessarily provided in real-time nor is it necessarily accurate. Prices provided herein may be provided by market makers and not by exchanges.Any trading or other financial decision you make shall be at your full responsibility, and you must not rely on any information provided through the website. FX Empire does not provide any warranty regarding any of the information contained in the website, and shall bear no responsibility for any trading losses you might incur as a result of using any information contained in the website.The website may include advertisements and other promotional contents, and FX Empire may receive compensation from third parties in connection with the content. FX Empire does not endorse any third party or recommends using any third party’s services, and does not assume responsibility for your use of any such third party’s website or services.FX Empire and its employees, officers, subsidiaries and associates, are not liable nor shall they be held liable for any loss or damage resulting from your use of the website or reliance on the information provided on this website.Risk DisclaimersThis website includes information about cryptocurrencies, contracts for difference (CFDs) and other financial instruments, and about brokers, exchanges and other entities trading in such instruments. Both cryptocurrencies and CFDs are complex instruments and come with a high risk of losing money. You should carefully consider whether you understand how these instruments work and whether you can afford to take the high risk of losing your money.FX Empire encourages you to perform your own research before making any investment decision, and to avoid investing in any financial instrument which you do not fully understand how it works and what are the risks involved.
The lower boundary of the triangle is reinforced by the 20-week moving average (not shown), now at $3,310 on the weekly chart. This average was reclaimed in early January and has since acted as potential dynamic support. In July, it aligned with a swing low that sparked a bullish weekly reversal and proved itself as a support line.
This alignment creates a significant confluence of support between $3,303 and $3,310. A clean break below both the lower boundary and the 20-week moving average would carry greater weight, potentially triggering a stronger downside reaction. In that case, a test of the May swing lows and the 38.2% retracement would become increasingly likely, and the odds of falling below that zone would rise.
Gold’s price action remains confined within a tightening consolidation, with each swing high and low narrowing toward the triangle’s apex. This suggests that a resolution — either bullish or bearish — is approaching.
On the upside, a breakout is triggered on a move above the $3,438 swing high. Such a move would signal bullish trend continuation and could pave the way for a retest of $3,500. On the downside, the first trigger is a drop through the lower boundary line, followed by a break below $3,268 to confirm a bearish breakout. Until then, gold’s consolidation reflects a market in balance, but the proximity to major technical levels hints that this balance may not hold much longer.
For a look at all of today’s economic events, check out our economic calendar.
The euro rallied a bit during the trading session here on Friday, as we have seen quite a bit of US dollar weakness around the world. That being said, we’re still just chopping back and forth. There’s no real directionality in the short term, but over the long term, obviously, the euro had been quite a bit more bullish than the US dollar. Recently, we had formed a double top at the 1.18 level, so that is worth paying attention to, and we are below there. So, we’ll see. I think this is a market that’s still trying to make a few decisions.
The dollar has dropped against the Japanese yen to test the 50-day EMA, but it is starting to show signs of support. If we can turn around and break above that 148 yen level, then I’d be much more comfortable with my long position, but you do get paid to hang on to it, and I have been in this for a while, so that does help. A break above the 148 yen level, I believe, opens up a move to about 150.50 yen. If we break down below here, then the 146 yen level is support, right along with the 145 yen level.