The main category of Forex News.
You can use the search box below to find what you need.
[wd_asp id=1]
The main category of Forex News.
You can use the search box below to find what you need.
[wd_asp id=1]
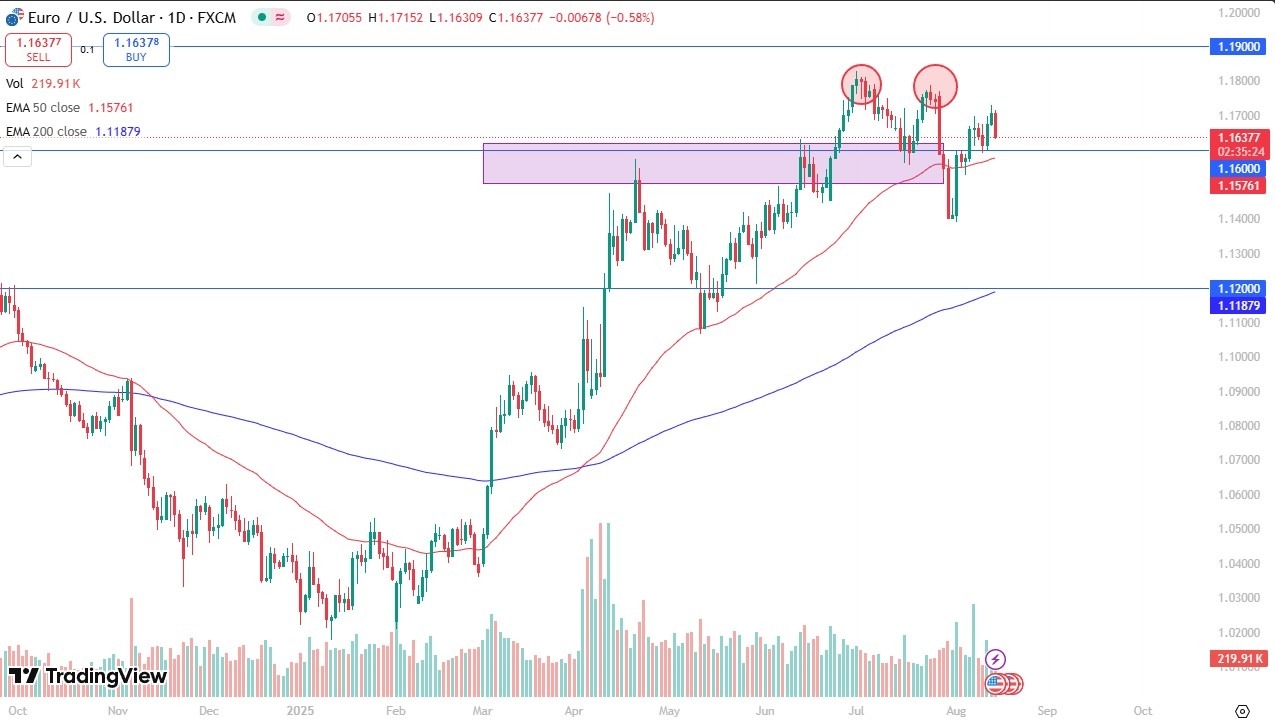
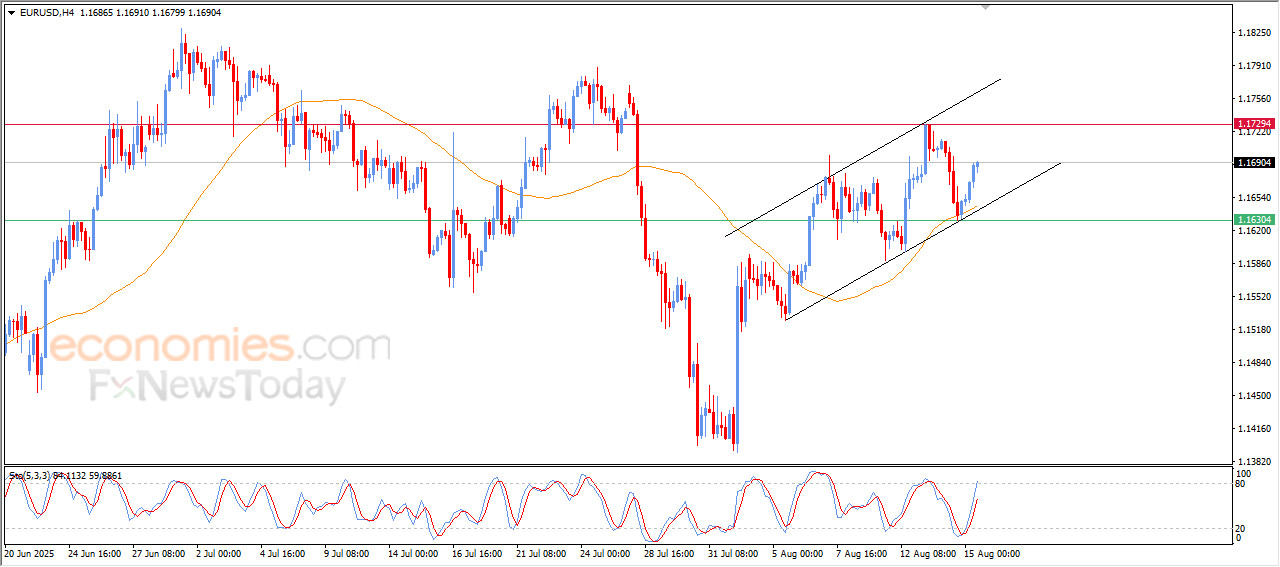
The euro rallied a bit during the trading session here on Friday, as we have seen quite a bit of US dollar weakness around the world. That being said, we’re still just chopping back and forth. There’s no real directionality in the short term, but over the long term, obviously, the euro had been quite a bit more bullish than the US dollar. Recently, we had formed a double top at the 1.18 level, so that is worth paying attention to, and we are below there. So, we’ll see. I think this is a market that’s still trying to make a few decisions.
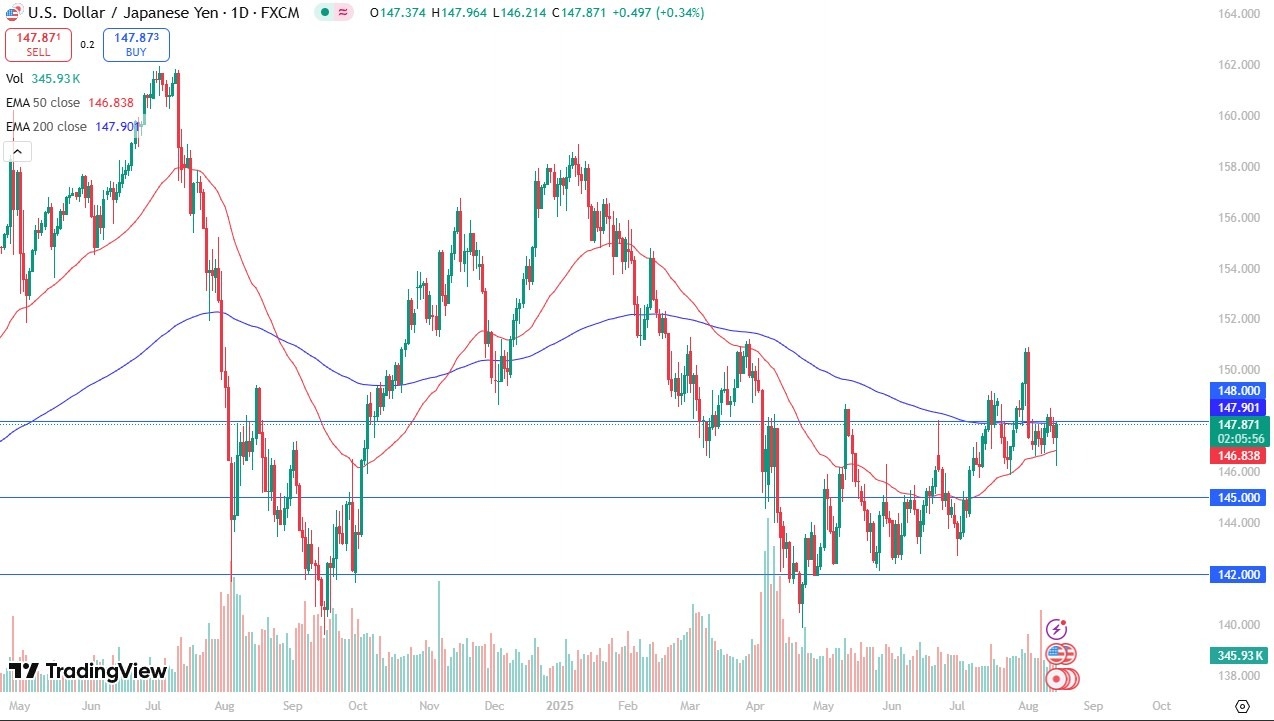
The dollar has dropped against the Japanese yen to test the 50-day EMA, but it is starting to show signs of support. If we can turn around and break above that 148 yen level, then I’d be much more comfortable with my long position, but you do get paid to hang on to it, and I have been in this for a while, so that does help. A break above the 148 yen level, I believe, opens up a move to about 150.50 yen. If we break down below here, then the 146 yen level is support, right along with the 145 yen level.
If we break down below the 50 day EMA, then that could send the Euro even lower, perhaps back down, and to the 1.14 level and anything below there, think could call the top.

I think there are a lot of questions out there as to what the federal reserve can do going forward. And one of the federal reserve governors came out today and even suggested that the idea of a half point or a half percent rate cut was validated, was completely wrong by the data that the U S economy is currently producing. If that is the case, things could get rather ugly pretty quickly for the Euro because money will come right back towards the U S because the U S dollar has been so oversold.
Ultimately, this is what I’m waiting to see. I don’t want to buy the Euro. And if I did short the U S dollar, it won’t be against the Euro. At this point, we’re in a little bit of a holding pattern. We are consolidating in an area that I think we may need to make a decision from, but this chart just got quite a bit more interesting.
Ready to trade our EUR/USD analysis and predictions? Here are the best European brokers to choose from.
Christopher Lewis has been trading Forex and has over 20 years experience in financial markets. Chris has been a regular contributor to Daily Forex since the early days of the site. He writes about Forex for several online publications, including FX Empire, Investing.com, and his own site, aptly named The Trader Guy. Chris favours technical analysis methods to identify his trades and likes to trade equity indices and commodities as well as Forex. He favours a longer-term trading style, and his trades often last for days or weeks.
Friday’s bounce has not changed the bigger picture. Natural gas will log a fourth consecutive week of lower weekly highs and lows, highlighting persistent selling pressure. A bearish continuation signal triggered this week as prices fell through the April swing low. That decline also pierced a long-term support zone where an anchored volume weighted average price (AVWAP) from the 2024 trend low converged with a long-term uptrend line. This line formed the lower boundary of an ascending parallel trend channel, giving the breakdown added significance.
Support near the AVWAP level at $2.96 held for several weeks but failed to produce a meaningful rally. With the breakdown confirmed, downside targets remain intact. Below this week’s trend low of $2.764, the next potential target sits at $2.79, completing a 100% projection of a falling ABCD pattern. This would match the size of the second downswing to the first. If weakness extends further, the 78.6% Fibonacci retracement at $2.54 becomes the next major level to watch, and given the strength of recent bearish signals, this deeper target is possible.
The 20-Day moving average is accelerating lower and is close to crossing beneath the long-term uptrend line. At $3.04, it marks the top of a potential resistance zone starting at the AVWAP line near $2.96. Resistance was seen today at the bottom of that $2.96–$3.04 band and it may serve as a key pivot area where sellers could reassert control, keeping the prevailing downtrend intact. Also, the top of the range would be a upside target for now if today’s bullish price action can continue in the short-term.
For a look at all of today’s economic events, check out our economic calendar.
EUR/JPY loses ground for the third consecutive day, trading around 171.80 during the European hours on Friday. The technical analysis of the daily chart suggests a prevailing bullish bias as the currency cross remains within the ascending channel pattern.
The 14-day Relative Strength Index (RSI) is positioned above the 50 mark, suggesting the bullish bias is active. However, the short-term price momentum is weaker as the EUR/JPY cross moved below the nine-day Exponential Moving Average (EMA).
The EUR/JPY cross could test the immediate barrier at the nine-day EMA of 171.95. A break above this level would strengthen short-term price momentum and support the currency cross to approach the upper boundary of the ascending channel around 173.60, followed by 173.90, the highest since July 2024, recorded on July 28, 2025.
On the downside, the EUR/JPY cross may test the crucial support level at 171.50, followed by the ascending channel’s lower boundary around 171.10 and the psychological level of 171.00. A break below this crucial support zone would put downward pressure on the pair to test the 50-day EMA at 170.09, followed by the six-week low at 169.72, which was recorded on July 31. Further declines would prompt the currency cross to reach the two-month low at 168.46, registered on July 1.
The table below shows the percentage change of Euro (EUR) against listed major currencies today. Euro was the weakest against the Japanese Yen.
| USD | EUR | GBP | JPY | CAD | AUD | NZD | CHF | |
|---|---|---|---|---|---|---|---|---|
| USD | -0.25% | -0.16% | -0.54% | -0.15% | -0.28% | -0.13% | -0.20% | |
| EUR | 0.25% | 0.09% | -0.21% | 0.09% | -0.06% | 0.11% | 0.05% | |
| GBP | 0.16% | -0.09% | -0.28% | 0.00% | -0.15% | 0.02% | -0.04% | |
| JPY | 0.54% | 0.21% | 0.28% | 0.30% | 0.17% | 0.37% | 0.24% | |
| CAD | 0.15% | -0.09% | -0.00% | -0.30% | -0.08% | 0.02% | -0.04% | |
| AUD | 0.28% | 0.06% | 0.15% | -0.17% | 0.08% | 0.10% | 0.11% | |
| NZD | 0.13% | -0.11% | -0.02% | -0.37% | -0.02% | -0.10% | -0.06% | |
| CHF | 0.20% | -0.05% | 0.04% | -0.24% | 0.04% | -0.11% | 0.06% |
The heat map shows percentage changes of major currencies against each other. The base currency is picked from the left column, while the quote currency is picked from the top row. For example, if you pick the Euro from the left column and move along the horizontal line to the US Dollar, the percentage change displayed in the box will represent EUR (base)/USD (quote).
GBP/USD finds support and trades marginally higher on the day near 1.3550 after posting losses on Thursday. As markets await the next batch of macroeconomic data releases from the US, the pair’s near-term technical outlook suggests that the bullish bias remains intact.
The table below shows the percentage change of British Pound (GBP) against listed major currencies this week. British Pound was the strongest against the New Zealand Dollar.
| USD | EUR | GBP | JPY | CAD | AUD | NZD | CHF | |
|---|---|---|---|---|---|---|---|---|
| USD | -0.26% | -0.73% | -0.43% | 0.34% | 0.20% | 0.54% | -0.36% | |
| EUR | 0.26% | -0.47% | -0.15% | 0.60% | 0.46% | 0.76% | -0.09% | |
| GBP | 0.73% | 0.47% | 0.26% | 1.08% | 0.94% | 1.24% | 0.38% | |
| JPY | 0.43% | 0.15% | -0.26% | 0.79% | 0.67% | 1.04% | 0.21% | |
| CAD | -0.34% | -0.60% | -1.08% | -0.79% | -0.12% | 0.16% | -0.71% | |
| AUD | -0.20% | -0.46% | -0.94% | -0.67% | 0.12% | 0.29% | -0.56% | |
| NZD | -0.54% | -0.76% | -1.24% | -1.04% | -0.16% | -0.29% | -0.85% | |
| CHF | 0.36% | 0.09% | -0.38% | -0.21% | 0.71% | 0.56% | 0.85% |
The heat map shows percentage changes of major currencies against each other. The base currency is picked from the left column, while the quote currency is picked from the top row. For example, if you pick the British Pound from the left column and move along the horizontal line to the US Dollar, the percentage change displayed in the box will represent GBP (base)/USD (quote).
Market participants refrained from continuing to price in three 25 basis points (bps) Federal Reserve rate cuts in 2025 following the hot producer inflation data from the US, helping the US Dollar (USD) gather strength and forcing GBP/USD to stay on the back foot on Thursday.
The US Bureau of Labor Statistics reported that the Producer Price Index (PPI) rose by 3.3% on a yearly basis in July. This reading followed June’s 2.4% increase and came in much higher than analysts’ estimate of 2.5%. Other details of the data showed that the PPI and the core PPI both rose by 0.9% on a monthly basis.
Retail Sales and Industrial Production data for July will be featured in the US economic calendar on Friday. The market reaction to the Retail Sales data is likely to be straightforward and remain short-lived. A positive surprise could support the USD, while a disappointing print could weigh on the currency and help GBP/USD stretch higher.
Later in the day, the University of Michigan (UoM) will publish the preliminary Consumer Sentiment Survey for August. Rather than the headline Consumer Confidence Index data, markets could react to the One-year Inflation Component of the survey. A noticeable increase in this component could allow the USD to gather strength heading into the weekend and force GBP/USD to turn south.
The Relative Strength Index (RSI) indicator on the 4-hour chart holds slightly above 60, suggesting that the bullish bias remains intact.
Looking north, the first resistance area could be seen at 1.3590-1.3600 (static level, round level) before 1.3640 (Fibonacci 78.6% retracement of the latest downtrend) and 1.3700 (static level, round level). On the downside, support levels align at 1.3540 (Fibonacci 61.8% retracement), 1.3500 (static level, round level) and 1.3460 (Fibonacci 50% retracement, 200-period SMA).
The Pound Sterling (GBP) is the oldest currency in the world (886 AD) and the official currency of the United Kingdom. It is the fourth most traded unit for foreign exchange (FX) in the world, accounting for 12% of all transactions, averaging $630 billion a day, according to 2022 data.
Its key trading pairs are GBP/USD, also known as ‘Cable’, which accounts for 11% of FX, GBP/JPY, or the ‘Dragon’ as it is known by traders (3%), and EUR/GBP (2%). The Pound Sterling is issued by the Bank of England (BoE).
The single most important factor influencing the value of the Pound Sterling is monetary policy decided by the Bank of England. The BoE bases its decisions on whether it has achieved its primary goal of “price stability” – a steady inflation rate of around 2%. Its primary tool for achieving this is the adjustment of interest rates.
When inflation is too high, the BoE will try to rein it in by raising interest rates, making it more expensive for people and businesses to access credit. This is generally positive for GBP, as higher interest rates make the UK a more attractive place for global investors to park their money.
When inflation falls too low it is a sign economic growth is slowing. In this scenario, the BoE will consider lowering interest rates to cheapen credit so businesses will borrow more to invest in growth-generating projects.
Data releases gauge the health of the economy and can impact the value of the Pound Sterling. Indicators such as GDP, Manufacturing and Services PMIs, and employment can all influence the direction of the GBP.
A strong economy is good for Sterling. Not only does it attract more foreign investment but it may encourage the BoE to put up interest rates, which will directly strengthen GBP. Otherwise, if economic data is weak, the Pound Sterling is likely to fall.
Another significant data release for the Pound Sterling is the Trade Balance. This indicator measures the difference between what a country earns from its exports and what it spends on imports over a given period.
If a country produces highly sought-after exports, its currency will benefit purely from the extra demand created from foreign buyers seeking to purchase these goods. Therefore, a positive net Trade Balance strengthens a currency and vice versa for a negative balance.
That takes that part of the equation out of the conversation. Now, we’ll see. I don’t know if that’s actually the case. But clearly, this gave the markets a lot to think about. The 148 yen level looks as if it is going to be a barrier again, but I think we eventually break above there.
The interest rate differential obviously keeps the US dollar much more attractive than the yen because you of course get paid to hold it for every night and especially at the end of the Wednesday session most of you will get triple swap if we break out to the upside the 151 level could be a potential target but we’ll just have to wait and see if we break down below the bottom of the candlestick for the trading session on Thursday, then the 145 yen level could be targeted.
I like buying this pair. I have liked buying this pair for some time, but I also recognize you are going to be very patient with this pair. I do think that we have put in a significant bottom for the third time now near the 142 yen level. And now I think it begins at slow ascent higher. This grind will also pay you to hold onto it, so this is a bonus to say the least.
Want to trade our USD/JPY forex analysis and predictions? Here’s a list of forex brokers in Japan to check out.
Christopher Lewis has been trading Forex and has over 20 years experience in financial markets. Chris has been a regular contributor to Daily Forex since the early days of the site. He writes about Forex for several online publications, including FX Empire, Investing.com, and his own site, aptly named The Trader Guy. Chris favours technical analysis methods to identify his trades and likes to trade equity indices and commodities as well as Forex. He favours a longer-term trading style, and his trades often last for days or weeks.
Silver price rises over 1.63% on Wednesday, boosted by broad US Dollar weakness as traders had fully priced in a rate cut by the Federal Reserve at next month’s meeting.
Consequently, US Treasury yields, which correlated inversely with XAG/USD, tumbled with the 10-year benchmark note, down five basis points at 4.236%. At the time of writing, the grey metal trades at $38.53, after bouncing off daily lows of $37.85.
Silver price uptrend remains intact, hitting a three-week high of $38.65 with buyers clearing the last higher-high ahead of challenging the $39.00, with them eyeing the YTD peak of $39.53. From a price action standpoint, if those two levels are cleared, the grey metal could test $40.00 in the near term.
Momentum is bullish as depicted by the Relative Strength Index (RSI). Nevertheless, if something goes wrong, XAG/USD’s drop below $38.00 could put buyers under stress, and bears could challenge the latest cycle low of $37.50, the August 12 low. If cleared, the next area of interest would be the July 31 swing low of $36.21.
Silver is a precious metal highly traded among investors. It has been historically used as a store of value and a medium of exchange. Although less popular than Gold, traders may turn to Silver to diversify their investment portfolio, for its intrinsic value or as a potential hedge during high-inflation periods. Investors can buy physical Silver, in coins or in bars, or trade it through vehicles such as Exchange Traded Funds, which track its price on international markets.
Silver prices can move due to a wide range of factors. Geopolitical instability or fears of a deep recession can make Silver price escalate due to its safe-haven status, although to a lesser extent than Gold’s. As a yieldless asset, Silver tends to rise with lower interest rates. Its moves also depend on how the US Dollar (USD) behaves as the asset is priced in dollars (XAG/USD). A strong Dollar tends to keep the price of Silver at bay, whereas a weaker Dollar is likely to propel prices up. Other factors such as investment demand, mining supply – Silver is much more abundant than Gold – and recycling rates can also affect prices.
Silver is widely used in industry, particularly in sectors such as electronics or solar energy, as it has one of the highest electric conductivity of all metals – more than Copper and Gold. A surge in demand can increase prices, while a decline tends to lower them. Dynamics in the US, Chinese and Indian economies can also contribute to price swings: for the US and particularly China, their big industrial sectors use Silver in various processes; in India, consumers’ demand for the precious metal for jewellery also plays a key role in setting prices.
Silver prices tend to follow Gold’s moves. When Gold prices rise, Silver typically follows suit, as their status as safe-haven assets is similar. The Gold/Silver ratio, which shows the number of ounces of Silver needed to equal the value of one ounce of Gold, may help to determine the relative valuation between both metals. Some investors may consider a high ratio as an indicator that Silver is undervalued, or Gold is overvalued. On the contrary, a low ratio might suggest that Gold is undervalued relative to Silver.
Despite the stability of the EURJPY pair’s stability until this momentum within the levels on the bullish channel, but there are several negative factors that began from providing negative momentum by stochastic, and the stability below 172.00 that forms an important obstacle against the bullish trading, these factors help to confirm the dominance of the bearish correctional track, to keep waiting for targeting the initial support at 170.45, and breaking it will force the price to suffer new losses by reaching 169.45.
While regaining the bullish bias requires forming strong bullish rally, to step above 172.00, attacking the resistance at 173.40 to find an exit to achieve new gains in the upcoming period trading.
The expected trading range for today is between 170.45 and 172.60
Trend forecast: Bearish
Gold attracts some dip-buying during the Asian session on Friday and stalls the previous day’s retracement slide from the $3,375 region. The US Dollar (USD) struggles to capitalize on Thursday’s strong US Producer Price Index (PPI)-inspired recovery move from the vicinity of its lowest level since July 28, and turns out to be a key factor acting as a tailwind for the precious metal.
The US Bureau of Labor Statistics reported that the headline PPI accelerated from the 2.4% YoY rate to 3.3% in July, surpassing expectations of a 2.5% by a wide margin. This overshadows the relatively cooler July Consumer Price Index (CPI) report released on Tuesday and suggests that a broad pickup in inflation was imminent. Traders were quick to react and trimmed their bets for a more aggressive policy easing by the Federal Reserve (Fed), which, in turn, triggered an intraday USD short-covering and weighed on the non-yielding Gold.
The USD recovery momentum, however, runs out of steam as traders are still pricing in a greater chance that the Fed will lower borrowing costs at its upcoming monetary policy meeting in September. Furthermore, the CME Group’s FedWatch Tool indicates the possibility of two 25-basis-point (bps) Fed rate cuts by the end of this year. This keeps the USD bulls on the defensive and turns out to be a key factor that helps revive demand for Gold. However, the prevalent risk-on environment could act as a headwind for the safe-haven commodity.
An extension of the US-China tariff truce for another three months eased concerns about a full-blown trade war between the world’s two largest economies. Moreover, investors remain hopeful that the US-Russian summit this Friday will increase the chances of ending the prolonged war in Ukraine. This remains supportive of the bullish sentiment across the global financial markets. This, in turn, makes it prudent to wait for strong follow-through buying before traders start positioning for any further appreciating move for the Gold price.
Friday’s US economic docket – featuring the release of Monthly Retail Sales, the Empire State Manufacturing Index, followed by the University of Michigan Consumer Sentiment and Inflation Expectations Index. This, along with speeches by influential FOMC members, could offer fresh cues about the Fed’s rate-cut path, which, in turn, should provide some impetus to the Gold price later during the North American session. Nevertheless, the XAU/USD pair remains on track to register heavy losses for the first time in the previous three weeks.
The overnight sustained break and acceptance below the 200-period Simple Moving Average (SMA) on the 4-hour charts was seen as a key trigger for the XAU/USD bears. Moreover, slightly negative oscillators on hourly/daily charts suggest that any further move up is more likely to attract fresh sellers and remain capped near the 100-hour SMA, currently pegged near the $3,355 region. A sustained strength beyond the latter, however, could trigger a short-covering move and lift the Gold beyond the overnight swing high, around the $3,375 zone, towards reclaiming the $3,400 mark.
On the flip side, the two-week low, near the $3,330 area, now seems to have emerged as a strong support and should protect the immediate downside. Some follow-through selling could make the Gold vulnerable to accelerate the fall further towards the $3,3,00 round figure. The latter should act as a key pivotal point, which, if broken decisively, could negate any near-term positive bias and shift the bias in favor of the XAU/USD bears. This should pave the way for a fall towards the $3,272-$3,270 horizontal support, representing the lower boundary of a nearly three-month-old trading range.
Copper price returned to form weak and sideways trading, attempting to face stochastic negativity that is located within the oversold level, to keep the main stability above the main bullish channel’s support at $4.0500.
The attempt of the moving average 55 to reinforce the stability of the extra support at $4,2600 might help it to provide some positive momentum, to ease the mission of targeting the positive stations near $4.6300 and $4.7400.
The expected trading range for today is between $4.3700 and $4.6300
Trend forecast: Bullish