The main category of Forex News.
You can use the search box below to find what you need.
[wd_asp id=1]
The main category of Forex News.
You can use the search box below to find what you need.
[wd_asp id=1]
Gold (XAU/USD) trades practically flat for the second consecutive day on Friday, with the rejection from three-month highs near $4,700 hit earlier in the week contained at a previous resistance area, just below $4,600. Market volatility remains subdued on Friday, with investors focusing on Federal Reserve Chairman Kevin Warsh’s speech at the Jackson Hole Symposium, due later in the day.
Investors expect Warsh to overcome his distaste for forward guidance and show some hints about the central bank’s near-term policy plans to tame price pressures, amid calls for interest rate hikes from board members.
On Thursday, Kansas Fed President Jeffrey Schmidt said on CNBC that inflation is “still sticky and we’ve got to continue to find ways to break through”, Later on the day, Cleveland Fed President Beth Hammack reiterated that it is “time to act” to bring inflation back to target.
XAU/USD trades at $4,599 with the broader bullish stance in play as spot price holds well above the 200-day Simple Moving Average (SMA), now around $4,525. Momentum indicators in the daily chart endorse the bullish view, with the Relative Strength Index (RSI) at 66.48 after pulling back from overbought extremes, and the Moving Average Convergence Divergence (MACD) holding within positive territory.
Bears remain contained above late-May highs in the $4,590 area so far, closing the path to the mentioned 200-day SMA at $4,527. Below there, the next downside target would be the August 13 high and August 20 low, at the $4,450 area.
Upside attempts remain capped ahead of the $4,700 level (Tuesday’s high), ahead of the May 12 high at $4,773 and April’s peak, near $4,900.
(The technical analysis of this story was written with the help of an AI tool. Know more.)
Gold has played a key role in human’s history as it has been widely used as a store of value and medium of exchange. Currently, apart from its shine and usage for jewelry, the precious metal is widely seen as a safe-haven asset, meaning that it is considered a good investment during turbulent times. Gold is also widely seen as a hedge against inflation and against depreciating currencies as it doesn’t rely on any specific issuer or government.
Central banks are the biggest Gold holders. In their aim to support their currencies in turbulent times, central banks tend to diversify their reserves and buy Gold to improve the perceived strength of the economy and the currency. High Gold reserves can be a source of trust for a country’s solvency. Central banks added 1,136 tonnes of Gold worth around $70 billion to their reserves in 2022, according to data from the World Gold Council. This is the highest yearly purchase since records began. Central banks from emerging economies such as China, India and Turkey are quickly increasing their Gold reserves.
Gold has an inverse correlation with the US Dollar and US Treasuries, which are both major reserve and safe-haven assets. When the Dollar depreciates, Gold tends to rise, enabling investors and central banks to diversify their assets in turbulent times. Gold is also inversely correlated with risk assets. A rally in the stock market tends to weaken Gold price, while sell-offs in riskier markets tend to favor the precious metal.
The price can move due to a wide range of factors. Geopolitical instability or fears of a deep recession can quickly make Gold price escalate due to its safe-haven status. As a yield-less asset, Gold tends to rise with lower interest rates, while higher cost of money usually weighs down on the yellow metal. Still, most moves depend on how the US Dollar (USD) behaves as the asset is priced in dollars (XAU/USD). A strong Dollar tends to keep the price of Gold controlled, whereas a weaker Dollar is likely to push Gold prices up.
The US dollar has gone back and forth against the Japanese yen during trading on Thursday, which does make a certain amount of sense considering that Friday features a speech by Kevin Warsh, the Chairman of the Federal Reserve, coming out of Jackson Hole. That could have people trying to determine whether or not the Fed is going to raise rates later this year.

The interest rate differential between these 2 currencies continues to be a major driver of where we are, and I do like buying the dollar against the yen. The question, of course, is going to be whether or not we remain hawkish in the United States or if that starts to disappear. Most traders are betting that we are not raising by the end of the year, but then the question becomes: is the interest rate differential going to shrink enough to get the carry trade out of vogue? And my answer, at least right now, is no.
The 160 yen level is an area that’s a bit of a barrier, and if we clear that, then I think that would be a very straightforward repudiation of the idea of killing off the carry trade, at least in the short term. Yes, the Bank of Japan has intervened 3 times now, but generally speaking, all that does is slow down a move; it very rarely reverses a trend. And that is basically a function of not wanting the currency to depreciate too quickly. It’s not even that it’s depreciating; it’s that it did it way too rapidly.
Since we’ve had that intervention, the market has been pressing against the Bank of Japan and the US Treasury Department. This is a trade that I’m still in, at least for now. I’ve been collecting swap for months. That sell-off a couple of weeks ago was pretty brutal, but at the end of the day, if you are positioned correctly and with the correct size, you can take advantage of this. If we break above 160 yen, I’ll probably add.
Want to trade our USD/JPY forex analysis and predictions? Here’s a list of forex brokers in Japan to check out.
Christopher Lewis is a technical analyst and market commentator at DailyForex with more than two decades of trading experience in Forex and other leveraged markets. Based in Columbus, Ohio, he specializes in chart-based analysis of major currency pairs, stock indices, commodities, and energy markets, focusing on clear support and resistance levels, trend structure, and risk management. Christopher produces daily written and video analysis for traders who rely on technical setups to navigate volatile market conditions
As seen on: Pairs Of Aces Podcast,The Trader Guy, FXEmpire
Silver Price Forecast: XAG/USD Dips Below $69.00 as Fed Chair Speech Looms
Silver (XAG/USD) slipped below the $69.00 mark during early trading on [Date], as market participants turned cautious ahead of the Federal Reserve Chair’s highly anticipated speech. The precious metal’s decline reflects a broader wait-and-see stance among investors, who are seeking clarity on the future path of U.S. interest rates.
The pullback in silver prices comes as Treasury yields and the U.S. dollar show resilience, driven by expectations that the Fed may maintain a hawkish stance. Higher interest rates typically increase the opportunity cost of holding non-yielding assets like silver, putting downward pressure on prices. As of [Date], XAG/USD was trading at approximately $68.85, down from recent highs above $70.00.
Investors are closely monitoring the Fed Chair’s remarks for any signals regarding the timing of future rate cuts or hikes. The speech, scheduled for [Time] ET, is expected to provide insights into the central bank’s assessment of inflation and economic growth. A hawkish tone could further strengthen the dollar and weigh on silver, while a dovish surprise might trigger a rebound.
From a technical perspective, silver’s immediate support is seen at the $68.50 level, followed by the $68.00 psychological mark. On the upside, resistance is noted at $69.50 and then $70.00. A break above $70.00 could open the door for further gains, while a sustained move below $68.00 might signal deeper correction.
The silver market remains sensitive to global economic data, industrial demand, and geopolitical developments. With the Fed’s policy path uncertain, volatility is likely to persist. Additionally, silver’s dual role as both a precious and industrial metal means that economic growth expectations also play a crucial role in its price dynamics.
Silver’s dip below $69.00 underscores the market’s nervousness ahead of the Fed Chair’s speech. Traders should brace for potential volatility, with key support and resistance levels likely to guide short-term movements. The outcome of the speech will be pivotal in determining whether silver can regain its footing or extend its decline.
Q1: What is driving the silver price today?
The immediate driver is the market’s anticipation of the Fed Chair’s speech, which could signal future interest rate decisions. A stronger dollar and higher yields are also pressuring silver.
Q2: What are the key support and resistance levels for silver?
Immediate support is at $68.50, with stronger support near $68.00. Resistance is at $69.50 and $70.00. A break above $70.00 could trigger further upside.
Q3: How does the Fed’s policy affect silver prices?
Higher interest rates increase the opportunity cost of holding non-yielding assets like silver, typically leading to lower prices. Conversely, expectations of rate cuts can boost silver.
This post Silver Price Forecast: XAG/USD Dips Below $69.00 as Fed Chair Speech Looms first appeared on BitcoinWorld.
The EUR/USD pair pulled back in the last full week of August, settling a handful of pips below the 1.1600 mark. The US Dollar (USD) was able to post a comeback after suffering steady losses throughout the month, exacerbated by the United States (US) Department of the Treasury announcement of increased long-bond buybacks on August 19. The recovery that followed the sell-off seems corrective as the pair holds far above the monthly low at 1.1350, yet closer to the peak at 1.1710.
The Middle East war was the main factor behind USD strength between March and July as the conflict pushed energy prices much higher, bringing mounting inflationary pressure back to the fore and, in turn, potentially tighter monetary policies around the globe.
Federal Reserve (Fed) Chair Kevin Warsh debuted as the Fed’s head, pledging to tame inflation. So far, his words have outpaced his actions. Despite inflation almost doubling the Fed’s goal, Warsh and co. kept interest rates on hold. It’s not actually a surprise if we consider that US President Donald Trump spent most of his latest mandate demanding lower interest rates from former Chair Jerome Powell.
The Middle East war continues, but the USD lost its crown as preferred safe-haven as investors dropped bets of higher interest rates in the US. At this point, it is unlikely the Fed will hike rates in September. What’s so terrible about the Fed holding rates? It’s not about the Fed holding rates steady but about almost all major economies having already pulled the trigger more than once. Most major central banks have already delivered rate hikes, and more than one, since the year started. The Fed’s hesitation is not related to macroeconomic data but to a potential clash with President Trump.
Fed Chair Kevin Warsh spoke at the Jackson Hole Symposium on Friday and said that they must be confident that underlying inflation is moving toward the objective, adding that they have work to do otherwise. The US Dollar found some near-term demand with his hawkish words as the odds for an interest rate hike in September increased from roughly 35% on Thursday to 45.7%, according to the CME FedWatch Tool.
Beyond the continued tensions that keep Oil prices elevated, market participants now have another source of concern. US President Donald Trump abruptly ended trade talks with Canada and imposed fresh levies on the country of around $20 billion. However, Canadian Prime Minister Mark Carney quickly responded by enacting retaliatory tariffs of the same amount.
Hawkish hopes may boost USD demand, but uncertainty is putting a cap on it.
US data released throughout the week came in line with expectations, easing pressure on the Greenback. The market saw as good news the fact that the news was not as bad as feared. The US published the first revision of the Q2 Gross Domestic Product (GDP), which confirmed annualized growth at 1.5% in the three months to June, as previously estimated.
The Fed’s favorite inflation gauge, the Personal Consumption Expenditures (PCE) Price Index, remained unchanged at 3.7% YoY in July, although slightly above the expected 3.6%. The core PCE Price Index for the same period held steady at 3.3%, as anticipated. Finally on Friday, the country published the Nonfarm Payrolls annual revision of the twelve months to March 2026. The number of new jobs was revised downward by 79,000, or 0.1%.
The European macroeconomic calendar offered nothing relevant but will become more interesting in the coming days. Germany will publish the preliminary estimates of the August Harmonized Index of Consumer Prices (HICP) on Monday, while the EU will release the HICP on Tuesday. Annualized inflation, as measured by the HICP, is foreseen at 3.2% following the 2.9% posted in July, while the core annual HICP is expected to remain unchanged at 2.5%. Other than that, the EU will publish July Retail Sales while Germany will unveil July Factory Orders on Friday.
The US macroeconomic calendar will also be interesting. The country will publish the August ISM Services and Manufacturing Purchasing Managers Index (PMIs) and multiple employment figures, closing on Friday with the August Nonfarm Payrolls report that is expected to show the economy added 45,000 new job positions in the month after losing 23,000 in July.


The daily chart shows EUR/USD is losing its positive tone, as the pair is struggling to hold the 1.1600 mark and is barely above the 20- and 100-day Simple Moving Averages (SMAs) at 1.1591 and 1.1573, and remains capped by the 200-day SMA at 1.1633. The Momentum indicator eases within positive levels and nears its midline from above, while the Relative Strength Index (RSI) indicator heads south almost vertically and now sits near 54, hinting at buying interest giving up.
In the weekly chart, EUR/USD retains a modest bullish bias as it remains above the 20-week SMA at 1.1571, with the longer-term 100- and 200-week SMAs at 1.1330 and 1.1067 reinforcing an underlying supportive structure. The RSI indicator sits near a neutral 51, while the slightly negative Momentum hints that upside traction continues to vanish.
On the downside, immediate support is seen at the 20-day SMA near 1.1591, with the 100-day SMA at 1.1573 reinforcing a broader demand zone on pullbacks. On the topside, the 200-day SMA at 1.1633 is the next key resistance, followed by recent tops in the 1.1710 level. Only a clear advance beyond the latter would revive the bullish trend and open the door for an extension towards 1.1800.
(The technical analysis of this story was written with the help of an AI tool. Know more.)
At 6:30 a.m. Eastern Time today, oil was priced at $90.55 per barrel with Brent serving as the benchmark (we’ll explain different benchmarks later in this article). That’s a gain of 87 cents compared with yesterday morning and around $22.34 higher than the price one year ago.
It’s impossible to forecast oil prices with detailed precision. Many different elements affect the market, but ultimately it boils down to supply and demand. When worries about economic recession, war, and other large-scale disruptions increase, oil’s path can shift fast.
Gas prices at the pump don’t only track crude oil. They also include what it takes to refine and move that fuel, the taxes layered on top, and the extra markup your local station adds to stay in business.
Since crude oil generally makes up a majority of the per-gallon cost, changes in its price have an outsized impact. When oil surges, gas prices typically rise in tandem. But when oil retreats, gas prices often lag on the way down, a trend sometimes described as “rockets and feathers.”
In case of emergency, the U.S. has a store of crude oil known as the Strategic Petroleum Reserve. Its primary purpose is energy security in case of disaster (think sanctions, severe storm damage, even war). But it can also go a long way toward softening crippling price hikes during supply shocks.
It’s not a long-term answer and is more meant to provide temporary relief, assisting consumers and keeping critical parts of the economy running, like key industries, emergency services, public transportation, etc.
Both oil and natural gas are key sources of the energy we use every day. Because of this, a big change in oil prices can affect natural gas. For example, if oil prices increase, some industries may swap natural gas for some segments of their operations where possible, which increases demand for natural gas.
To gauge oil’s performance, we often turn to two benchmarks:
Between these two, Brent better represents global oil performance because it prices much of the world’s traded crude. And, it’s often the best way to track historical oil performance. In fact, even the U.S. Energy Information Administration now uses Brent as its primary reference in its Annual Energy Outlook.
Looking at the Brent benchmark across several decades, oil has been anything but steady. It’s seen spikes due to factors such as wars and supply cuts, and it’s also seen crashes from global recessions and an oversupply (called a “glut”). For example:
All to say, oil’s historical performance has been anything but smooth. Again, it’s hugely affected by wars, recessions, OPEC whims, evolving energy initiatives and policies, and much more.
Looking to stay up-to-date regarding the latest energy developments? Check out our recent coverage:
The current price of oil per barrel depends largely on supply and demand, including news about potential future supply and demand (geopolitics, decisions made by OPEC+, etc.). In the U.S., prices also move based on how friendly an administration is to drilling, as it can affect future supply. For example, 2025 saw the Trump administration move to reopen more than 1.5 million acres in the Coastal Plain of the Arctic National Wildlife Refuge for oil and gas leasing, reversing the Biden administration’s policy of limiting oil drilling in the Arctic.
The price of oil updates constantly when the “futures” markets are open. A futures market is effectively an auction where people agree to buy or sell oil in the future. As long as people and companies are trading contracts, the oil price is changing.
In short, shale is rock that contains oil and natural gas. Think of shale as energy yet to be tapped. The more shale the U.S. accesses, the more energy we’ll have—and the more easily oil prices can keep from spiking as much thanks to a greater supply.
When oil is expensive, it tends to make everyday items cost more. This can be related to energy (your heating, gas utilities, etc.), but it’s also due to the logistics involved with making those items accessible to you. Shipping, for example, can affect the price of things at the grocery store, as it’s more expensive to get those products from warehouses and farms onto the shelf.
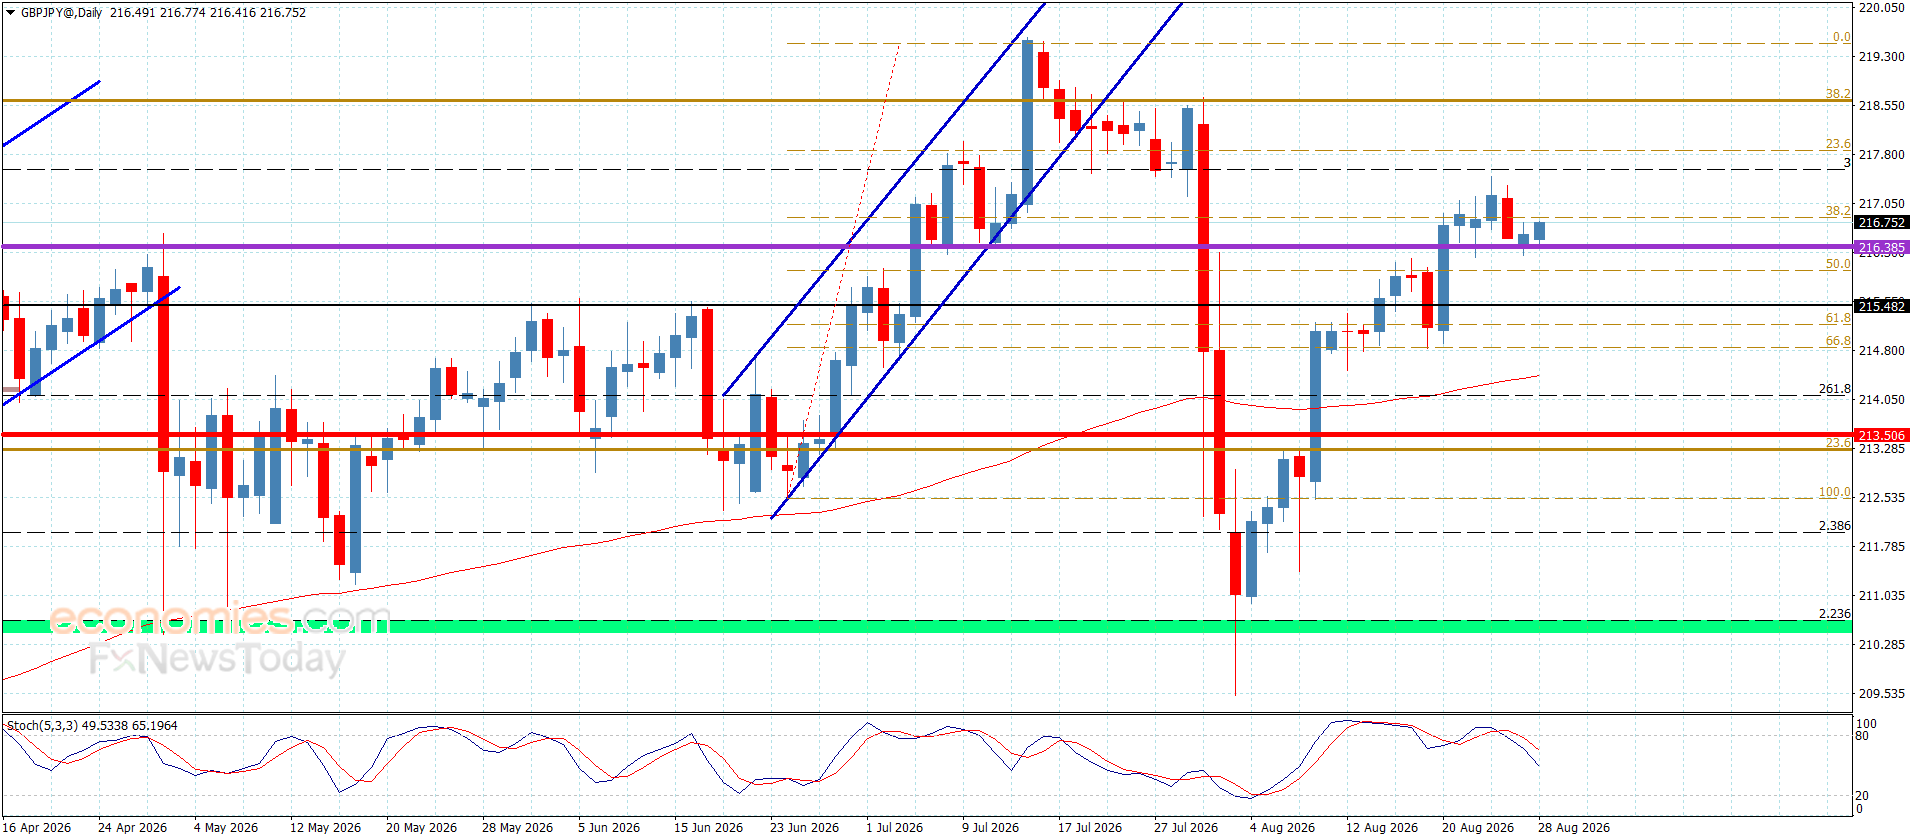
The GBPJPY pair kept facing stochastic negativity by forming some bullish waves, to keep its stability above the initial support at 216.35 level, the sideways trading might continue until gaining the required bullish momentum for putting pressure on 217.85 obstacle, to find an exit for resuming the bullish trend in the upcoming trading.
Facing new negative pressures by reaching below 216.35 will increase the chances of forming bearish corrective waves, forcing it to suffer some losses by reaching 215.85 and 215.55 gradually before any new attempt to achieve the previously suggested positive targets.
The expected trading range for today is between 216.10 and 217.85
Trend forecast: Bullish
Gold (XAU/USD) extends its gains for the second successive day, trading around $4,610 during the European hours on Friday. The price of the precious metal is remaining within the ascending channel pattern, suggesting a persistent bullish bias.
The XAU/USD pair is retaining a constructive bullish bias as spot holds above both the nine-period and 50-period Exponential Moving Averages (EMAs), keeping the short- and medium-term trends aligned to the upside. The 14-day Relative Strength Index (RSI) stands around 67, hovering in bullish territory but shy of extreme overbought conditions, which suggests upside momentum is still dominant though increasingly stretched.
Gold price may rise toward the three-month high of $4,697.07, reached on August 25. A break above this level would open the doors for the XAU/USD pair to reach the upper boundary of the ascending channel around $4,850.00.
On the downside, the immediate support appears at the nine-day EMA of $4,557.72, followed by the lower boundary of the ascending channel around $4,500. A break below this confluence support zone would weaken the bullish bias and put downward pressure on the Gold price to test the 50-day EMA at $4,336.84, followed by the three-week low of $4311.04, which was recorded on August 14.
Analysts at Deutsche Bank highlight a firmer backdrop in rates and commodities, noting that the “10y US Real Yield @ 2.34 // 2 bp” and “10y US Breakevens @ 2.33 // 1 bp” both edged higher, alongside a rise in “10y German Breakeven @ 2.13 // 2 bp.” Credit markets were broadly steady, with “iTraxx Europe 125 @ 51 // unch,” “CDX 125 @ 50 // unch,” and “CDX EM @ 98.4 // unch,” while financial indices were little moved as “iTraxx Sen Fin @ 54 // unch” and “iTraxx Sub Fin @ 87 // +1” showed only marginal shifts. In commodities and FX, Deutsche Bank points to “WTI Oil^ @ 83.13 // +1.94%” and a slightly softer Euro as “EUR/USD^ @ 1.165 // -0.10%.” Equity sentiment in Asia was constructive, with the “NIKKEI @ 66624 // +0.74%” and “Hang Seng @ 25685 // +0.47%,” while volatility eased as the “VIX @ 14.51 // -0.70” slipped further. Against this backdrop of rising real yields and stronger Oil, the bank notes that “Gold^ @ 4579 // -0.85%” came under pressure.
(The technical analysis of this story was written with the help of an AI tool. Know more.)
Gold has played a key role in human’s history as it has been widely used as a store of value and medium of exchange. Currently, apart from its shine and usage for jewelry, the precious metal is widely seen as a safe-haven asset, meaning that it is considered a good investment during turbulent times. Gold is also widely seen as a hedge against inflation and against depreciating currencies as it doesn’t rely on any specific issuer or government.
Central banks are the biggest Gold holders. In their aim to support their currencies in turbulent times, central banks tend to diversify their reserves and buy Gold to improve the perceived strength of the economy and the currency. High Gold reserves can be a source of trust for a country’s solvency. Central banks added 1,136 tonnes of Gold worth around $70 billion to their reserves in 2022, according to data from the World Gold Council. This is the highest yearly purchase since records began. Central banks from emerging economies such as China, India and Turkey are quickly increasing their Gold reserves.
Gold has an inverse correlation with the US Dollar and US Treasuries, which are both major reserve and safe-haven assets. When the Dollar depreciates, Gold tends to rise, enabling investors and central banks to diversify their assets in turbulent times. Gold is also inversely correlated with risk assets. A rally in the stock market tends to weaken Gold price, while sell-offs in riskier markets tend to favor the precious metal.
The price can move due to a wide range of factors. Geopolitical instability or fears of a deep recession can quickly make Gold price escalate due to its safe-haven status. As a yield-less asset, Gold tends to rise with lower interest rates, while higher cost of money usually weighs down on the yellow metal. Still, most moves depend on how the US Dollar (USD) behaves as the asset is priced in dollars (XAU/USD). A strong Dollar tends to keep the price of Gold controlled, whereas a weaker Dollar is likely to push Gold prices up.
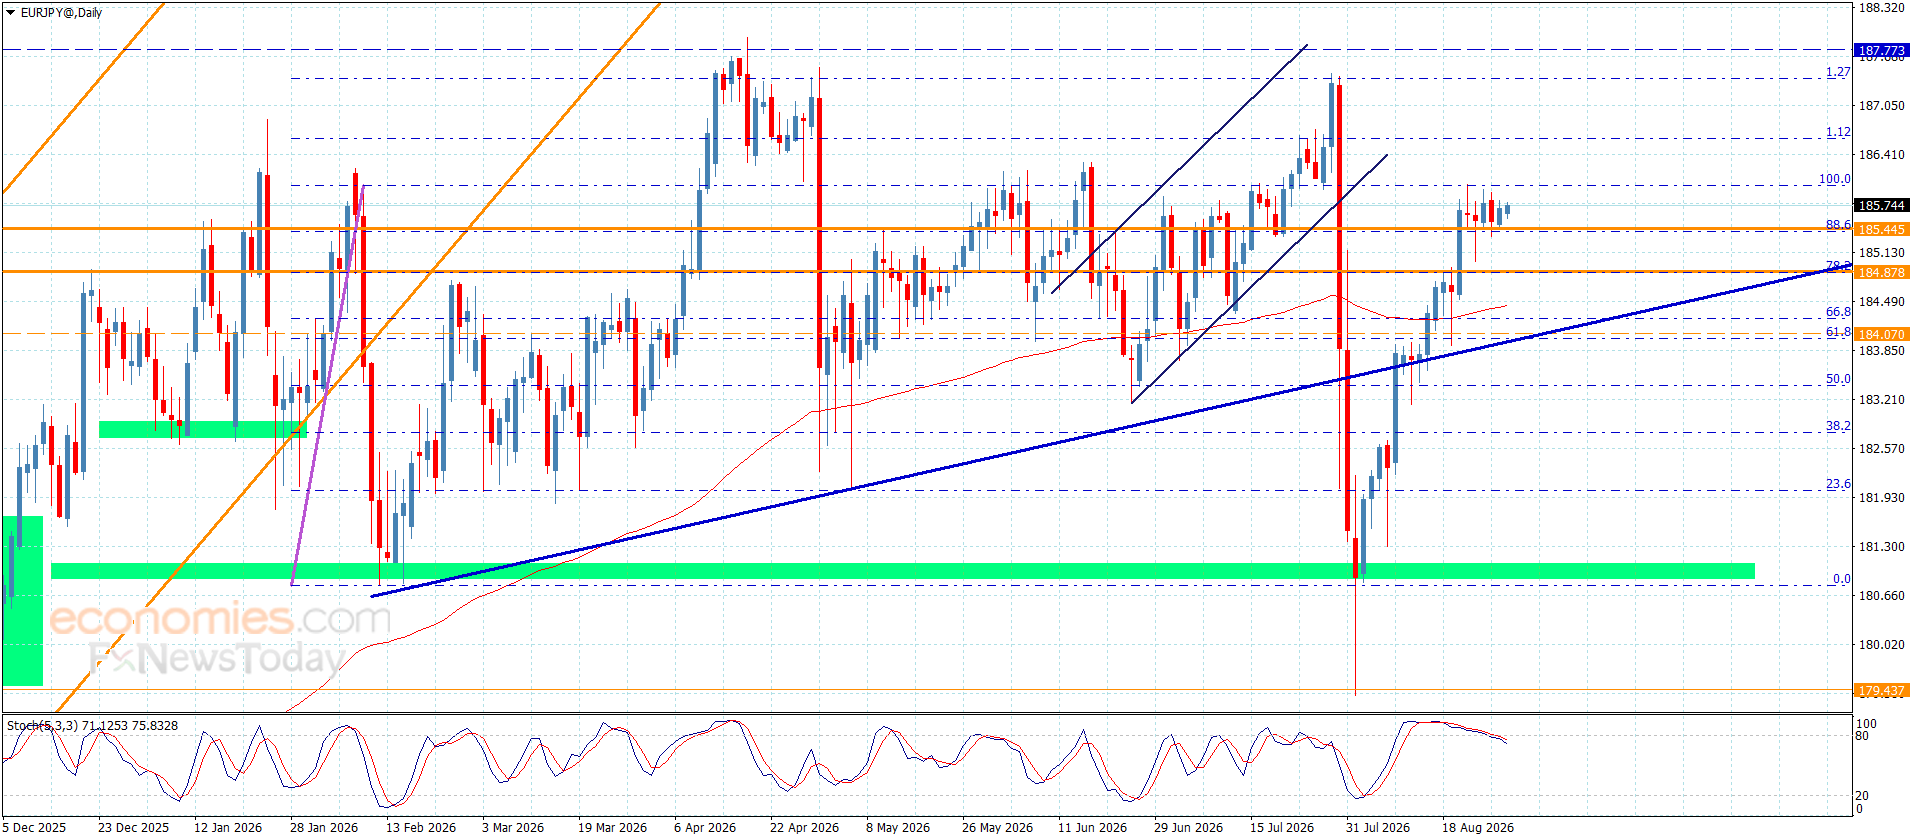
No news for the EURJPY pair until this moment to form weak sideways trading by holding near 185.75 due to the continuation of the main indicators’ contradiction, besides the stability of 186.05 barrier against the attempts of resuming the bullish trend.
Therefore, we recommend waiting for the required breach to confirm its readiness to recover new gains that might begin at 186.65 and 187.30, while holding below the barrier might force it to form some bearish corrective trading, to target 184.80 and 184.20 level.
The expected trading range for today is between 185.45 and 186.65
Trend forecast: Bullish
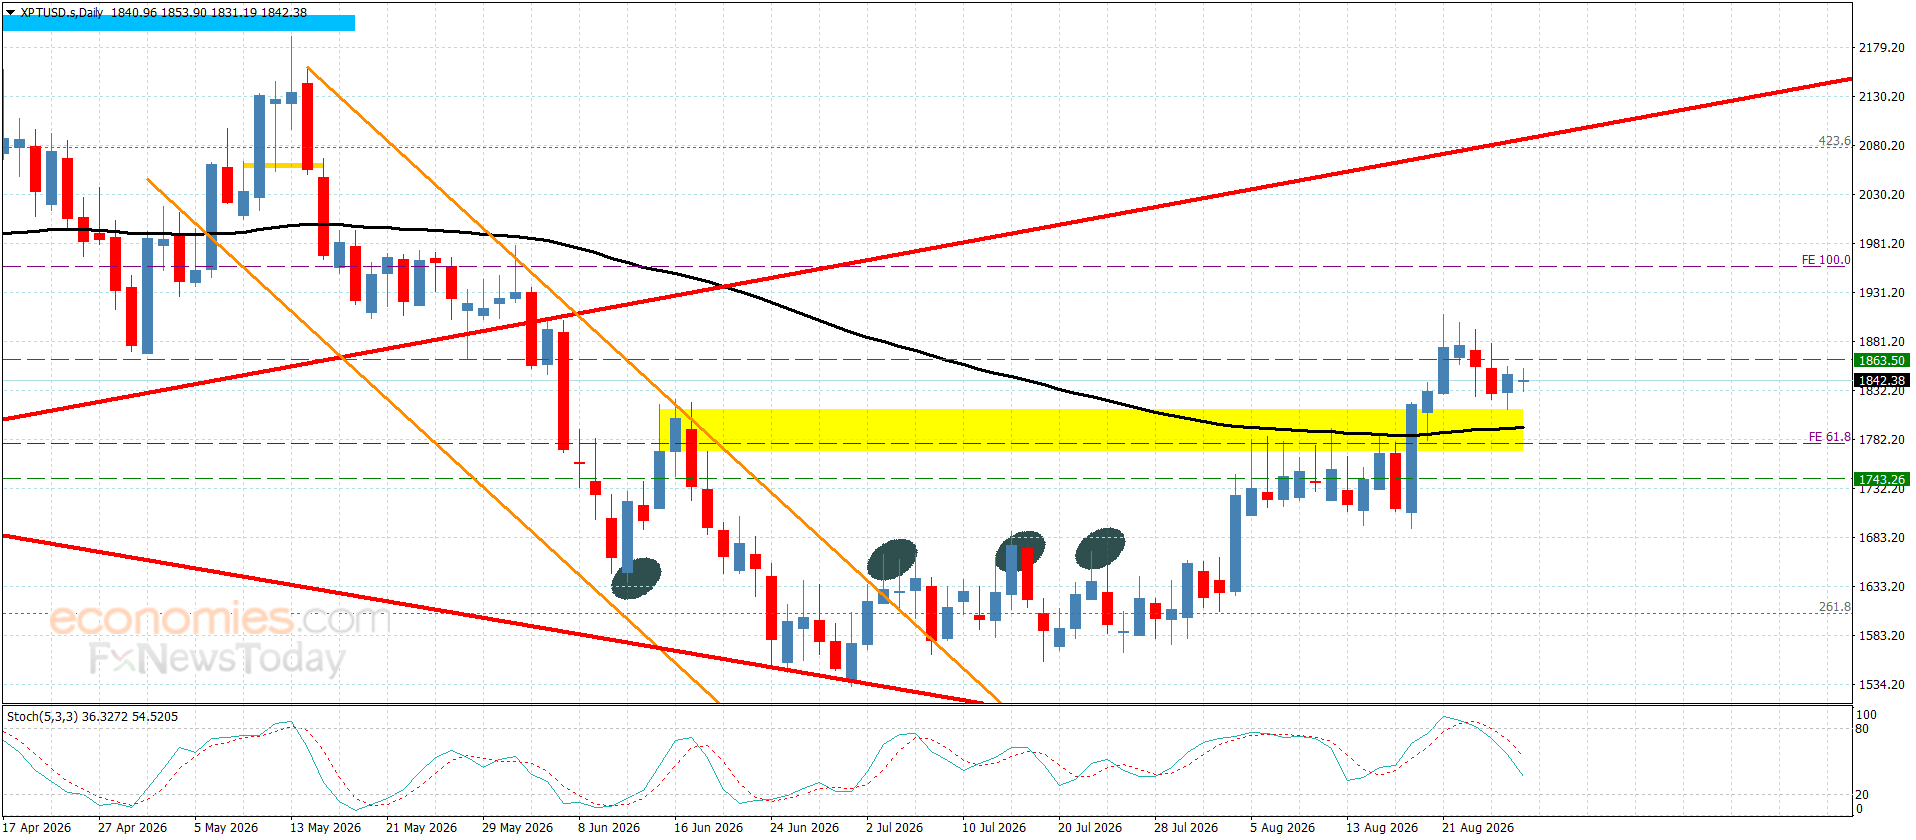
No news for Platinum price as it forms sideways trading and its stability near $1840.00 level, surrendering to the contradiction of the main indicators temporarily, noticing the price attempt to rise above the support level at $1780.00 to increase the chances of gathering positive momentum, to begin forming bullish waves to target $1875.00 level, repeating the pressure on $1905.00 to find an exit for recording new gains in the near and medium period.
The expected trading range for today is between $1820.00 and $1875.00
Trend forecast: fluctuated within the bullish trend
The Euro (EUR) nurses moderate losses against the British Pound (GBP), with price action contained within the previous day’s range and market volatility muted, as investors brace for Federal Reserve Chairman Kevin Warsh’s speech at Jackson Hole. The EUR/GBP pair has pulled back to levels near 0.8570 from Thursday’s highs right below 0.8580, with the weekly chart showing marginal gains.
Looking ahead, analysts at Rabobank expect “further range trading in EUR/GBP over the coming weeks, with a mild upside bias later in the year as fiscal realism weighs and BoE rate hike risk is further priced out.” In line with this view, the bank says it “maintain[s] a 3-month EUR/GBP forecast of 0.87.”
EUR/GBP has been trading in a choppy and sideways manner since peaking at 0.8585 in late July. The pair is now trading at 0.8572, after another rejection at the 0.8580 area earlier in the week, with the near-term bias highlighting fading bullish traction.
Momentum indicators in 4-hour charts are pulling towards the neutral area. The Relative Strength Index lies around 57 while the Moving Average Convergence Divergence (MACD) sits just above zero, but the MACD line is attempting to cross below the Signal line, which is a bearish sign.
Bears remain contained above the 08570 area so far, but the key support area is at the August 25 low, near 0.8545, followed by the late July and mid-August low, in the 0.8530 area. Bulls, on the other hand, would have to break the mentioned 0.8585 area (July 30, August 20 highs) to shift the focus towards a previous support area, right above 0.8600 (June 24, 30 highs).
(The technical analysis of this story was written with the help of an AI tool. Know more.)
The table below shows the percentage change of Euro (EUR) against listed major currencies today. Euro was the strongest against the Japanese Yen.
| USD | EUR | GBP | JPY | CAD | AUD | NZD | CHF | |
|---|---|---|---|---|---|---|---|---|
| USD | 0.05% | 0.03% | 0.06% | -0.01% | -0.04% | -0.17% | 0.04% | |
| EUR | -0.05% | -0.01% | 0.04% | -0.06% | -0.09% | -0.20% | -0.00% | |
| GBP | -0.03% | 0.01% | 0.04% | -0.06% | -0.09% | -0.18% | 0.02% | |
| JPY | -0.06% | -0.04% | -0.04% | -0.08% | -0.10% | -0.24% | -0.03% | |
| CAD | 0.00% | 0.06% | 0.06% | 0.08% | -0.03% | -0.16% | 0.05% | |
| AUD | 0.04% | 0.09% | 0.09% | 0.10% | 0.03% | -0.12% | 0.05% | |
| NZD | 0.17% | 0.20% | 0.18% | 0.24% | 0.16% | 0.12% | 0.21% | |
| CHF | -0.04% | 0.00% | -0.02% | 0.03% | -0.05% | -0.05% | -0.21% |
The heat map shows percentage changes of major currencies against each other. The base currency is picked from the left column, while the quote currency is picked from the top row. For example, if you pick the Euro from the left column and move along the horizontal line to the US Dollar, the percentage change displayed in the box will represent EUR (base)/USD (quote).