The main category of Forex News.
You can use the search box below to find what you need.
[wd_asp id=1]
The main category of Forex News.
You can use the search box below to find what you need.
[wd_asp id=1]
International Paper Company (IP) stock rose slightly in its latest intraday trading, attempting to recover part of previous losses while also trying to relieve some of the oversold pressure apparent on the Relative Strength Index indicators, especially as positive signals begin to appear. However, the stock’s recent rise faced resistance from the 50-day SMA, with the medium-term trend still under bearish control.
Therefore, we expect the stock price to decline in its upcoming trading, as long as the 48.50$ resistance holds, targeting the key support level of 43.55$.
Today’s price forecast: Bearish
Spot Gold pressures a fresh weekly low around the $3,330 level in the American session on Thursday, amid resurgent US Dollar (USD) demand. Financial markets were shocked by recent United States (US) inflation-related figures, as, following the release of a benign July Consumer Price Index (CPI) earlier in the week, the Producer Price Index (PPI) in the same period was much hotter than anticipated.
Inflation at wholesale levels in the US surged at an annualised pace of 3.3% in July according to the PPI, while the core annual reading printed at 3.7%, much higher than the 2.6% posted in June or the expected 2.9%. The figures weighed down hopes for an interest rate cut in September, but a rate cut remains on the table. According to the FedWatch Tool, a rate cut of 25 basis points (bps) is 90.4% possible in September, compared to the 94.3% from before the PPI release.
Wall Street turned south with the news, with the three major indexes trading in the red at the time. At the same time, demand for the USD returns, resulting in a modest XAU/USD retracement despite the softer mood.
Friday will bring the US July Retail Sales and the preliminary estimate of the August Michigan Consumer Sentiment Index.
The daily chart for the XAU/USD pair shows that it has been trading within a limited intraday range, just below a flat 20 Simple Moving Average (SMA), providing dynamic resistance at around $3,357. The same chart shows the 100 SMA keeps grinding north, albeit losing its upward momentum at around $3,301.80. Finally, technical indicators remain within neutral levels, with the Relative Strength Index (RSI) indicator turning marginally lower, in line with the ongoing weakness.
In the near-term, and according to the 4-hour chart, the risk skews to the downside. The XAU/USD pair develops below all its moving averages, with the 20 SMA gaining downward traction between directionless 100 and 200 SMAs. At the same time, technical indicators turned flat, although within negative levels, reflecting the latest bounce but far from suggesting additional recoveries.
Support levels: 3,328.10 3,312.25 3,301.80
Resistance levels: 3,350.00 3,372.30 3,389.85
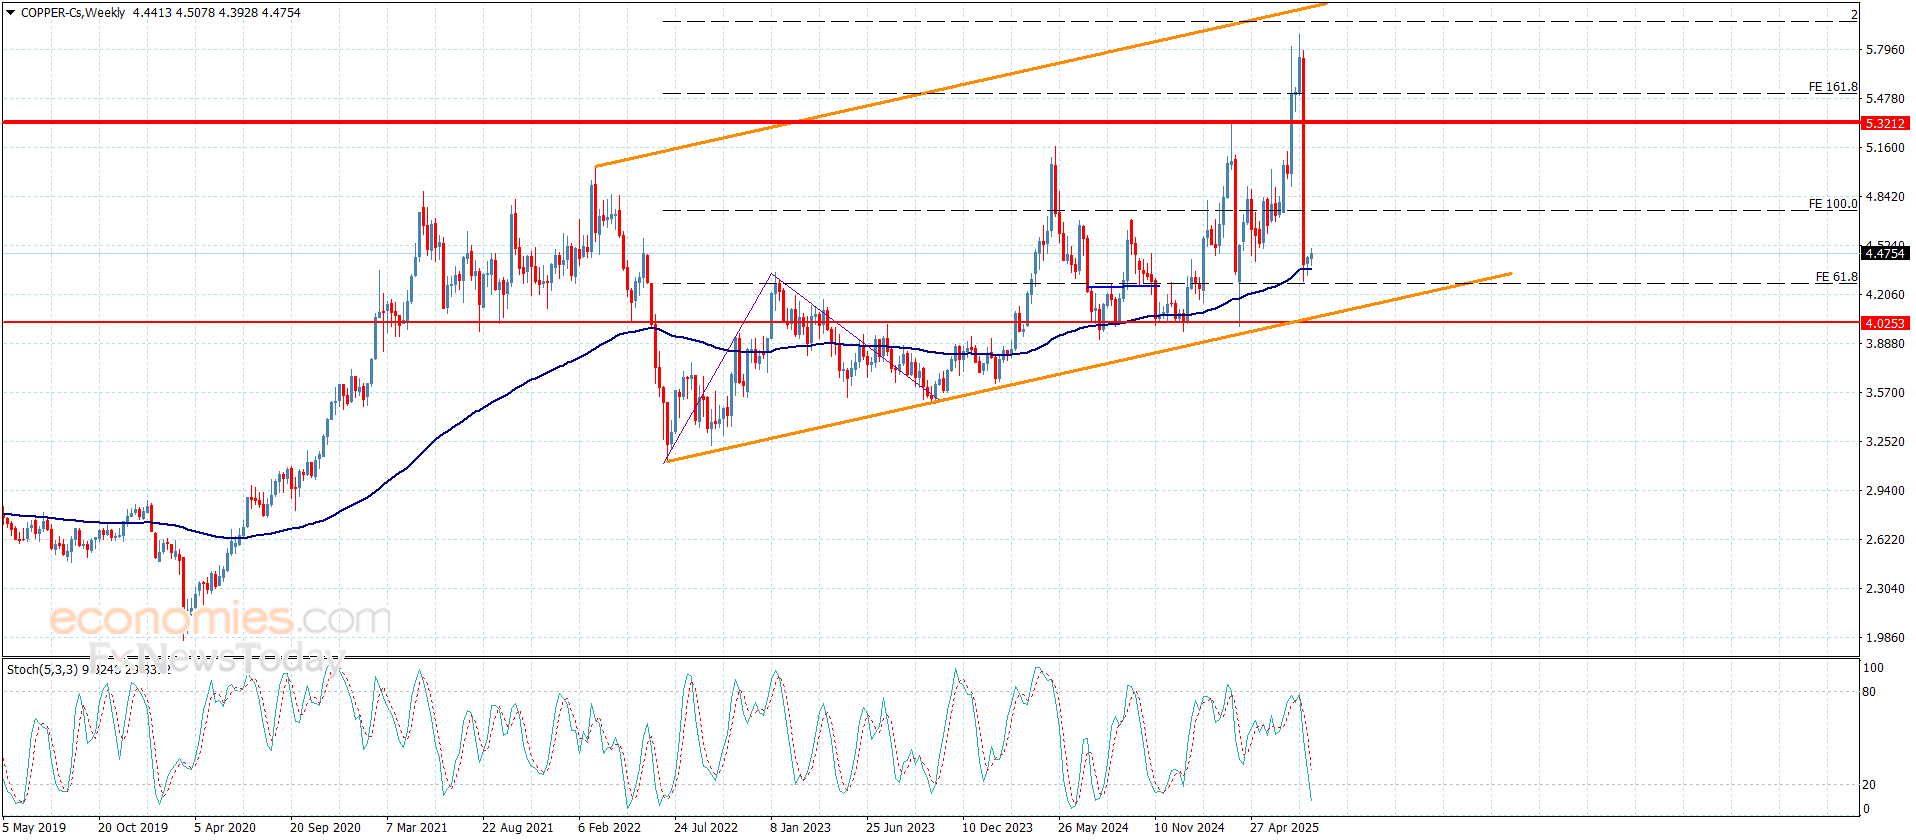
Copper price kept its positive stability above the moving average 55 to keep the continuation of the suggested positivity that depends on the stability of the bullish channel’s support at $4.0500, to notice the weakness of the bullish attempts due to the continuation of stochastic contradiction that is fluctuating now within the oversold level.
Gaining the required extra positive momentum, to motivate the bullish attack, to expect attacking the initial positive target at $4.7400, and surpassing it will make it record several gains in the upcoming period trading.
The expected trading range for today is between $4.3700 and $4.6300
Trend forecast: Bullish
– Written by
Frank Davies
STORY LINK Euro to Dollar Forecast: 1.1780 in Focus as Buyers Push Higher
The Euro to Dollar (EUR/USD) exchange rate has turned more bullish this week, rising to two-week highs near 1.1730 before consolidating just above 1.17. The move comes amid a softer US Dollar as traders see a September Federal Reserve rate cut as almost certain, political uncertainty in Washington, and improving short-term technical momentum for the euro.
Analysts agree that a sustained break above 1.1780 could mark a turning point, opening the way for a retest of July’s 45-month high at 1.1830 and potentially sparking fresh talk of gains towards the 1.20 level.
According to UoB, “Upward momentum is starting to build again, but at this time, it is not enough to suggest a sustained rise.” The bank added that a move above 1.1780 would be a “potential game-changer” for the pair.
Scotiabank observed that “the EUR’s latest gains have delivered a near full retracement of the decline from late July and the EUR is once again threatening fresh multi-year highs.”
EUR/USD posted a 45-month high of 1.1830 at the start of July. Scotiabank sees a near-term range “between 1.1650 support and 1.1750 resistance.”
Markets remain confident that the Fed will act next month, with futures pricing close to a 95% probability of a September cut. ING noted that disinflation pressure will persist: “With the jobs market not looking as solid as it did earlier in the year and consensus GDP growth forecasts having been cut from 2.5% at the beginning of this year down to 1.5% we believe the Fed will cut the policy rate in September and follow up with additional 25bp cuts in October and December.”
US Treasury Secretary Bessent has stepped up calls for a 50-basis point cut in September, arguing that rates should be in a 2.75-3.00% range from the current 4.50%.

Bloomberg also reported remarks from E.J. Antoni — whom President Trump plans to nominate as the next Bureau of Labor Statistics Commissioner — suggesting monthly jobs data be replaced with quarterly releases. The comments, made before his nomination, have raised concerns over data transparency and the administration’s stance, particularly with Trump continuing his attacks on the Fed and its chair.
Scotiabank noted: “USD selling pressure had abated until President Trump repeated his criticism of Fed Chair Powell and suggested that he might allow a ‘lawsuit’ against Powell to proceed.”
Commerzbank’s Michael Pfister warned of uncomfortable parallels: “Increasingly this carries echoes of autocratic countries, where the heads of statistics agencies or central banks are being replaced. In these countries, critical data series are often discontinued and then reinstated a few months later after the ‘problems’ have supposedly been corrected, with significantly better values.”
He added: “I’m not saying that this will necessarily happen here. But the developments of the last few days and weeks do not exactly fill me with optimism about the future – or the US dollar.”

International Money Transfer? Ask our resident FX expert a money transfer question or try John’s new, free, no-obligation personal service! ,where he helps every step of the way,
ensuring you get the best exchange rates on your currency requirements.
TAGS: Euro Dollar Forecasts
Gold is looking to extend the break above the $3,350 psychological barrier in the Asian trades on Thursday. Gold keeps the green for the third consecutive day, awaiting the US Producer Price Index (PPI) and Jobless Claims data for fresh trading incentives.
Following tame July Consumer Price Index (CPI) and soft labor data from the United States (US), markets have doubled down on their expectations of interest rate cuts by the US Federal Reserve (Fed) this year.
A 25 basis points (bps) rate cut its now fully priced in next month, with some industry experts and even US officials calling for a 50 bps reduction.
On Wednesday, US President Donald Trump called for rates at 1% while Treasury Secretary Scott Bessent on Wednesday called for a “series of rate cuts,” and said the Fed could kick off the policy easing with a half-point cut.
Intensifying dovish sentiment surrounding the Fed keeps the US Dollar (USD) undermined near two-week troughs against its six major currency rivals, providing the much-needed zest to Gold buyers amid a mostly risk-on market environment.
The latest chatter that Trump is considering BlackRock’s Rick Rieder as one of the candidates as new Fed Chairman exacerbated the pain in the Greenback. Rieder argued that he sees scope for a 50 bps Fed cut in September after a downside surprise in the US consumer inflation data.
Additionally, rife concerns over the Fed’s independence and economic prospects remain a drag on the USD, painting a positive picture for the non-yielding/ USD-denominated Gold.
The annual US PPI and core PPI are seen rising by 2.5% and 2.9% in July, respectively while the monthly CPI inflation is expected to tick higher 0.2% in the same period. The core CPI is also seen advancing by 0.2% over the month in July.
An unexpected slowdown in the factory-gate prices could ramp up the odds of a big rate cut, fuelling a fresh rally in Gold while spelling doom for the buck.
The reaction to the US data could be limited as traders turn their attention to Friday’s meeting between Trump and Russian President Vladimir Putin in Alaska on the Ukraine peace deal.
The daily chart leans bullish for Gold as the Relative Strength Index (RSI) remains above the midline.
Buyers need to crack the static resistance near $3,380 to unleash additional upside toward the intermittent highs of $3,440. Ahead of that, the $3,400 round level will be put to the test.
On the downside, 50-day Simple Moving Average (SMA) at $3,350 offers immediate support, a break below which sellers will target the 100-day SMA at $3,302.
Deeper declines will challenge the July 31 low of $3,274.
– Written by
Frank Davies
STORY LINK GBP/USD Forecast: Pound Sterling Softens on Robust US PPI
The Pound to US Dollar (GBP/USD) exchange rate stumbled on Thursday, bringing the pairing’s recent bullish run to an end.
At the time of writing, GBP/USD was hovering near $1.3552, down around 0.2% from Thursday’s opening level.
The US Dollar (USD) trended broadly higher on Thursday, following the release of the latest US producer price inflation figures.
July’s PPI figures outpaced expectations, reporting factory input costs rose 3.3% year-on-year, comfortably above the 2.5% forecast.
The stronger-than-anticipated inflation reading lifted USD as it prompted some traders to dial back expectations for a 50bps interest rate cut from the Federal Reserve next month.
This built on earlier gains for the US Dollar as investors favoured the safe-haven asset ahead of the meeting between US President Donald Trump and Russian President Vladimir Putin.
Although Sterling slipped against the US Dollar, it posted gains versus most other major currencies on Thursday following the release of the UK’s latest GDP figures.
The Office for National Statistics (ONS) reported that the UK economy grew 0.3% in the second quarter, slower than the 0.7% growth in Q1 but comfortably above the 0.1% increase forecast.
Growth in June alone was particularly strong, coming in at 0.4% month-on-month.
The upbeat GDP data helped reinforce hawkish expectations for the Bank of England (BoE), easing pressure on policymakers to speed up rate cuts.
Even so, analysts warned that this solid performance is unlikely to spare the government from introducing fresh tax rises in the autumn budget – a concern that kept Sterling’s rally in check.
Towards the end of the week, GBP/USD movement is likely to be shaped by the latest round of US economic releases due on Friday.
US retail sales figures will be watched closely, with any signs of resilient consumer activity likely to buoy the Dollar.
Shortly after, the University of Michigan’s consumer sentiment index will be published, with forecasts pointing to another improvement in morale, potentially lending further upside to the ‘Greenback’.
Meanwhile, Sterling’s performance may hinge on broader market sentiment. If investors remain risk-averse ahead of the Trump–Putin meeting in Alaska, the Pound could face additional pressure against the US Dollar.
International Money Transfer? Ask our resident FX expert a money transfer question or try John’s new, free, no-obligation personal service! ,where he helps every step of the way,
ensuring you get the best exchange rates on your currency requirements.
TAGS: Pound Dollar Forecasts
The oil market could be even more oversupplied at the end of this year than previously expected amid tepid demand growth and surging supply from both OPEC+ and non-OPEC+ producers, the International Energy Agency (IEA) said on Wednesday.
Global oil demand is now expected to rise by just 680,000 barrels per day (bpd) this year, and by 700,000 bpd in 2026, to reach 104.4 million bpd next year, the IEA said in its monthly Oil Market Report out today.
The latest forecasts are a downward revision of 20,000 bpd in demand growth estimates from the July report—the fifth consecutive from the agency, which has slashed its projection for the 2025 oil demand growth by a combined 350,000 bpd since the beginning of the year.
The latest downgrade reflects “lacklustre demand across the major economies and, with consumer confidence still depressed, a sharp rebound appears remote,” the IEA said.
Consumption in emerging and developing economies has been weaker than expected, with China, Brazil, Egypt and India all revised down compared with last month’s report, the Paris-based agency noted.
The only bright spot in demand has been jet fuel demand, which is on track to increase by 2.1% this year, the strongest of any product, said the IEA. But the agency noted that the overall projected jet fuel consumption of 7.7 million bpd in 2025 would still be about 180,000 bpd lower compared to the 2019 pre-Covid level.
While the IEA downgraded its demand growth estimate, again, it hiked its global supply growth forecast by 370,000 bpd to 2.5 million bpd this year, after the eight OPEC+ members agreed earlier in August to boost output by 547,000 bpd in September, fully unwinding their 2.2 million bpd cuts agreed to in November 2023.
The IEA said that sanctions on Russia and Iran could curb supplies from these producers, but noted that “oil market balances look ever more bloated as forecast supply far eclipses demand towards year-end and in 2026.”
As usual, the IEA is much more bearish on oil demand growth than OPEC, which said in its own report on Tuesday that demand in 2026 is set to strengthen on the back of expected stronger economies in key oil-consuming regions.
By Michael Kern for Oilprice.com
More Top Reads From Oilprice.com
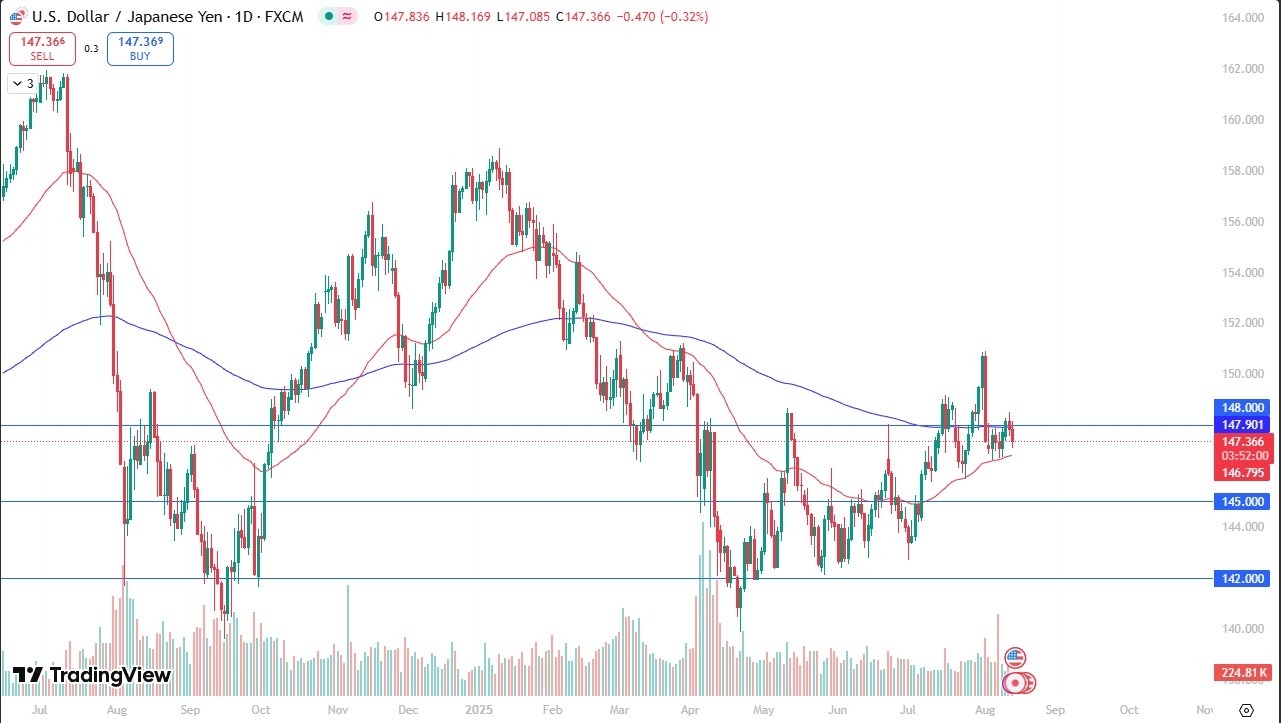
On the downside, if we were to break down below the 50 Day EMA, we could see the US dollar trade down to the ¥146 level, possibly down to the ¥145 level. Ultimately, this is a market that I think is probably one that I do want to remain bullish of, despite the fact that the Federal Reserve might have to cut rates. After all, the interest rate differential between the United States and Japan is wide enough to drive a truck through, meaning that you get paid at the end of every day, even if we were to see one or two interest-rate cuts between now and the end of the year by the Federal Reserve.

The Bank of Japan has been rumored to be worried about inflation for the first time in decades, but I have seen this story multiple times. The reality is that they have massive problems in their bond market right now and will more likely than not have to start to buy the Japanese Government Bonds, which is essentially the same thing as quantitative easing. The Japanese yen may or may not have peaked a couple of months ago, but it certainly looks as if it is a currency that most people don’t want to own. In this particular pair things are a little murkier, mainly due to the Federal Reserve Outlook but you can see that the JPY has lost ground against multiple other currencies. Eventually, I think that shows appear as well although it could be a much more stable and more of a grind to the upside.
Want to trade our USD/JPY forex analysis and predictions? Here’s a list of forex brokers in Japan to check out.
Christopher Lewis has been trading Forex and has over 20 years experience in financial markets. Chris has been a regular contributor to Daily Forex since the early days of the site. He writes about Forex for several online publications, including FX Empire, Investing.com, and his own site, aptly named The Trader Guy. Chris favours technical analysis methods to identify his trades and likes to trade equity indices and commodities as well as Forex. He favours a longer-term trading style, and his trades often last for days or weeks.
The triangle pattern has formed near the top of gold’s long-term uptrend, generally signaling potential for an eventual upside breakout. Yet its clarity also means surprises are possible. A breakout that fails could quickly reverse, leading to a sharp swing in the opposite direction. Traders should remain aware of this scenario, as it has precedent. Last month, a smaller symmetrical triangle broke briefly before reversing, and then a breakdown also failed to follow through.
This led to the expanded current wider consolidation range. Patterns observed near major highs can lead to increased market volatility when false breakouts happen, highlighting the importance of effective risk management.
The triangle boundaries are defined by trendlines connecting recent swing highs and lows. An upside breakout would require a move above $3,409, followed by a push through $3,439. On the downside, a break below the lower boundary, confirmed by a drop beneath the recent higher swing low at $3,268, would show control of the bears and could lead to a deeper retracement.
If $3,268 fails as support, the next area of interest is the 38.2% Fibonacci retracement from the earlier $3,500 record high, which would act as a potential minimum downside target. While this level may hold, traders should be aware that failed breakouts or sudden reversals can push momentum further, making it important to monitor price action closely and adjust strategies as conditions evolve.
For a look at all of today’s economic events, check out our economic calendar.
Important DisclaimersThe content provided on the website includes general news and publications, our personal analysis and opinions, and contents provided by third parties, which are intended for educational and research purposes only. It does not constitute, and should not be read as, any recommendation or advice to take any action whatsoever, including to make any investment or buy any product. When making any financial decision, you should perform your own due diligence checks, apply your own discretion and consult your competent advisors. The content of the website is not personally directed to you, and we does not take into account your financial situation or needs.The information contained in this website is not necessarily provided in real-time nor is it necessarily accurate. Prices provided herein may be provided by market makers and not by exchanges.Any trading or other financial decision you make shall be at your full responsibility, and you must not rely on any information provided through the website. FX Empire does not provide any warranty regarding any of the information contained in the website, and shall bear no responsibility for any trading losses you might incur as a result of using any information contained in the website.The website may include advertisements and other promotional contents, and FX Empire may receive compensation from third parties in connection with the content. FX Empire does not endorse any third party or recommends using any third party’s services, and does not assume responsibility for your use of any such third party’s website or services.FX Empire and its employees, officers, subsidiaries and associates, are not liable nor shall they be held liable for any loss or damage resulting from your use of the website or reliance on the information provided on this website.Risk DisclaimersThis website includes information about cryptocurrencies, contracts for difference (CFDs) and other financial instruments, and about brokers, exchanges and other entities trading in such instruments. Both cryptocurrencies and CFDs are complex instruments and come with a high risk of losing money. You should carefully consider whether you understand how these instruments work and whether you can afford to take the high risk of losing your money.FX Empire encourages you to perform your own research before making any investment decision, and to avoid investing in any financial instrument which you do not fully understand how it works and what are the risks involved.