The main category of Forex News.
You can use the search box below to find what you need.
[wd_asp id=1]
The main category of Forex News.
You can use the search box below to find what you need.
[wd_asp id=1]
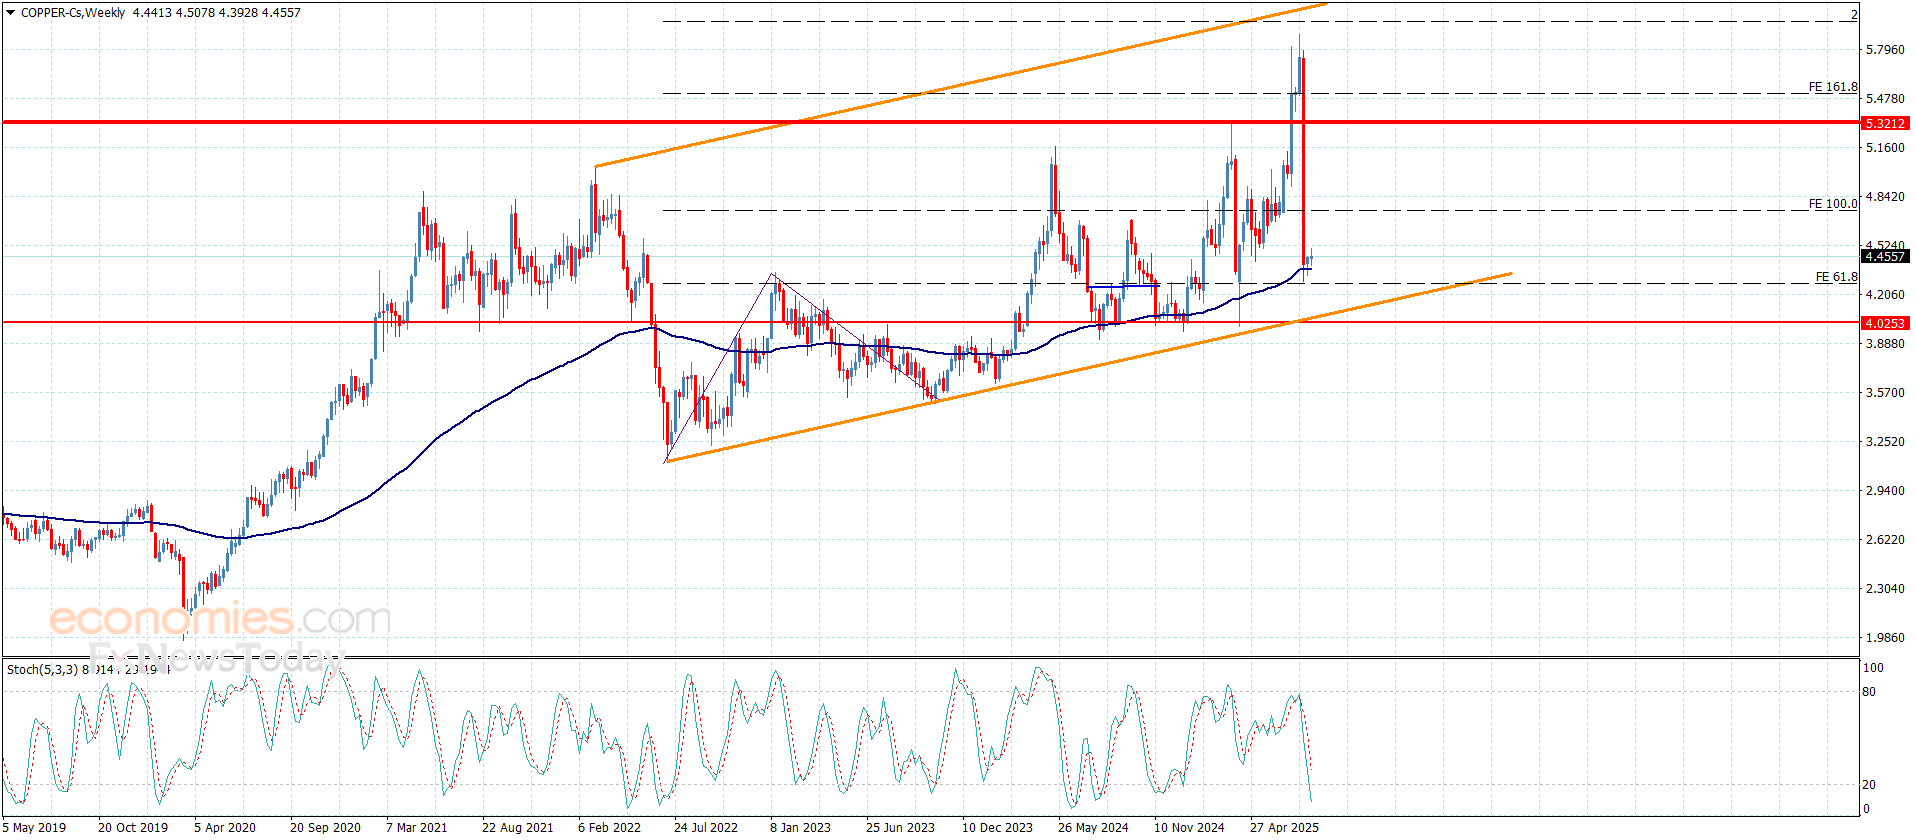
Copper price returned to form weak and sideways trading, attempting to face stochastic negativity that is located within the oversold level, to keep the main stability above the main bullish channel’s support at $4.0500.
The attempt of the moving average 55 to reinforce the stability of the extra support at $4,2600 might help it to provide some positive momentum, to ease the mission of targeting the positive stations near $4.6300 and $4.7400.
The expected trading range for today is between $4.3700 and $4.6300
Trend forecast: Bullish
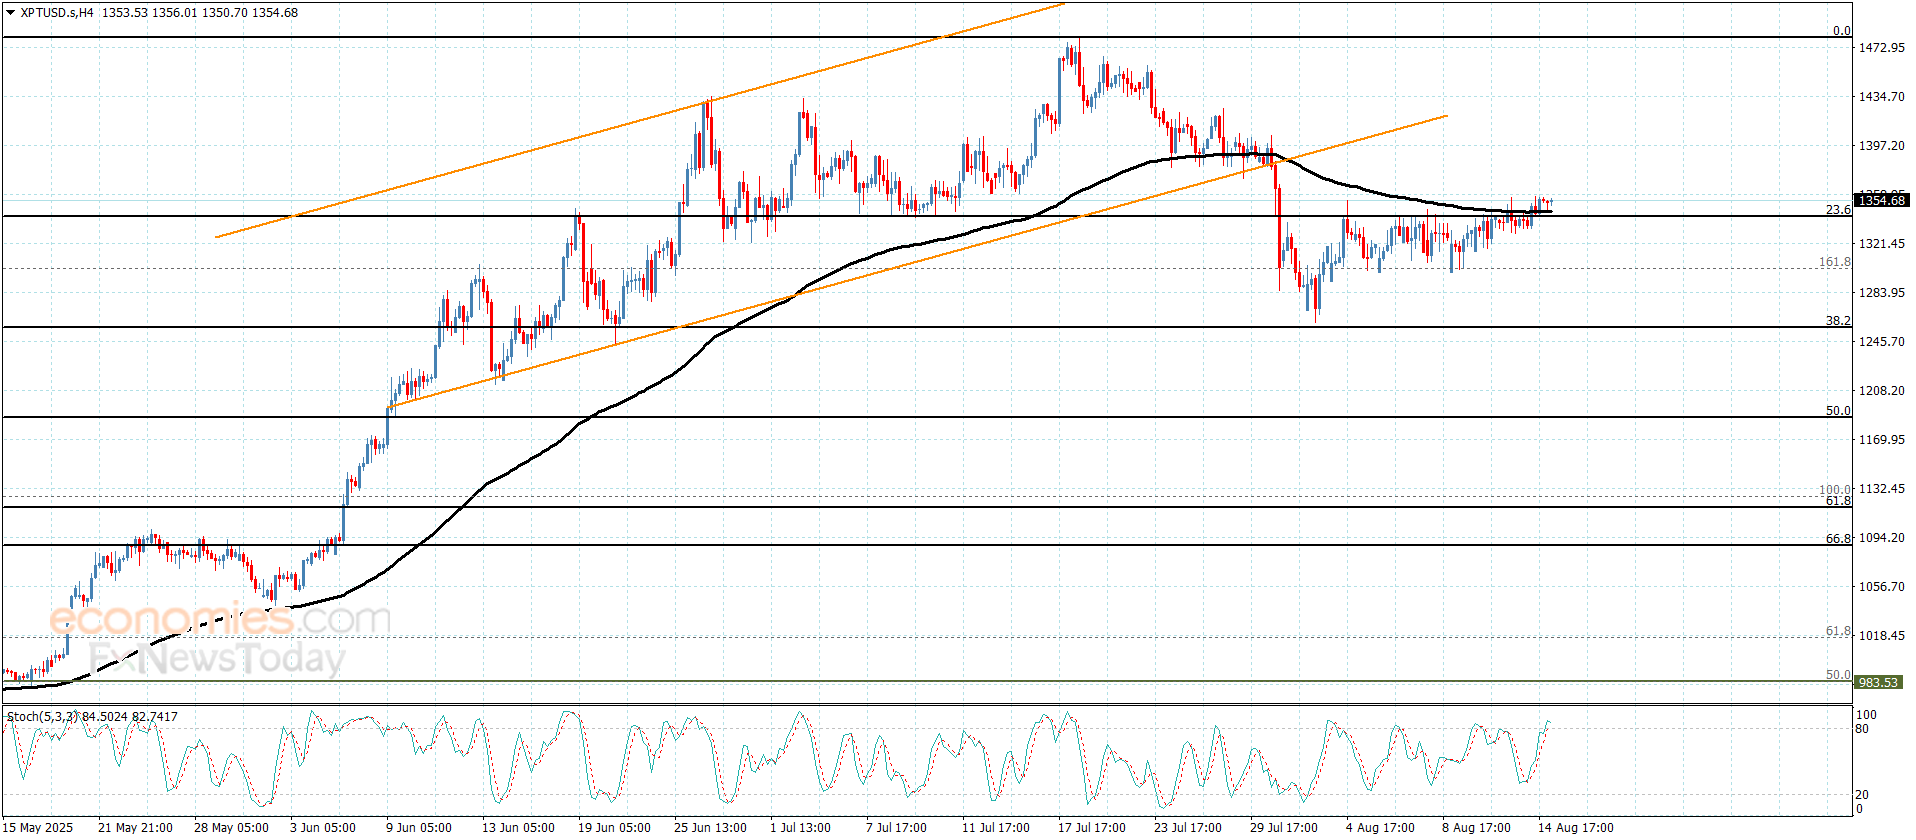
The (silver) price declined in its last trading on the intraday levels, affected by breaking a minor bullish trend line on the short-term basis, surpassing the support of its EMA50, forming more of the negative pressure on the price, on the other hand, we notice the emergence of the positive signals on the (RSI), after reaching oversold levels, indicating the beginning of forming a positive divergence from there, providing positive momentum that assists it to recover if its current support settles.
Get high-accuracy trading signals delivered directly to your Telegram. Subscribe to specialized packages tailored for the world’s top markets:
Full performance report available here:
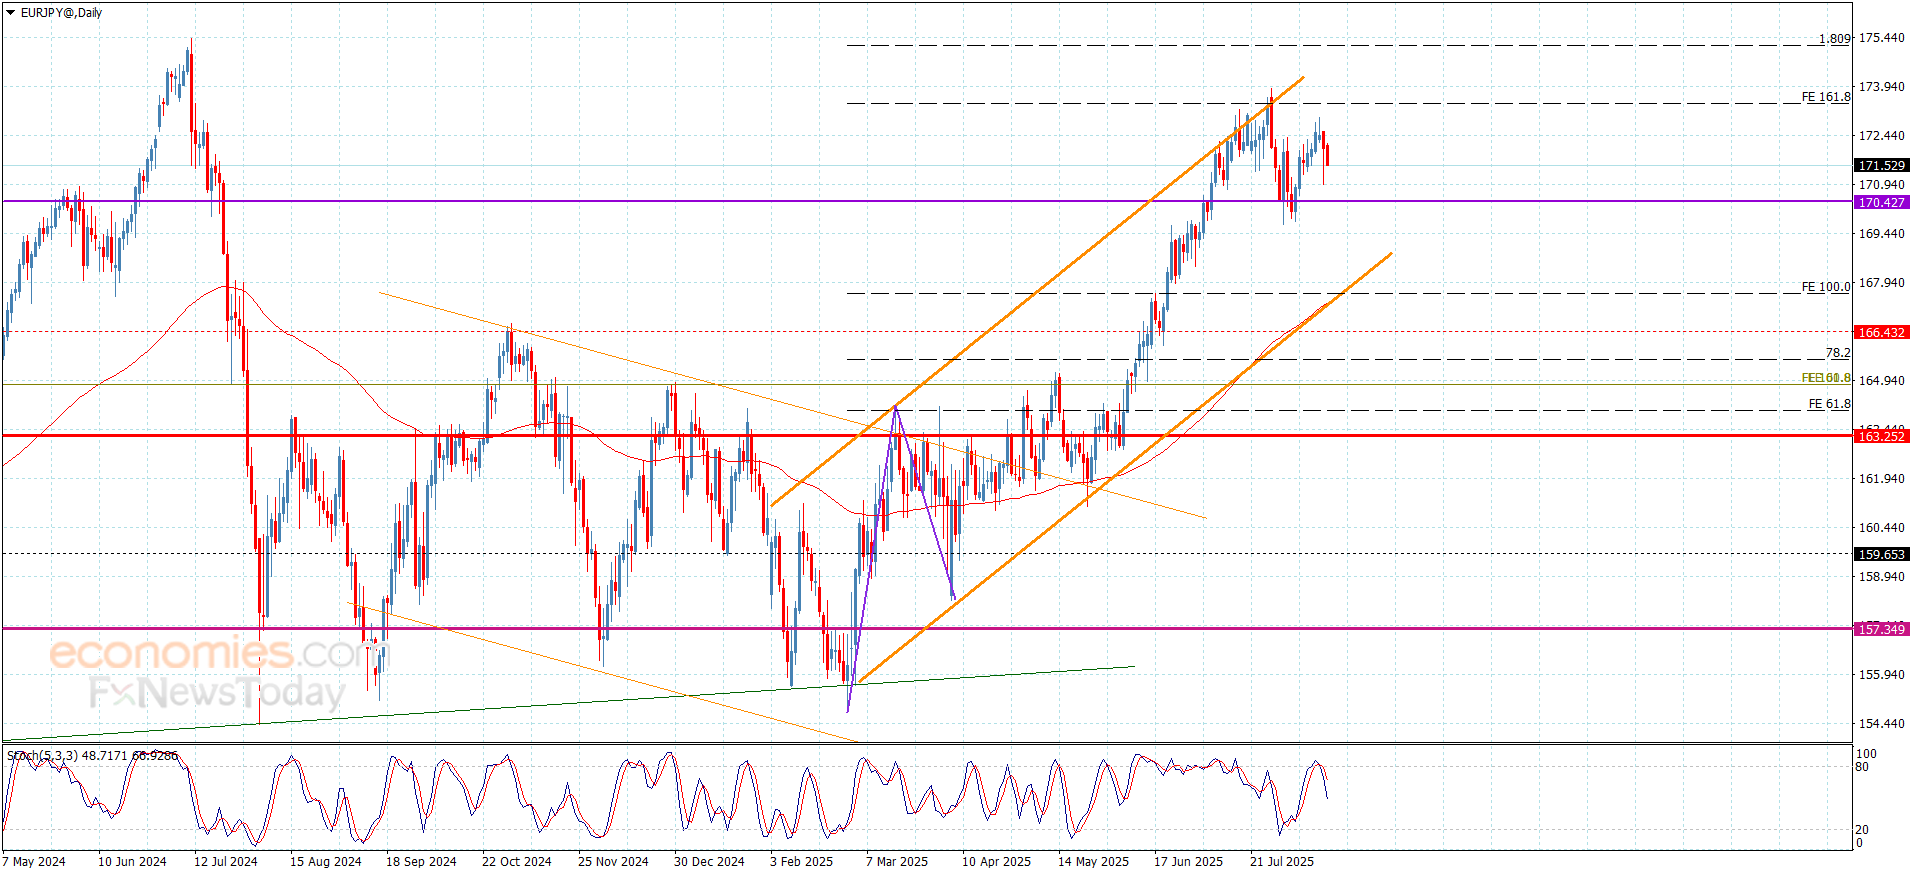
Despite the stability of the EURJPY pair’s stability until this momentum within the levels on the bullish channel, but there are several negative factors that began from providing negative momentum by stochastic, and the stability below 172.00 that forms an important obstacle against the bullish trading, these factors help to confirm the dominance of the bearish correctional track, to keep waiting for targeting the initial support at 170.45, and breaking it will force the price to suffer new losses by reaching 169.45.
While regaining the bullish bias requires forming strong bullish rally, to step above 172.00, attacking the resistance at 173.40 to find an exit to achieve new gains in the upcoming period trading.
The expected trading range for today is between 170.45 and 172.60
Trend forecast: Bearish
Copper price returned to form weak and sideways trading, attempting to face stochastic negativity that is located within the oversold level, to keep the main stability above the main bullish channel’s support at $4.0500.
The attempt of the moving average 55 to reinforce the stability of the extra support at $4,2600 might help it to provide some positive momentum, to ease the mission of targeting the positive stations near $4.6300 and $4.7400.
The expected trading range for today is between $4.3700 and $4.6300
Trend forecast: Bullish
File image of U.S. President Donald Trump. Official White House Photo by Abe McNatt.
Significant gains for the British Pound are possible in this new era of U.S. Dollar devaluation, argues a new research note from QuantMetriks Advisory, the London-based boutique specialising in applied macro and microeconomic research.
According to Dr. Savvas Savouri, Managing Director of QuantMetriks, the Trump administration is reviving past Republican tactics that will yield repeat outcomes: namely, tariff threats that trigger a devaluation of the U.S. Dollar.
Drawing parallels with Reagan (1985), Bush Jr. (2005), and Nixon (1971), Savouri says the current environment is ripe for another engineered dollar slide, as the next instalment of this Republican “blockbuster” franchise plays out.

Pound Sterling Live consistently delivers stronger rates than major UK banks.
In July, you could have saved up to €1,720 on a £50,000 transfer thanks to our competitive pricing.
Based on average GBP/EUR rates observed in July.
Savouri leads a team that leverages a proprietary economic modelling system, drawing on deep sectoral data across major economies.
He has amassed over three decades of experience across both the sell-side and buy-side, with roles at notable institutions including Hoare Govett Securities, Credit Lyonnais Securities, Commerzbank Securities, Lazard, and Toscafund Asset Management, where he served as Chief Economist.
Savouri has long been bullish on the Pound, and concedes that he has been calling the “pound up for a long time. Well, this is not so much my last time as the right time.”
(Readers might also be interested in our latest Q3 GBP/EUR and EUR/GBP consensus forecast data, which is now out; click here to request and see the mean and median forecasts at the world’s leading investment banks).
The tectonic plates of FX are moving as Trump pursues a weaker Dollar to bolster U.S. exports and lower imports, thereby rebalancing U.S. trade dynamics out of deficit.
Stephen Miran, Chairman of the Council of Economic Advisers in Trump’s White House, has spelt out the agenda:
“The desire to reform the global trading system and put American industry on fairer ground vis-à-vis the rest of the world has been a consistent theme for President Trump for decades.
“The root of the economic imbalances lies in persistent dollar overvaluation that prevents the balancing of international trade.”
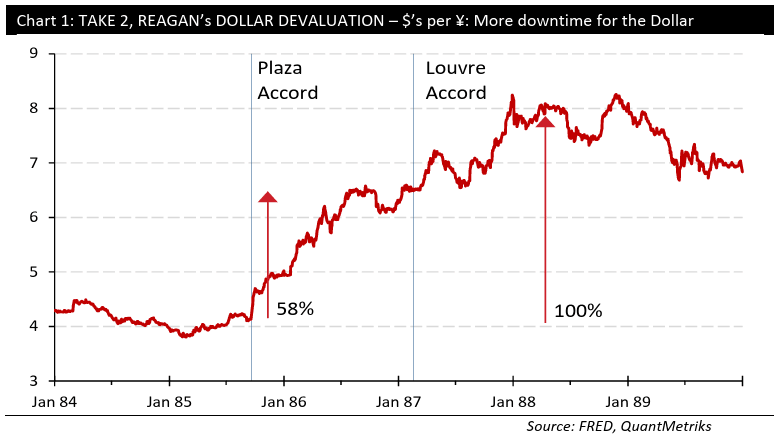
To achieve a weaker Dollar, Trump will pursue the playbook used by his predecessors, namely the threat of significant tariffs on trade partners.
On previous occassions, “the real & present threat of tariffs saw 11-hour agreements to allay them… Japan & then China each in their respective times, agreed to devalue the Dollar,” explains Savouri.
The implications for the Pound are significant: Savouri states unequivocally that if history repeats and the dollar weakens as expected, then “it’s a certainty the pound will rally against the dollar.”
“Yes, having languished for so long, the pound will rise against the dollar… the pound will also rise relative to the euro,” he says.
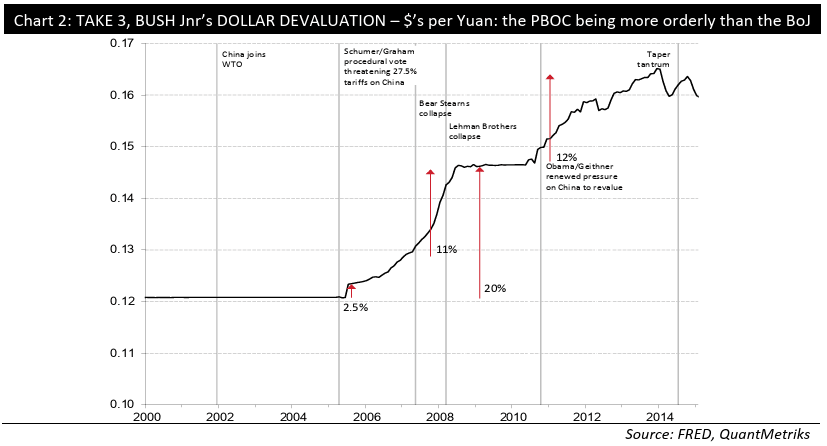
Gains against the Euro are also likely as the eurozone is described as facing deepening structural weakness, exacerbated by a rising euro (relative to USD and JPY).
Savouri says the deterioration in domestic fundamentals would likely force the European Central Bank (ECB) into aggressive monetary easing, possibly even renewed quantitative easing.
In contrast, the Bank of England will struggle to justify market expectations of further rate cuts because UK real economic indicators are described as “relatively OK,” while inflation is still sticky at around 3%.
In fact, the QuantMetriks forecast for Bank Rate over the 2025-2029 period is 4.00 to 5.00%.
Savouri expects any upward move in the Pound to be sharp and self-reinforcing, noting:
“When the pound does begin to move higher… it will do so as steeply as when it has behaved that way in the past.”
QuantMetriks forecasts the Pound to Dollar exchange rate to rise to 1.60–1.70 in the 2025-2029 horizon, from a current level of 1.35.
The Pound to Euro exchange rate is expected to rise to 1.30–1.40 during this period.
Despite the stability of the EURJPY pair’s stability until this momentum within the levels on the bullish channel, but there are several negative factors that began from providing negative momentum by stochastic, and the stability below 172.00 that forms an important obstacle against the bullish trading, these factors help to confirm the dominance of the bearish correctional track, to keep waiting for targeting the initial support at 170.45, and breaking it will force the price to suffer new losses by reaching 169.45.
While regaining the bullish bias requires forming strong bullish rally, to step above 172.00, attacking the resistance at 173.40 to find an exit to achieve new gains in the upcoming period trading.
The expected trading range for today is between 170.45 and 172.60
Trend forecast: Bearish
– Written by
James Fuller
STORY LINK Pound Sterling to Dollar Forecast: GBP/USD Eyes Bullish Break Amid Fed Speculation
The Pound to Dollar exchange rate forecasts improved midweek as GBP/USD climbed to a one-month high near 1.3590, buoyed by stronger UK GDP data and persistent weakness in the US dollar. Sterling buyers are now assessing whether the British currency can overcome key resistance at 1.3620, opening the door to multi-year highs.
The US dollar has remained under pressure in global markets as expectations for Federal Reserve interest rate cuts continue to build. Meanwhile, the latest UK GDP figures have underpinned the pound to dollar exchange rate, despite lingering concerns over the underlying data.
A relatively calm global backdrop is also helping to underpin pound sterling.
Danske Bank noted: “The low-volatility, risk-on environment remains intact, with Treasury yields declining, equities advancing, and the USD weakening.”
The GBP/USD exchange rate posted steady gains on Wednesday, reaching a one-month peak of 1.3590 after the GDP release before consolidating just below that level.
According to UoB: “Strong momentum is likely to outweigh the overbought conditions, and GBP may test the major resistance at 1.3620 today. It remains to be seen if it can break and hold above this level.”
Scotiabank also highlighted that important resistance lies close to 1.3620. Any clear break above this could increase speculation of a move towards 41-month highs near 1.3800.

GBP/USD forecast factors remain centred on both US and UK developments, alongside key geopolitical events. ING observed: “The proximity to tomorrow’s Trump-Putin meeting might argue against adding much more USD shorts just yet. But the bias remains unequivocally negative for the greenback.”
The UK economy recorded 0.4% GDP growth in June, beating forecasts of 0.2% and reversing a 0.1% contraction in May. The second quarter as a whole saw 0.3% growth compared with expectations of just 0.1%.
ING said: “At face value, the UK’s 0.3% second-quarter growth performance looks reasonable amid a flurry of global and domestic headwinds. But this is largely concentrated in components not intrinsically linked to underlying economic performance.”
They added: “We certainly expect the GDP figures in the second half of the year to have a weaker flavour to them. The jobs market is under pressure; payrolled employment has fallen in eight out of the last nine months. Investment intentions are lower, too. And despite the UK-US trade deal, the much bigger issue for UK firms is the uncertainty surrounding the global economic outlook caused by tariffs.”
The dollar’s weakness has been compounded by growing expectations for aggressive Fed rate cuts. In September, the focus is no longer on whether the Fed will cut, but by how much.
There has been increased lobbying for a 50-basis-point cut from Treasury Secretary Bessent, with the Administration also pressing for a more aggressive easing path.
Bessent stated: “I think we could go in series of rate cuts here, starting with a 50bps cut in September. If you look at any model it suggests that we should probably be 150, 175 basis points lower.”

Scotiabank commented: “Investors are forced to ponder implications for Fed independence, US data integrity and whether, even with inflation sticky around 3% still, the Fed might proceed with a (perhaps aggressive?) rate cut in September anyway.”
International Money Transfer? Ask our resident FX expert a money transfer question or try John’s new, free, no-obligation personal service! ,where he helps every step of the way,
ensuring you get the best exchange rates on your currency requirements.
TAGS: Pound Dollar Forecasts
The GBP/JPY pair slides 0.3% to near 199.30 during the Asian trading session on Friday. The cross faces a sharp selling pressure as the Japanese Yen (JPY) has strengthened, following the release of the surprisingly upbeat preliminary Q2 Japan’s Gross Domestic Product (GDP) data.
The table below shows the percentage change of Japanese Yen (JPY) against listed major currencies today. Japanese Yen was the strongest against the US Dollar.
| USD | EUR | GBP | JPY | CAD | AUD | NZD | CHF | |
|---|---|---|---|---|---|---|---|---|
| USD | -0.13% | -0.11% | -0.54% | -0.10% | -0.15% | -0.07% | -0.15% | |
| EUR | 0.13% | 0.01% | -0.33% | 0.03% | -0.05% | 0.05% | -0.02% | |
| GBP | 0.11% | -0.01% | -0.34% | 0.02% | -0.06% | 0.04% | -0.03% | |
| JPY | 0.54% | 0.33% | 0.34% | 0.35% | 0.30% | 0.42% | 0.28% | |
| CAD | 0.10% | -0.03% | -0.02% | -0.35% | -0.00% | 0.02% | -0.05% | |
| AUD | 0.15% | 0.05% | 0.06% | -0.30% | 0.00% | 0.02% | 0.02% | |
| NZD | 0.07% | -0.05% | -0.04% | -0.42% | -0.02% | -0.02% | -0.07% | |
| CHF | 0.15% | 0.02% | 0.03% | -0.28% | 0.05% | -0.02% | 0.07% |
The heat map shows percentage changes of major currencies against each other. The base currency is picked from the left column, while the quote currency is picked from the top row. For example, if you pick the Japanese Yen from the left column and move along the horizontal line to the US Dollar, the percentage change displayed in the box will represent JPY (base)/USD (quote).
Earlier in the day, the Japanese Cabinet Office reported that the GDP expanded by 0.3% after remaining flat in the previous quarter. Economists expected a moderate growth of 0.1%. On an annualized basis, the economy grew strongly by 1% after a GDP contraction of 0.2% in the previous quarter.
Upbeat GDP data has increased hopes of more interest rate hikes by the Bank of Japan (BoJ) in the near term. On Wednesday, United States (US) Treasury Secretary Scott Bessent said that the BoJ is behind the curve and would tighten its monetary policy further.
Meanwhile, the Pound Sterling (GBP) trades broadly calm on expectations that the Bank of England (BoE) will stick to its “gradual and careful” monetary easing outlook as elevated inflation and better-than-projected Q2 GDP data would offset the impact of labor market concerns.
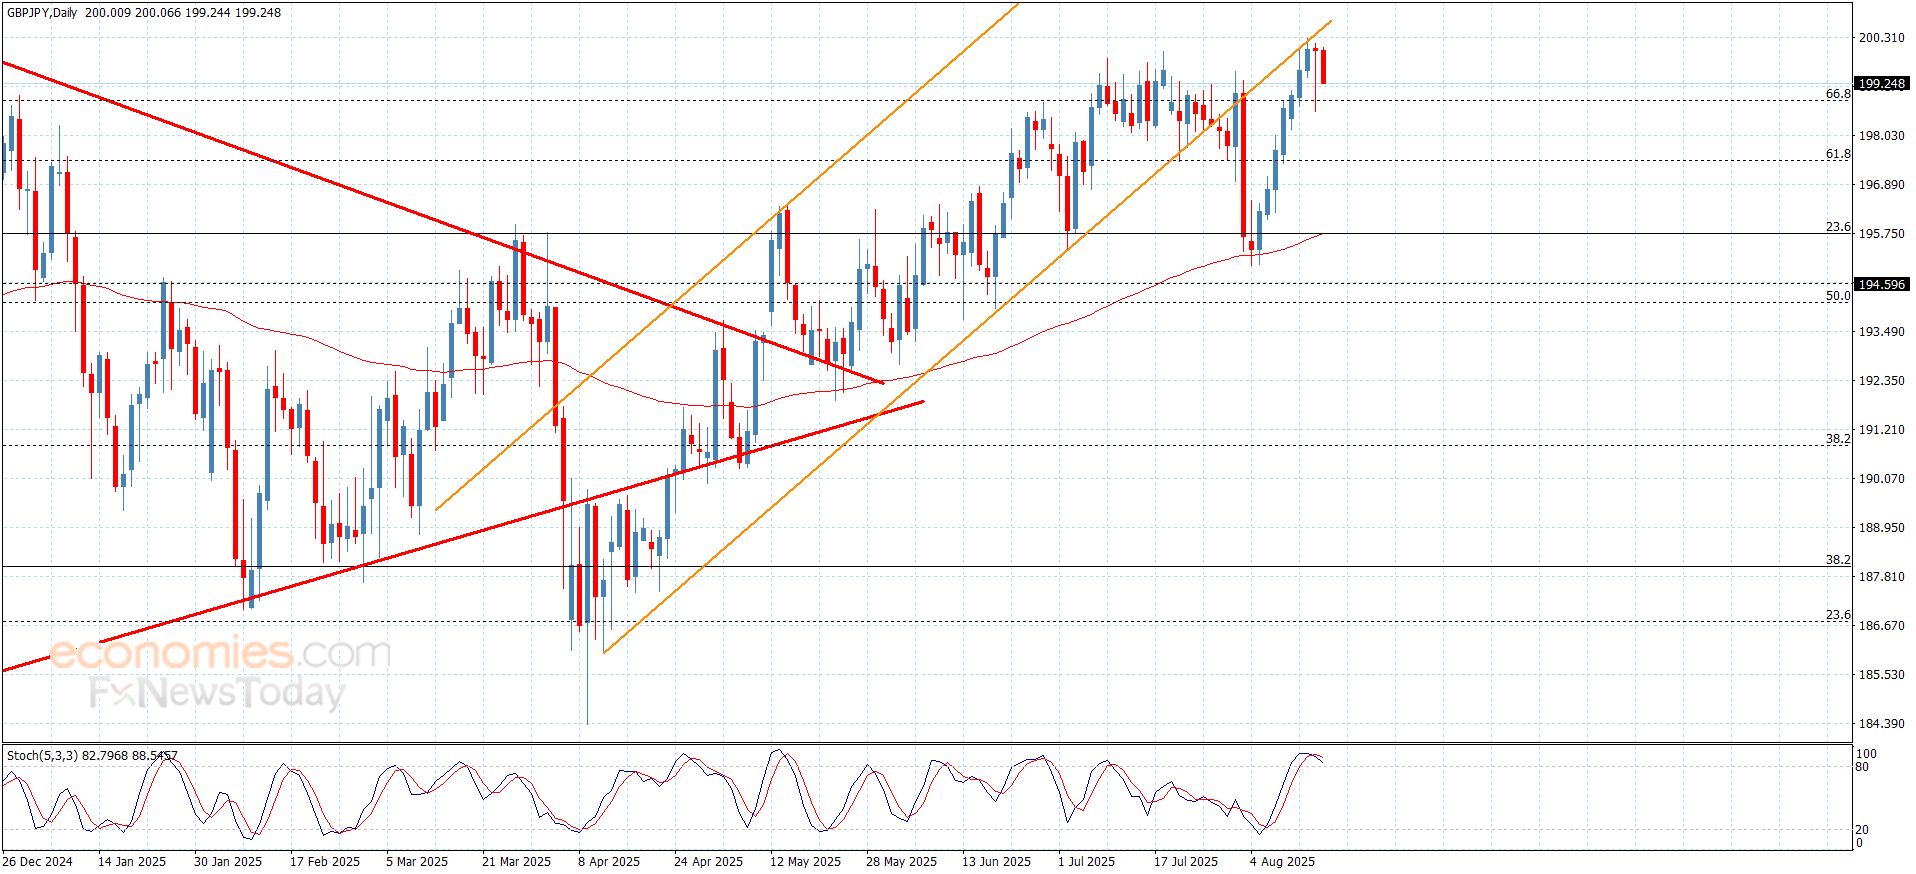
GBP/JPY continues to face selling pressure near the psychological level of 200.00. However, the near-term trend of the cross remains bullish as the 100-day Exponential Moving Average (EMA) slopes higher around 195.95.
The 14-day Relative Strength Index (RSI) struggles to break above 60.00. A fresh bullish momentum would emerge if the RSI manages to do so.
The pair could extend its upside towards the 23 July 2024 high of 203.16 and the 19 July 2024 high of 204.23, if it stabilizes above the psychological level of 200.00.
On the flip side, a downside move by the pair below the May 6 low of 190.33 will expose it to the March 11 low of 188.80, followed by the February 7 low of 187.00.
The Gross Domestic Product (GDP), released by Japan’s Cabinet Office on a quarterly basis, is a measure of the total value of all goods and services produced in Japan during a given period. The GDP is considered as the main measure of Japan’s economic activity. The QoQ reading compares economic activity in the reference quarter to the previous quarter. Generally, a high reading is seen as bullish for the Japanese Yen (JPY), while a low reading is seen as bearish.
Last release:
Thu Aug 14, 2025 23:50 (Prel)
Frequency:
Quarterly
Actual:
0.3%
Consensus:
0.1%
Previous:
0%
Source:
Japanese Cabinet Office
The US dollar has fallen a bit against the Japanese yen, but in all fairness, the Japanese yen has strengthened against almost everything. It’s not just the US dollar. So, with that being said, it will be interesting to see how this plays out. I think this is just a simple risk off trade, not only here, but with other yen denominated pairs. We are through the 50 day EMA, but I imagine there’s probably plenty of buyers between here and 145 yen who are more than willing to try to turn this thing around.
Finally, over here in the Australian Dollar we initially tried to rally but we gave back the gains and now it looks like we are trying to roll over, as the previous channel still finds itself as being influential in this market. But I would also point out the 0.6550 level as an area that is a bit of a problem. You can see it’s been support and resistance so many times in the past. It’s almost like a magnet for price.
At this point though, it doesn’t look like we’re very comfortable going above there and you could see this market roll over. If it does, then it confirms a lower high, and that would be the first sign of a real trend change. Either way, I think the Australian dollar continues to underperform some of its contemporaries against the US dollar.
For a look at all of today’s economic events, check out our economic calendar.
For several days, natural gas has been testing support around the 78.6% Fibonacci retracement of a prior upswing. This appears to be a pause in the downtrend, and the expectation remains that the bear trend will resume once the short-term consolidation phase is complete. If a bounce occurs first, the behavior of price near potential resistance zones should reveal more about shifting supply and demand dynamics.
Tuesday’s sharp decline marked a decisive break below a critical support area that had been tested repeatedly in recent weeks. This zone was defined by the confluence of a long-term uptrend line and an anchored volume-weighted average price (AVWAP) from the 2024 trend low. Also included was the April swing low at $2.86, which served as an extended boundary for the zone.
Once $2.86 was broken, a bearish continuation signal was triggered, confirming the continuation of an ABCD decline from the March trend high. The bearish signal was reinforced by a daily close below $2.86. It will establish longer-term bearish confirmation on the weekly chart if the week finishes below that price.
Downside projections begin with $2.63, the completion of a smaller descending ABCD pattern (purple). Below that, the next target is the 78.6% retracement of a larger upswing than the earlier Fibonacci measure. Given the recent long-term breakdown through major support, the technical bias favors lower levels before the current bearish correction runs its course.
If a rally develops and clears the two-day high of $2.85, natural gas could stage a countertrend move toward a resistance zone between $2.96 and $3.07. The lower end of this zone aligns with the AVWAP level, while the upper boundary is defined by the declining 20-Day moving average. As the 20-Day MA continues to fall, the top of the resistance range will gradually shift lower.
For a look at all of today’s economic events, check out our economic calendar.