The main category of Forex News.
You can use the search box below to find what you need.
[wd_asp id=1]
The main category of Forex News.
You can use the search box below to find what you need.
[wd_asp id=1]
GBP/USD moves sideways in a tight channel above 1.3250 in the European session on Friday after posting small gains on Thursday. The pair remains on track to end the week in positive territory.
The US Dollar (USD) Index, which tracks the USD’s performance against a basket of six major currencies, closed marginally higher on Thursday, supported by the upbeat weekly Initial Jobless Claims data. The number of first-time applications for unemployment benefits declined to 215,000 from 224,000 in the previous week. Read more…
After reaching a fresh 2025-high near 1.3300 on Wednesday, GBP/USD lost its bullish momentum and ended the day virtually unchanged. The pair extends its sideways grind at around 1.3250 in the European session on Thursday.
The improving risk sentiment helps GBP/USD hold its ground on Thursday but the modest recovery seen in the US Dollar (USD) limits the pair’s upside. Read more…
Following a lower swing high of $4.25 on March 3, the bearish correction from the recent peak of $4.90 accelerated to the downside. This can be seen as the price of natural gas was rejected from the top of the channel. It then fell back below the 50-Day MA and then the midline (green dashes) of a falling trend channel as highlighted in red. The original channel is bound by blue trendlines, and a 25% extension was added to the bottom with a green lower line.
Over the past several days resistance was successfully tested around the lower blue channel line, and it has held up so far. Once prior support becomes resistance, the downtrend may be ready to continue. In summary, these are bearish signs. Natural gas remains in a clear downtrend and bearish momentum has been increasing.
Despite the overall bearish indications, natural gas is in a position that could lead to a bullish reversal. A potential support zone around the 88.6% Fibonacci retracement of $3.21 has been tested as support for several days and again on Thursday with a new retracement low of $3.19. It continues to indicate support even though there is a recent series of lower daily lows and is supported by the lower end of the descending channel. Now, on Thursday an outside day was produced as a new trend low was reached earlier in the session followed by a rise above Wednesday’s high.
A bullish breakout and possible one-day bullish reversal will trigger on a rally above $3.33. The first stop on the way up looks to be a recent interim lower swing high from Monday. Further up is the 20-Day MA, now at $3.73, followed by another lower swing high at $3.83. Subsequently, the 50-Day MA may indicate signs of resistance. It is now at $3.90.
For a look at all of today’s economic events, check out our economic calendar.
The US dollar has pulled back just a bit against the Swiss franc during the Good Friday session, but I think you are starting to see the 0.81 level as a potential major support level. If we can break above the 0.8250 level, then I think we could open up the possibility of a move to the 0.84 level. A breakdown below the 0.81 level opens up the possibility of 0.80, but I think at that point, the Swiss National Bank starts to pay a little bit of attention to the strength of the Franc, assuming that the Euro falls against the Frank as well. After all, the Swiss National Bank has no qualms about intervening if the franc gets too strong in general.
The US dollar has bounced slightly against the Canadian dollar as we are hanging around the crucial 1.3850 level. The 1.3850 level is an area that has been important multiple times in the past, as it was an area that was like a brick wall. So, the market memory is starting to come into the picture, and if we were to turn around and break above the 1.40 level, then perhaps the US dollar could go higher. But as things stand right now, I’m starting to hear calls of the US dollar no longer being the world’s reserve currency, and that’s almost a perfect technical sign to go in the other direction.
We don’t have that yet. We don’t have momentum. But trade deals could put the focus on everything else in the world right now, which of course is a bit of a mixed bag of optimism and pessimism that could drive money back into the U.S. Yields in America are certainly much higher than Canada or many of these other currencies. So eventually that might come into the picture as well as soon as we get some deals done.
For a look at all of today’s economic events, check out our economic calendar.
The US dollar has been very quiet against the Japanese yen. I think this will be an interesting pair to watch due to the fact that it has been stated by several US officials that there is significant progress in trade talks with the Japanese. So, this could be an interesting pair. The 140 yen level underneath is a significant support level that has been important multiple times over the longer term. So, I’m watching this with great interest. We are presently finding some support around 142 yen, but I think at this point in time, if we give up 140 yen, then we could see the Japanese yen strengthened quite wildly, perhaps all the way down to the 129 yen level against the US dollar.
That being said, I think as I look around the Forex world, the US dollar is at least trying to stabilize and without going too deep in the woods with the Euro Dollar situation, Eurodollar, not Euro against the dollar. Foreign reserves of US dollars will need to be adjusted due to a repatriation of funds and a warping of the demand for currencies. After all, US dollars pay most of the world’s debt. So, I do think that this has been a very impressive move, but you can make an argument that it begins to turn around. Watch carefully, 140 yen should tell you the whole story.
The Australian dollar has pulled back from the crucial 0.64 level. This is an area that has been rather important more than once. And you can see that Good Friday was no different. The 200-day EMA sits above there and could offer a bit of technical resistance as well. So, keep that in mind. But all things being equal, this is a pair that I think will be driven by the US negotiations with China or, at this point, the lack of them and therefore, I would expect a wild swing sooner or later as the Australian economy is so interconnected with China.
If we can break above the 200-day EMA on a strong daily close, then we could see the Aussie dollar rise all the way to the 0.66 level based on a measured move. If we break down below the hammer that formed on Thursday, that could send this pair back down to the 50-day EMA, perhaps even the 0.62 level, which was the bottom of the previous consolidation range.
For a look at all of today’s economic events, check out our economic calendar.
Despite downward pressure, natural gas will complete an outside day as there was an advance above Wednesday’s high of $3.32 to $3.33 today. Recent highs indicate that the market seems to be recognizing the declining channel lines. Although natural gas continues to show weakness as it may end the day at its lower daily closing price for the corrective decline, which previously was $3.27 from Wednesday, it may close today below the lower boundary line of the original channel (blue lines).
Nevertheless, a decisive rally above Thursday’s high of $3.33 triggers a one-day bullish reversal and reclaims the lower end of the original channel. A daily close above today’s high would then be needed to confirm strength. There are two initial potential upside targets, while the middle green dashed line of the channel can help as a guide. The first upside target is the most recent interim lower swing high at $3.61, followed by the 20-Day MA, currently at $3.73. Keep in mind that since the 20-Day line is falling it may reach the area around the $3.61 level or lower before it is tested as resistance.
On the downside, if natural gas continues to fall below $3.19 and keeps going, there are several reasons that support may be seen within a range of $3.08 to $2.99. The potentially significant 200-Day MA is within that range at $3.06 currently.
For a look at all of today’s economic events, check out our economic calendar.
The technical analysis for this market is somewhat stagnant at the moment, as the 50 Day EMA sits just below the current trading range, and this does suggest that perhaps we are sitting on potential technical support. Beyond that, the ¥160 level of course, is an area that a lot of people will be watching, as it is a large, round, psychologically significant figure, and of course an area that has been important more than once.

On the upside, if we were to break above the ¥164 level, then it opens up the possibility of a move to the ¥165 level. In general, I think you’ve got a situation where traders will continue to perhaps kick the EUR/JPY pair between the ¥160 level on the bottom, and the ¥165 level on the top, essentially making this a flat and sideways market. However, if you are a short-term range bound trader, this could be a currency pair that you excel in as it looks like it has nowhere to be.
Expect volatile and choppy trading, but I think you can say that about pretty much any market at this point. I don’t like the idea of taking on a position right now, so position sizing will be crucial going forward. I am looking at this pair through the prism of small position, and short-term trade ideas.
Begin trading our daily forecasts and analysis. Here is a list of Forex brokers in Japan to work with.
Gain access to all that Trend has to offer, as well as to premium, licensed content via subscription or direct purchase through a credit card.
EUR/USD trades in a narrow channel at around 1.1370 after closing in negative territory on Thursday. With major financial markets remaining closed in observance of the Easter Holiday on Friday, the pair is likely to extend its sideways grind heading into the weekend.
The table below shows the percentage change of Euro (EUR) against listed major currencies this week. Euro was the strongest against the Swiss Franc.
| USD | EUR | GBP | JPY | CAD | AUD | NZD | CHF | |
|---|---|---|---|---|---|---|---|---|
| USD | -0.04% | -1.38% | -1.10% | -0.14% | -1.31% | -2.55% | -0.06% | |
| EUR | 0.04% | -0.83% | -0.62% | 0.36% | -0.81% | -2.08% | 0.42% | |
| GBP | 1.38% | 0.83% | 0.62% | 1.18% | 0.02% | -1.26% | 1.26% | |
| JPY | 1.10% | 0.62% | -0.62% | 0.95% | -0.46% | -0.92% | 1.17% | |
| CAD | 0.14% | -0.36% | -1.18% | -0.95% | -1.30% | -2.41% | 0.00% | |
| AUD | 1.31% | 0.81% | -0.02% | 0.46% | 1.30% | -1.27% | 1.24% | |
| NZD | 2.55% | 2.08% | 1.26% | 0.92% | 2.41% | 1.27% | 2.58% | |
| CHF | 0.06% | -0.42% | -1.26% | -1.17% | -0.00% | -1.24% | -2.58% |
The heat map shows percentage changes of major currencies against each other. The base currency is picked from the left column, while the quote currency is picked from the top row. For example, if you pick the Euro from the left column and move along the horizontal line to the US Dollar, the percentage change displayed in the box will represent EUR (base)/USD (quote).
The European Central Bank (ECB) announced on Thursday that it lowered key rates by 25 basis points (bps) following the April policy meeting. This decision came in line with the market expectation and failed to trigger a noticeable market reaction.
While speaking at the post-meeting press conference, ECB President Christine Lagarde adopted a cautious tone, noting that the Eurozone’s economic outlook is clouded by uncertainty.
In the meantime, the data from the US showed that the weekly Initial Jobless Claims declined to 215,000 from 224,000 in the previous week. The US Dollar (USD) held its ground following this data and made it difficult for EUR/USD to gain traction.
Early Friday, ECB policymaker Francois Villeroy de Galhau argued that the inflation risk from trade tensions seems weak and could even be downward, per Reuters.
The economic calendar will not feature any high-tier data releases on Friday.
The Relative Strength Index (RSI) indicator on the 4-hour chart moves sideways slightly below 60, suggesting that the bullish bias remains intact but lacks momentum.
On the downside, immediate support is located at 1.1350 (20-period Simple Moving Average) before 1.1280 (static level) and 1.1250 (lower limit of the ascending channel). Looking north, resistances could be spotted at 1.1400 (static level), 1.1470 (midpoint of the ascending channel) and 1.1500 (round level).
The European Central Bank (ECB) in Frankfurt, Germany, is the reserve bank for the Eurozone. The ECB sets interest rates and manages monetary policy for the region.
The ECB primary mandate is to maintain price stability, which means keeping inflation at around 2%. Its primary tool for achieving this is by raising or lowering interest rates. Relatively high interest rates will usually result in a stronger Euro and vice versa.
The ECB Governing Council makes monetary policy decisions at meetings held eight times a year. Decisions are made by heads of the Eurozone national banks and six permanent members, including the President of the ECB, Christine Lagarde.
In extreme situations, the European Central Bank can enact a policy tool called Quantitative Easing. QE is the process by which the ECB prints Euros and uses them to buy assets – usually government or corporate bonds – from banks and other financial institutions. QE usually results in a weaker Euro.
QE is a last resort when simply lowering interest rates is unlikely to achieve the objective of price stability. The ECB used it during the Great Financial Crisis in 2009-11, in 2015 when inflation remained stubbornly low, as well as during the covid pandemic.
Quantitative tightening (QT) is the reverse of QE. It is undertaken after QE when an economic recovery is underway and inflation starts rising. Whilst in QE the European Central Bank (ECB) purchases government and corporate bonds from financial institutions to provide them with liquidity, in QT the ECB stops buying more bonds, and stops reinvesting the principal maturing on the bonds it already holds. It is usually positive (or bullish) for the Euro.
(The story was corrected on April 18 at 08:16 GMT to say in the first bullet point that EUR/USD moves sideways above 1.1350 on Friday, not Thursday).
The World Trade Organization now forecasts a 0.2% contraction in global goods trade this year, adding to the risk-off tone. Meanwhile, the weakening DXY has enhanced gold’s relative appeal for foreign investors.
Federal Reserve Chair Jerome Powell signaled caution on rate cuts, pointing to persistent inflation and uneven economic momentum. Markets still price in 86 basis points of cuts by year-end 2025, with July flagged as the earliest likely move.
U.S. jobless claims declined to 215,000, suggesting labor market resilience, though continuing claims ticked up to 1.885 million. March housing data was mixed—permits rose 1.6%, while starts slipped.
Despite the recent pullback, gold’s broader trend remains constructive. As long as rate uncertainty lingers and trade risks persist, investor demand for safe-haven assets like gold and silver is likely to remain firm.
Gold holds above $3,322 support as trade risks and a weak dollar sustain safe-haven demand. Silver eyes $33.11 resistance, but momentum hinges on holding key support near $32.12.
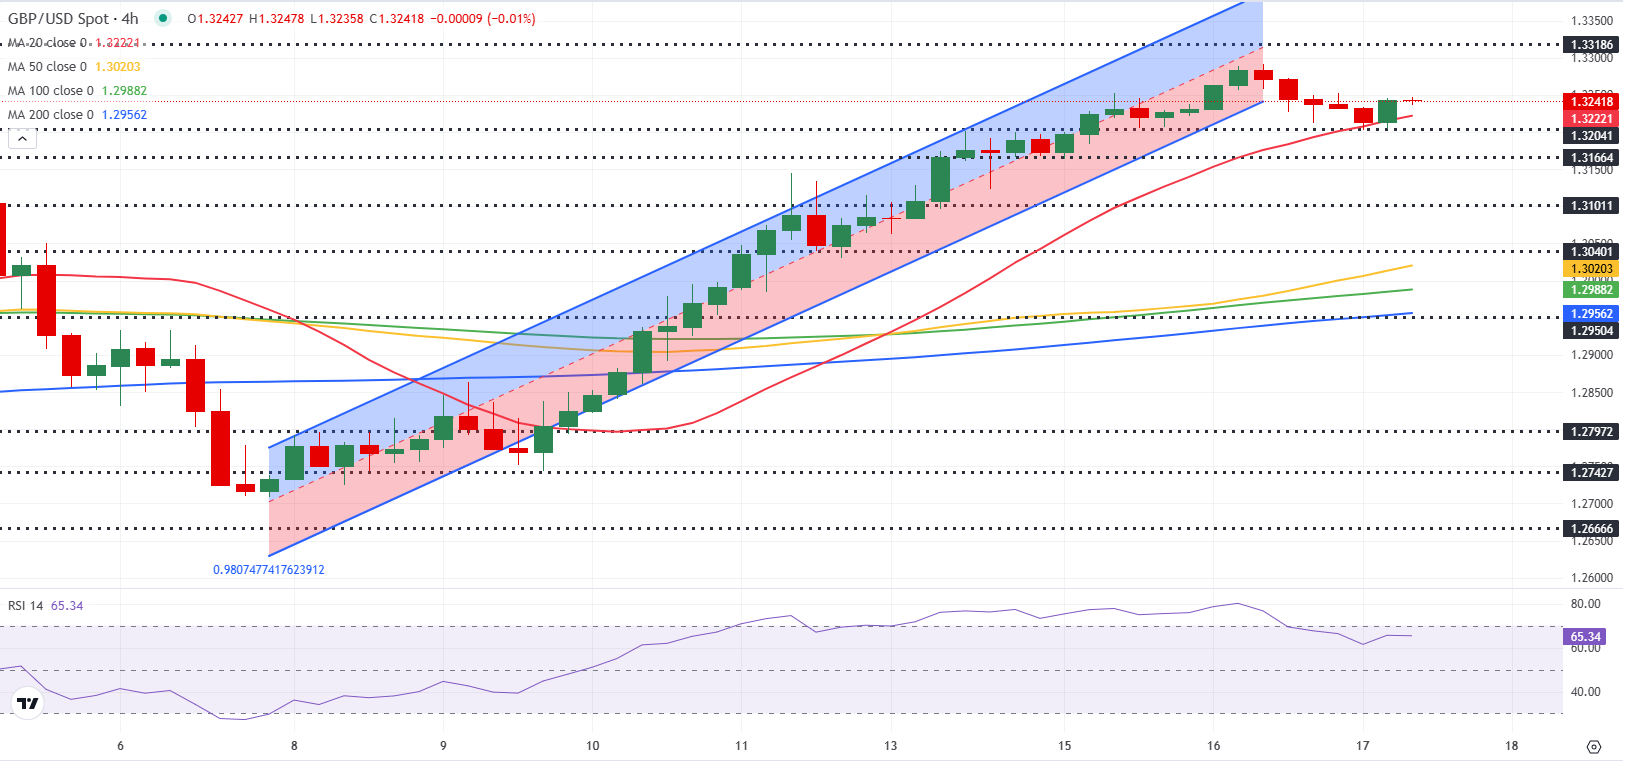
GBP/USD moves sideways in a tight channel above 1.3250 in the European session on Friday after posting small gains on Thursday. The pair remains on track to end the week in positive territory.
The table below shows the percentage change of British Pound (GBP) against listed major currencies this week. British Pound was the strongest against the US Dollar.
| USD | EUR | GBP | JPY | CAD | AUD | NZD | CHF | |
|---|---|---|---|---|---|---|---|---|
| USD | -0.03% | -1.35% | -1.10% | -0.14% | -1.31% | -2.55% | -0.06% | |
| EUR | 0.03% | -0.83% | -0.62% | 0.36% | -0.81% | -2.08% | 0.42% | |
| GBP | 1.35% | 0.83% | 0.62% | 1.18% | 0.02% | -1.26% | 1.26% | |
| JPY | 1.10% | 0.62% | -0.62% | 0.95% | -0.44% | -0.94% | 1.18% | |
| CAD | 0.14% | -0.36% | -1.18% | -0.95% | -1.29% | -2.41% | 0.00% | |
| AUD | 1.31% | 0.81% | -0.02% | 0.44% | 1.29% | -1.27% | 1.24% | |
| NZD | 2.55% | 2.08% | 1.26% | 0.94% | 2.41% | 1.27% | 2.58% | |
| CHF | 0.06% | -0.42% | -1.26% | -1.18% | -0.00% | -1.24% | -2.58% |
The heat map shows percentage changes of major currencies against each other. The base currency is picked from the left column, while the quote currency is picked from the top row. For example, if you pick the British Pound from the left column and move along the horizontal line to the US Dollar, the percentage change displayed in the box will represent GBP (base)/USD (quote).
The US Dollar (USD) Index, which tracks the USD’s performance against a basket of six major currencies, closed marginally higher on Thursday, supported by the upbeat weekly Initial Jobless Claims data. The number of first-time applications for unemployment benefits declined to 215,000 from 224,000 in the previous week.
Despite the USD’s resilience, GBP/USD managed to stick to its modest daily gains as Pound Sterling captured capital outflows out of the Euro.
The European Central Bank (ECB) lowered key rates by 25 basis points (bps) after the April policy meeting, as anticipated. In the post-meeting press conference, ECB President Lagarde refrained from hinting at a pause in policy-easing and acknowledged escalated uncertainty surrounding the Euro area’s economic outlook. EUR/GBP cross lost about 0.5% after the ECB event, helping Pound Sterling hold its ground.
The economic calendar will not offer any high-impact data releases on Friday. With major financial markets remaining closed in observance of the Easter Holiday, the pair is likely to have a difficult time making a decisive move in either direction heading into the weekend.
GBP/USD holds above the 20-period Simple Moving Average (SMA) on the 4-hour chart and the Relative Strength Index (RSI) indicator stays above 60, suggesting that the bullish bias remains intact.
On the upside, 1.3280 (static level) aligns as first resistance before 1.3360 (static level) and 1.3400 (static level, round level). Looking south, supports could be seen at 1.3250 (20-period SMA) ahead of 1.3200 (static level) and 1.3160 (static level).
The Pound Sterling (GBP) is the oldest currency in the world (886 AD) and the official currency of the United Kingdom. It is the fourth most traded unit for foreign exchange (FX) in the world, accounting for 12% of all transactions, averaging $630 billion a day, according to 2022 data.
Its key trading pairs are GBP/USD, also known as ‘Cable’, which accounts for 11% of FX, GBP/JPY, or the ‘Dragon’ as it is known by traders (3%), and EUR/GBP (2%). The Pound Sterling is issued by the Bank of England (BoE).
The single most important factor influencing the value of the Pound Sterling is monetary policy decided by the Bank of England. The BoE bases its decisions on whether it has achieved its primary goal of “price stability” – a steady inflation rate of around 2%. Its primary tool for achieving this is the adjustment of interest rates.
When inflation is too high, the BoE will try to rein it in by raising interest rates, making it more expensive for people and businesses to access credit. This is generally positive for GBP, as higher interest rates make the UK a more attractive place for global investors to park their money.
When inflation falls too low it is a sign economic growth is slowing. In this scenario, the BoE will consider lowering interest rates to cheapen credit so businesses will borrow more to invest in growth-generating projects.
Data releases gauge the health of the economy and can impact the value of the Pound Sterling. Indicators such as GDP, Manufacturing and Services PMIs, and employment can all influence the direction of the GBP.
A strong economy is good for Sterling. Not only does it attract more foreign investment but it may encourage the BoE to put up interest rates, which will directly strengthen GBP. Otherwise, if economic data is weak, the Pound Sterling is likely to fall.
Another significant data release for the Pound Sterling is the Trade Balance. This indicator measures the difference between what a country earns from its exports and what it spends on imports over a given period.
If a country produces highly sought-after exports, its currency will benefit purely from the extra demand created from foreign buyers seeking to purchase these goods. Therefore, a positive net Trade Balance strengthens a currency and vice versa for a negative balance.


")


 & Silver Price Forecast: Bullish Bias Intact Despite Powell’s Hawkish Tone")
