The main category of Forex News.
You can use the search box below to find what you need.
[wd_asp id=1]
The main category of Forex News.
You can use the search box below to find what you need.
[wd_asp id=1]
The EUR/USD forecast shows a sudden decline in the euro after a trade deal between the US and the European Union. The initial relief has faded, and traders believe the trade deal was not the best possible outcome. Meanwhile, market participants are gearing up for the FOMC meeting and US employment figures this week.
-Are you looking for the best CFD broker? Check our detailed guide-
The US has signed a trade deal with the EU, finally easing concerns about a 30% tariff set to take effect next month. Moreover, the deal came at the right time since the August 1 deadline is approaching. However, it still left the EU with a 15% tariff. Initially, top officials were going for a zero-tariff agreement. Therefore, the outcome was still not the best. As a result, the euro collapsed on Monday.
“The deal’s investment provision will draw capital flows out of Europe, strengthening the dollar overall against the euro,” said Shoki Omori, chief desk strategist at Mizuho Securities.
“Taken together, weaker relative growth prospects and a deteriorating balance of payments argue for a gradual depreciation of EUR/USD once the initial relief fades, notwithstanding the overnight uptick,” he said.
Meanwhile, traders are preparing for a packed week with the FOMC policy meeting and the US nonfarm payrolls report.
Market participants do not expect any key releases from the US or the Eurozone. Therefore, focus will remain on the recent trade deal.
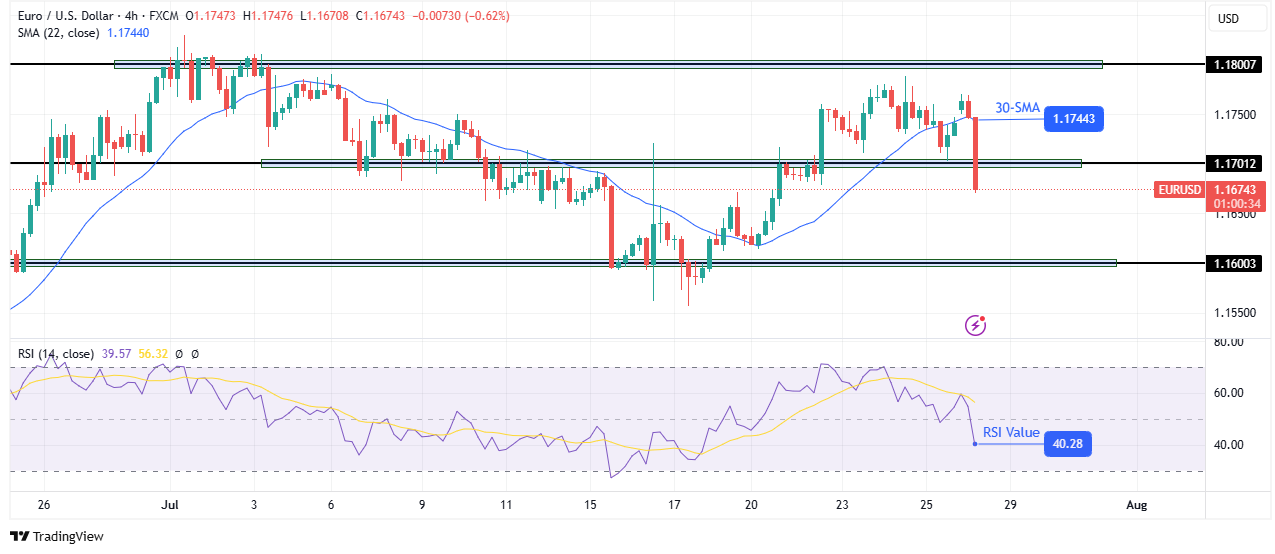
On the technical side, the EUR/USD price has collapsed and broken below the 30-SMA and the 1.1701 key support level. At the same time, the RSI has broken below 50, showing a shift in sentiment to bearish.
-If you are interested in guaranteed stop-loss forex brokers, check our detailed guide-
Initially, the price was trading above the SMA and making higher highs and lows. At the same time, bulls were eyeing the 1.1800 key resistance. However, they were unable to get to the level as bears suddenly gained enough momentum to push below the 30-SMA.
With bears in the lead, the price might soon start making lower highs and lows. It might pull back to retest the 1.1701 level before dropping to retest the 1.1600 support. However, this will only happen if the price closes below 1.1701. Otherwise, bulls might return to challenge the 1.1800 key resistance.
Looking to trade forex now? Invest at eToro!
68% of retail investor accounts lose money when trading CFDs with this provider. You should consider whether you can afford to take the high risk of losing your money.
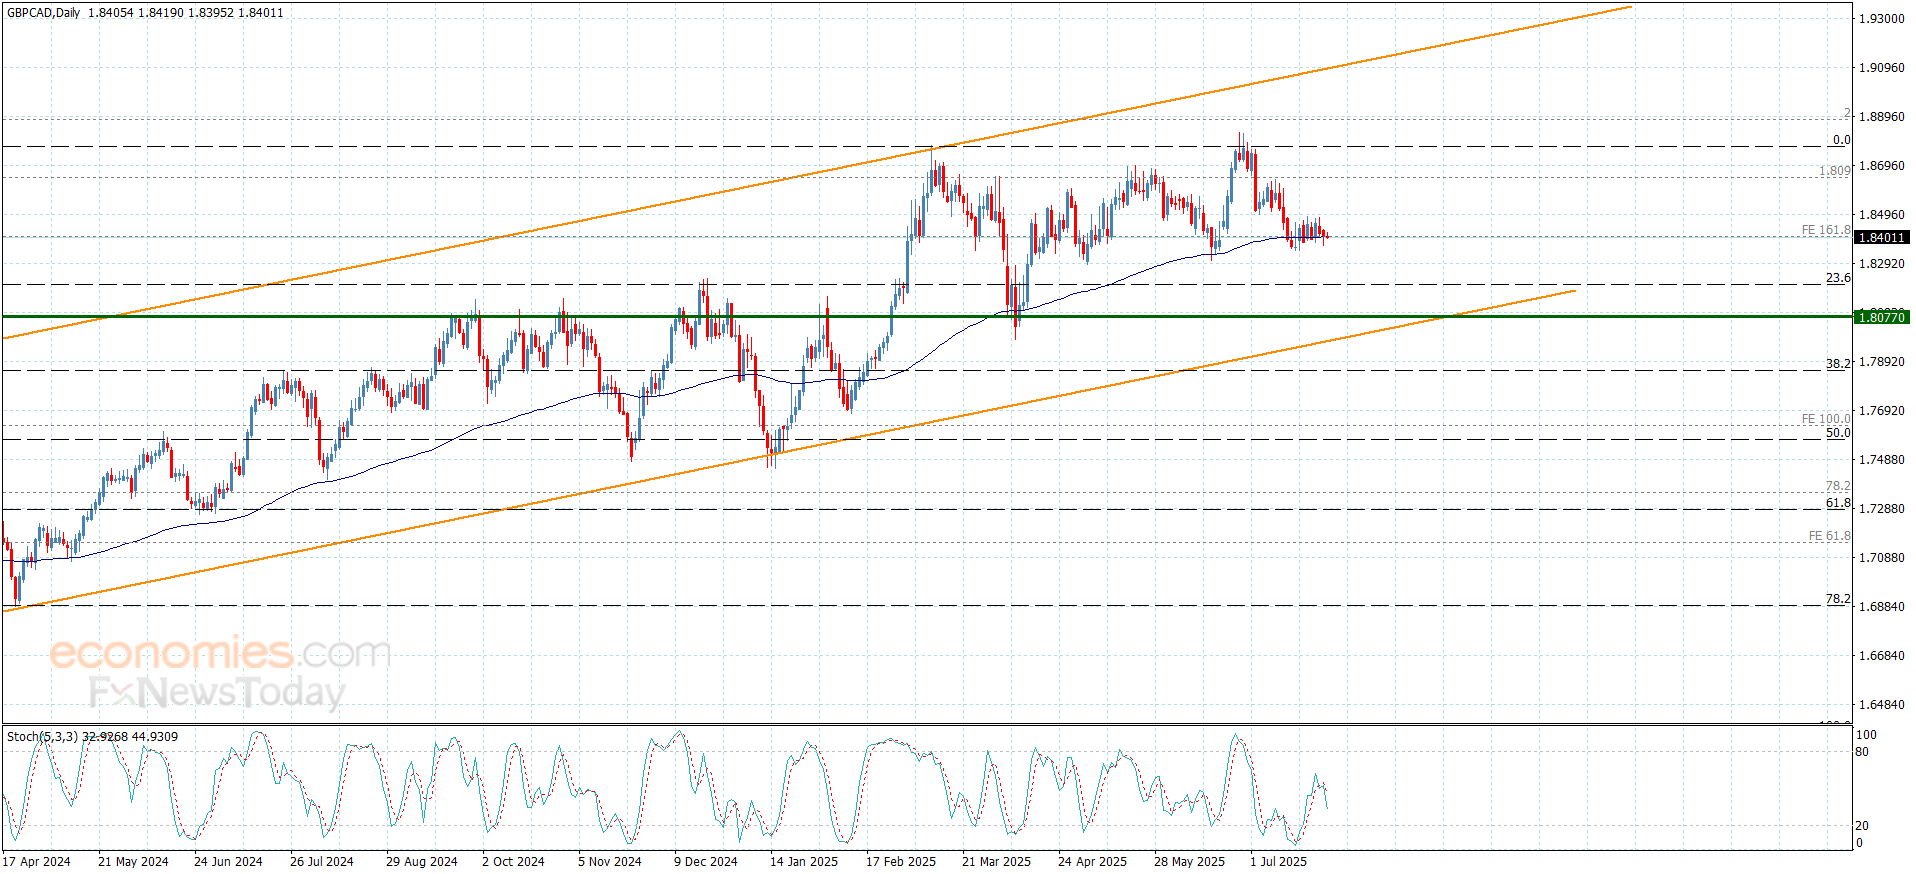
The GBPCAD ended the last bearish correctional by its stability near 1.8390, facing the moving average 55, reinforcing the stability of the extra support near 1.8355, increasing the chances for renewing the positive action in the near and medium period trading.
Therefore, we will begin by preferring the bullish trading that might target 1.8470 level, reaching the next target at 1.8580, while the price declined below the support mentioned and holding below it, will confirm its surrender to the bearish correctional scenario, which forces it to suffer more of the losses by reaching 1.8310 and 1.8270.
The expected trading range for today is between 1.8360 and 1.8470
Trend forecast: Bullish
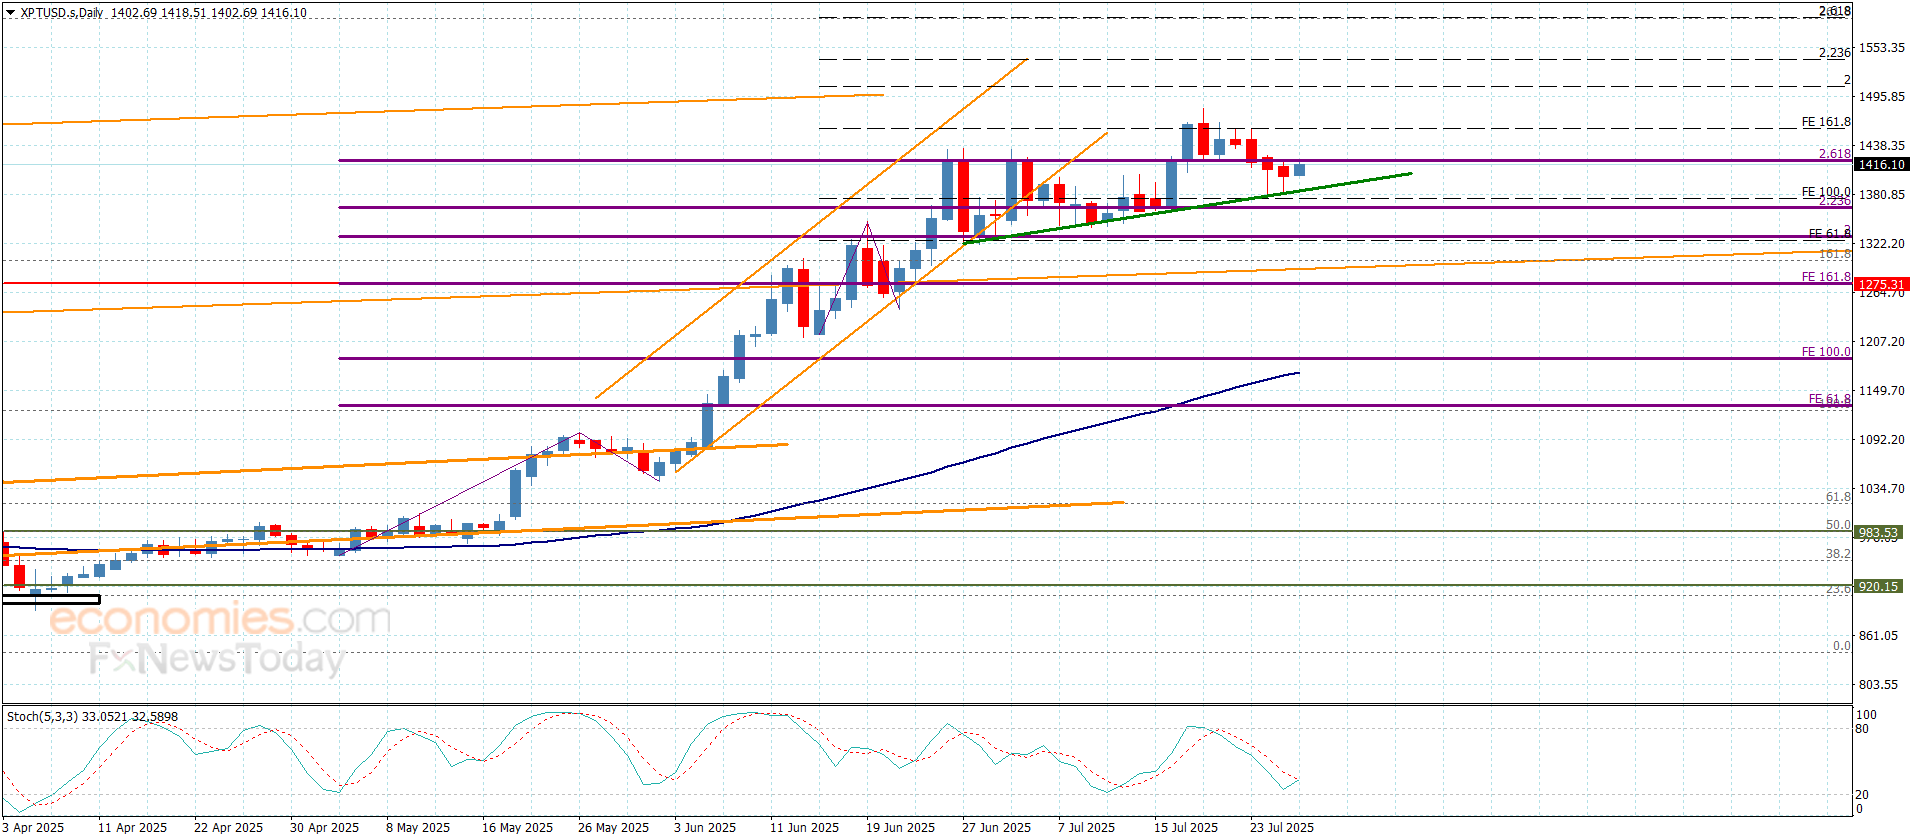
Platinum price ended the correctional trading by testing the extra support at $1381.00, forming a confirmation key for the continuation of the positive continuation, attacking the barrier at $1420.000 level, to find an exit for resuming the bullish attempts.
Stochastic begins to provide positive momentum by its repeated stability above 20 level, which makes us wait for breaching the current barrier and holding above it, to ease the mission of targeting $1458.00 level, and surpassing it will provide a chance for achieving new gains that might extend to $1480.00 and $1507.00.
The expected trading range for today is between $1390.00 and $1458.00
Trend forecast: Bullish
Platinum price ended the correctional trading by testing the extra support at $1381.00, forming a confirmation key for the continuation of the positive continuation, attacking the barrier at $1420.000 level, to find an exit for resuming the bullish attempts.
Stochastic begins to provide positive momentum by its repeated stability above 20 level, which makes us wait for breaching the current barrier and holding above it, to ease the mission of targeting $1458.00 level, and surpassing it will provide a chance for achieving new gains that might extend to $1480.00 and $1507.00.
The expected trading range for today is between $1390.00 and $1458.00
Trend forecast: Bullish
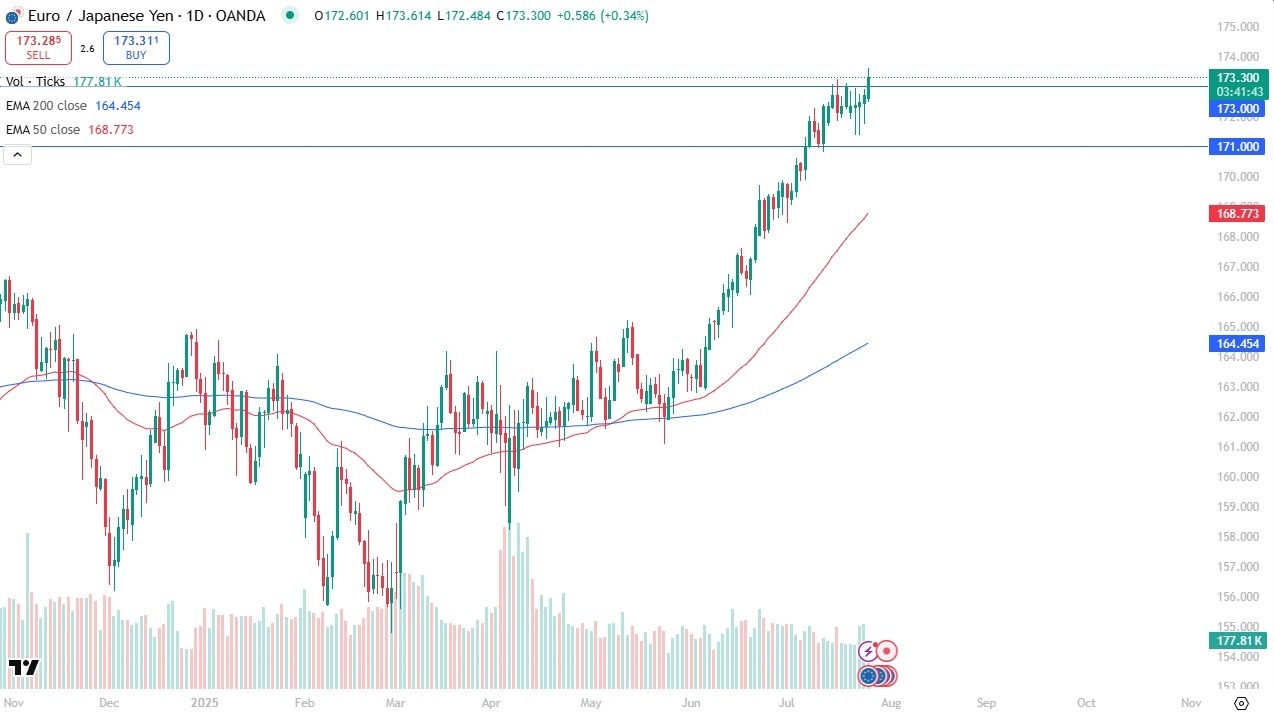
There have been a couple of days here where there just hasn’t been much in the way of bids. And if that is going to continue to be the way forward, you have major problems.

Ultimately, I think this is a situation where you’re looking at a central bank in Japan that may have to get involved in quantitative easing again, and that could send this pair much higher. You can see over the last couple of years; it’s just been a steady grind higher. We did have a pullback and a little bit of sideways action, and now we’re approaching the 175 yen level, which is a huge barrier going back to the middle of July of last year.
The market is bullish. We just flagged a little bit of a bullish flag and there’s just nothing on this chart to think about shorting. If we broke down below the 171 yen level, then maybe we could go look into the 50 day EMA, which is closer to the 169 yen level, but I just don’t see that happening. I certainly wouldn’t be a seller of that.
I’d be looking for a buy on the dips that show us some type of opportunity to start piling into the euro and away from the Japanese yen again, even the US dollar, which has struggled quite significantly against the Japanese yen has shown itself to be somewhat resilient against the Japanese yen. That just shows you how weak the currency is.
Begin trading our daily forecasts and analysis. Here is a list of Forex brokers in Japan to work with.
Christopher Lewis has been trading Forex and has over 20 years experience in financial markets. Chris has been a regular contributor to Daily Forex since the early days of the site. He writes about Forex for several online publications, including FX Empire, Investing.com, and his own site, aptly named The Trader Guy. Chris favours technical analysis methods to identify his trades and likes to trade equity indices and commodities as well as Forex. He favours a longer-term trading style, and his trades often last for days or weeks.
The Gold Price (XAU/USD) extends the decline to around $3,335 during the early Asian session on Monday. The precious metal trades in the negative territory for the fourth consecutive day as progress on the US–EU trade deal hits safe-haven demand. Traders brace for the US Federal Open Market Committee (FOMC) policy meeting later on Wednesday.
Market sentiment improves after the EU and the US have reached a framework trade agreement that sets a blanket 15% tariff on goods traded between them, ending a months-long stand-off. The 15% tariff rates will take effect on August 1. Additionally, the US and China, the world’s two largest economies, are expected to extend their tariff truce by another three months, the South China Morning Post reported, citing unnamed sources. The risk-on sentiment weighs on the yellow metal, a traditional safe-haven asset.
The US Federal Reserve (Fed) has held its benchmark interest rate between 4.25% and 4.5% this year. Analysts expect the central bank won’t lower interest rates at its July meeting on Wednesday despite US President Donald Trump’s persistent pressure. According to the CME FedWatch tool, markets have priced in nearly a 62% chance of a rate cut on September 1.
Gold traders will closely monitor the FOMC press conference for some hints about the timeline of rate reduction this year. Most Fed officials appear to be content to continue waiting to see how tariffs will move through the economy before they make any cuts. US tariffs. However, any surprise dovish remarks from Fed policymakers could boost the non-yielding Gold price as it becomes more attractive when interest rates fall or stay low.
Gold has played a key role in human’s history as it has been widely used as a store of value and medium of exchange. Currently, apart from its shine and usage for jewelry, the precious metal is widely seen as a safe-haven asset, meaning that it is considered a good investment during turbulent times. Gold is also widely seen as a hedge against inflation and against depreciating currencies as it doesn’t rely on any specific issuer or government.
Central banks are the biggest Gold holders. In their aim to support their currencies in turbulent times, central banks tend to diversify their reserves and buy Gold to improve the perceived strength of the economy and the currency. High Gold reserves can be a source of trust for a country’s solvency. Central banks added 1,136 tonnes of Gold worth around $70 billion to their reserves in 2022, according to data from the World Gold Council. This is the highest yearly purchase since records began. Central banks from emerging economies such as China, India and Turkey are quickly increasing their Gold reserves.
Gold has an inverse correlation with the US Dollar and US Treasuries, which are both major reserve and safe-haven assets. When the Dollar depreciates, Gold tends to rise, enabling investors and central banks to diversify their assets in turbulent times. Gold is also inversely correlated with risk assets. A rally in the stock market tends to weaken Gold price, while sell-offs in riskier markets tend to favor the precious metal.
The price can move due to a wide range of factors. Geopolitical instability or fears of a deep recession can quickly make Gold price escalate due to its safe-haven status. As a yield-less asset, Gold tends to rise with lower interest rates, while higher cost of money usually weighs down on the yellow metal. Still, most moves depend on how the US Dollar (USD) behaves as the asset is priced in dollars (XAU/USD). A strong Dollar tends to keep the price of Gold controlled, whereas a weaker Dollar is likely to push Gold prices up.
July 27, 2025 – Written by David Woodsmith
STORY LINK Pound-to-Dollar Forecast: “GBP Strength was Short-lived”
The Pound to Dollar exchange rate (GBP/USD) dipped towards 1.3500 on Thursday and retreated below this level in early Europe on Friday with further selling.
The dollar has secured net gains in global markets while the UK data has not provided Pound support.
Overall risk appetite has also stumbled on Friday which has also unsettled the Pound and GBP/USD has posted sharp losses to lows at 1.3425.
According to UoB; “upward momentum has largely faded. To look at it another way, the GBP strength was short-lived.”
It considers that the break below 1.3450 would increase the risk of further selling.
Key support for the Pound is close to 1.3370 and any break below this level would cause further important damage to the outlook.

Bank of America commented; “To say that GBP has had an inauspicious start to H2 is an understatement.”
UK retail sales volumes increased 0.9% for June after a revised 2.8% slide for May, but slightly below consensus forecasts of a 1.2% gain for the month.
There was a rebound in food sales after a sharp decline previously.
According to the ONS; “The warm weather in June helped to brighten sales, with supermarket retailers reporting stronger trading and an increase in drink purchases. It was also a good month for fuel sales as consumers ventured out and about in the sunshine.”
RSM head of retail Jacqui Baker noted that there was still an important element of caution; “While the June figures are welcome news and consumer confidence ticked up last month, nervousness among consumers persists, and the unexpected rise in inflation won’t have helped. The higher price of essentials such as food and fuel will only add to the reluctance among consumers to spend as their discretionary income shrinks.”
The latest GfK consumer confidence index reported a slight decline to -19 for July from -18 the previous month.
There was significant evidence of caution with consumers ramping up savings to the highest level since 2007.

Neil Bellamy, consumer insights director at GfK, commented; “With speculation growing over possible tax rises in the Autumn budget, and price pressure contributing not just to higher inflation already but also to the likelihood of worse inflation to come, the news is worrying.”
According to MUFG; “The PMI data was for July and underlines the likelihood that the UK economy has got off to a weak start in Q3.”
It added; “This grim news was clearly more impactful than the positive news of a trade deal being confirmed between the UK and India.”
ING noted that survey evidence has indicated economic vulnerability and a weaker labour market at the same time as on-going upward pressure on prices.
It commented that; “The latest UK Purchasing Managers’ Index (PMI) perfectly encapsulate the headache the Bank of England faces right now.”
The bank added; “Which of these trends – higher inflation or lower hiring – matters more? This is not a new debate and one that’s far from resolved, setting up another divisive August Bank of England meeting. We wouldn’t be at all surprised to see another three-way vote split, akin to what we saw in May.”
According to the IMF; “In an environment of weak growth, persistent inflationary pressures may create “stagflation” risks, complicating the monetary policy stance and putting pressure on public finances.
International Money Transfer? Ask our resident FX expert a money transfer question or try John’s new, free, no-obligation personal service! ,where he helps every step of the way,
ensuring you get the best exchange rates on your currency requirements.
Oil markets remain in flux as geopolitical tensions, supply adjustments, and economic indicators create a complex trading environment. Current prices reflect this volatility, with rapid shifts occurring throughout each trading day.
WTI crude is trading at $67.17 per barrel, up 0.25% in the last 12 minutes, while Brent crude stands at $68.80, down 0.45% in the past hour. These fluctuations reflect the volatile nature of today’s oil markets, where prices respond rapidly to global events and market sentiment.
The spread between these benchmarks has narrowed slightly, indicating changing dynamics in regional supply-demand balances. Murban crude, an increasingly important benchmark for Asian markets, is currently priced at $70.10 per barrel, suggesting stronger fundamentals in Middle Eastern grades.
Recent OPEC+ announcements have significantly impacted market dynamics. The cartel is preparing to boost supply, which has put downward pressure on prices. This comes after a period of production cuts that had previously supported higher price levels.
“The market is recalibrating expectations as OPEC+ transitions from a production cut strategy to a more nuanced approach that balances market share concerns with price stability,” notes industry analyst Maria Henderson.
Saudi Arabia’s Aramco is reportedly planning to raise oil prices to Asian markets amid strong regional demand, demonstrating the complex balancing act between production levels and regional pricing strategies. This price adjustment comes even as overall OPEC+ production is set to increase, highlighting the kingdom’s strategic approach to different market segments.
Current sanctions targeting Iran’s oil smuggling network continue to create uncertainty in global oil markets. The U.S. has recently imposed new restrictions on Iranian oil trade, while simultaneously lifting restrictions on ethane exports to China, highlighting the complex interplay between geopolitics and energy trade policies.
Despite these sanctions, Iran’s crude exports have remained resilient, with China continuing to purchase significant volumes of Iranian oil. This “shadow fleet” of tankers operates outside traditional shipping insurance and tracking systems, making exact export volumes difficult to verify.
Middle East tensions remain a constant background factor in oil pricing, though their immediate impact has somewhat receded in recent weeks. The risk premium associated with potential supply disruptions in the region has diminished as other bearish factors have taken precedence.
The interplay between macroeconomic indicators and energy markets continues to shape crude oil pricing on a daily basis. From China’s purchasing patterns to U.S. production records, economic factors remain central to understanding current price movements.
China’s relationship with global oil markets remains crucial to oil price movements. Recent data shows China has avoided U.S. crude imports for a third consecutive month while continuing to purchase significant volumes of Iranian oil. This shift in purchasing patterns reflects broader trade tensions and strategic realignments in global energy markets.
Chinese refinery utilization rates have declined slightly in recent weeks, indicating potential softness in domestic demand. As the world’s largest crude oil importer, even minor changes in China’s consumption patterns can significantly impact global prices.
The restart of ethane trade between the U.S. and China, despite ongoing crude import avoidance, demonstrates the selective nature of China’s energy trade strategy. This targeted approach allows China to maintain leverage in trade negotiations while securing necessary energy inputs.
US oil production decline reached record levels in April 2024, even as refining margins tightened. Production hit 13.2 million barrels per day, continuing the upward trend despite ongoing capital discipline from major producers.
A surprise crude oil inventory build recently ended a five-week streak of inventory draws, contributing to downward pressure on prices. U.S. commercial crude stocks increased by 3.6 million barrels, against analyst expectations of a 2.3 million barrel decline.
The Dallas Federal Reserve reports that oilfield inflation is surging while shale activity contracts in Q2, adding complexity to the U.S. production outlook. Service costs have increased 8.5% year-over-year, even as drilling activity has declined by 4.2% in the same period.
India has raised concerns about potential U.S. plans to impose a 500% tariff on Russian oil importers, highlighting how trade policies can reshape global oil flows. This potential policy has already influenced purchasing patterns, with India doubling its U.S. oil imports recently.
“Trade policy is increasingly becoming a dominant factor in global oil flows, sometimes outweighing traditional price considerations,” explains trade analyst Robert Chen.
These shifts demonstrate the growing importance of diplomatic and trade considerations in global energy markets. Countries are increasingly making energy purchase decisions based on strategic relationships rather than purely economic factors, creating new patterns of global oil trade.
Regional developments continue to shape global oil markets, with significant investments, production changes, and strategic partnerships emerging across key energy-producing regions.
ADNOC has restored most of its Murban crude supply after earlier cuts, stabilizing an important benchmark for Asian markets. This restoration comes after technical issues had temporarily reduced output, creating pricing anomalies in certain crude grades.
Saudi Arabia and Indonesia have signed $27 billion worth of oil and energy deals, expanding their energy partnership. These agreements include refinery investments, exploration partnerships, and petrochemical projects, demonstrating Saudi Arabia’s continued focus on downstream integration.
The Middle East’s role as the global oil market’s center of gravity remains unchanged, though the region’s producers are increasingly focused on diversification and value-added energy products rather than simply maximizing crude exports.
Equinor has invested $1.3 billion to expand Europe’s biggest oilfield, signaling continued commitment to North Sea production. This investment comes despite Europe’s ambitious climate goals, highlighting the continuing importance of domestic production even amid energy transition efforts.
Russia’s natural gas supply to Europe has declined substantially, while Northeast Asia’s jet fuel flows to Europe have surged, demonstrating how regional energy trade patterns continue to evolve in response to geopolitical and market pressures.
European refiners are adjusting to changing crude slates as Russian oil remains under sanction, forcing technical adjustments and new trading relationships. The region’s storage levels remain above seasonal norms, providing some buffer against potential supply disruptions.
Libya has fixed a leak on a crude oil pipeline linked to its top refinery and launched its first exploration tender in 18 years, attracting bids from major oil companies. These developments signal potential production growth in a country that has seen significant disruptions in recent years.
Kazakhstan’s oil production has reached an all-time high, creating tensions within OPEC. The country’s output hit 2.02 million barrels per day in May, exceeding its OPEC+ quota and highlighting the challenges of maintaining production discipline across the producer group.
Indonesia is seeking drilling partners to revive oil output from old wells, highlighting how emerging producers are working to maximize their energy resources. The country aims to boost production by 20% over the next five years through enhanced oil recovery techniques and new exploration.
The ripple effects of crude oil price movements extend throughout the global economy, affecting everything from transportation costs to manufacturing expenses and household budgets.
U.S. gasoline prices have fallen to $3.14 per gallon ahead of the July 4th holiday as Middle East risks recede. This represents a decline of nearly 8% from the peak reached earlier this year, providing relief to American consumers during a major driving season.
Current gasoline futures are trading at $2.120 per gallon, up 0.06% in the last 25 minutes. These consumer-facing prices directly reflect upstream crude oil market movements, though with some lag and regional variations.
The relationship between crude oil prices today and retail gasoline prices has remained relatively consistent, with approximately 60% of the retail gasoline price determined by the underlying crude oil cost. The remainder consists of refining costs, distribution, marketing, and taxes.
Oil price volatility affects transportation costs, manufacturing expenses, and ultimately consumer prices across the economy. The relationship between crude oil prices and inflation remains significant, though somewhat moderated compared to historical patterns due to increased energy efficiency and diversification.
For every $10 per barrel change in oil prices, U.S. GDP growth is impacted by approximately 0.2 percentage points, according to recent economic studies. This relationship highlights the continuing importance of energy costs to overall economic performance.
Sectors particularly sensitive to oil price stagnation include airlines, shipping, chemicals, and plastics manufacturing. These industries often employ sophisticated hedging strategies to mitigate the impact of price volatility on their operations.
Price movements in traditional fossil fuels influence investment decisions in renewable energy. When oil prices rise, alternative energy sources become more economically competitive, potentially accelerating the energy transition. Conversely, lower oil prices can slow renewable adoption by making fossil fuels more economically attractive in the short term.
Recent studies suggest that oil prices above $70 per barrel significantly enhance the competitiveness of electric vehicles and renewable power generation. Current price levels hovering around this threshold create uncertainty for clean energy investors.
Major oil companies have adjusted their investment strategies to balance traditional production with renewable expansion. Capital expenditure in the oil sector remains well below pre-pandemic levels, with companies prioritizing shareholder returns over aggressive growth.
Technical analysis provides valuable insights into market sentiment and potential price direction, complementing fundamental supply-demand analysis.
Current technical indicators show mixed signals for crude oil. WTI has been trading in a consolidation pattern after recent declines, with key support around the $65 level and resistance near $70. Trading volumes and price movements suggest market participants are cautiously assessing the balance between supply increases and demand concerns.
The 50-day moving average has crossed below the 200-day moving average, creating what traders call a “death cross” – typically a bearish signal. However, relative strength indicators suggest the market may be approaching oversold territory, potentially limiting further downside.
The Bollinger Band width has narrowed significantly, indicating decreased volatility and often preceding a substantial price move. Technical analysts are watching for a breakout from the current range to signal the next major trend direction.
Futures positioning data indicates that speculative traders have reduced their bullish bets on crude oil in recent weeks, reflecting growing uncertainty about the market’s direction. Managed money long positions have declined by 15% over the past month, while short positions have increased by 8%.
The put-call ratio for oil options suggests increased hedging activity, as market participants seek protection against potential price declines. This ratio has risen to 1.3, compared to a three-month average of 0.9, indicating growing concern about downside risks.
Open interest in crude oil futures has declined slightly, suggesting some participants are moving to the sidelines amid uncertainty about future price direction. This reduced participation can sometimes precede larger market moves as liquidity decreases.
Current price levels represent a significant decline from the peaks seen in recent years. Seasonal patterns typically show stronger demand during summer driving seasons in the Northern Hemisphere, but this effect may be moderated by macroeconomic concerns and supply increases from major producers.
Historically, July has been a relatively strong month for crude oil prices, with positive returns in 65% of the past 20 years. However, August and September have often seen weakness as summer demand begins to wane and refiners enter maintenance season.
The five-year average price for WTI crude in July stands at approximately $72 per barrel, suggesting current prices are trading at a discount to recent historical patterns. This discount reflects the current balance of bearish and bullish factors in the market.
Forecasting oil prices involves analyzing multiple factors across different time horizons, from immediate market dynamics to long-term structural changes in energy systems.
Analysts remain divided on the short-term outlook, with some pointing to OPEC+ supply increases as a bearish factor, while others emphasize potential demand growth from seasonal factors and economic recovery in key markets. The immediate price direction will likely depend on upcoming inventory reports and any unexpected geopolitical developments.
Goldman Sachs recently adjusted its three-month price forecast for Brent crude to $75 per barrel, down from an earlier projection of $85. This revision reflects concerns about additional supply from OPEC+ and resilient U.S. production.
Meanwhile, JPMorgan maintains a more bullish outlook, projecting Brent to reach $79 per barrel by September, citing stronger-than-expected global demand growth of 1.8 million barrels per day in 2024.
Long-term price projections must consider both traditional supply-demand fundamentals and the accelerating energy transition. Investment in new oil production has remained constrained in recent years, potentially setting the stage for tighter markets if demand proves resilient. However, the pace of electric vehicle adoption and renewable energy growth creates significant uncertainty about long-term oil demand trajectories.
The International Energy Agency forecasts global oil demand to peak before 2030, though this timeline remains contested among industry analysts. OPEC projections show continuing demand growth through 2045, highlighting the divergent views on the energy transition’s pace.
Upstream investment in new oil production remains approximately 25% below pre-pandemic levels, raising concerns about future supply adequacy if demand remains robust. This underinvestment could create price volatility in the coming years, even as the longer-term outlook becomes increasingly influenced by decarbonization efforts.
For investors in energy markets, the current environment presents both challenges and opportunities. The volatility in oil prices requires careful risk management, while the evolving energy landscape necessitates strategic positioning across both traditional and alternative energy sectors.
“We’re advising clients to maintain exposure to traditional energy while gradually increasing allocation to transition leaders,” notes investment strategist Sarah Williams. “The energy transformation will take decades, creating opportunities in both sectors.”
Integrated oil companies with strong balance sheets and diversification into low-carbon businesses may offer better risk-adjusted returns than pure-play producers. Meanwhile, energy service companies with exposure to both traditional and renewable sectors can benefit from capital spending across the energy spectrum.
Fixed income investors should monitor the credit quality of energy producers carefully, as oil price rally volatility can quickly impact debt servicing capabilities. The sector’s credit metrics have improved substantially since 2020, but leverage remains a concern for some smaller producers.
Oil prices are currently influenced more by supply increases from OPEC+ and record U.S. production than by geopolitical risks. Additionally, market participants have already priced in a certain level of Middle East risk, focusing more on immediate supply-demand fundamentals.
The market has become somewhat desensitized to regional tensions after several episodes that did not result in significant supply disruptions. Unless a direct threat to major oil infrastructure emerges, traders are giving more weight to concrete supply and demand data.
Global inventory levels remain adequate to cushion potential supply disruptions, reducing the risk premium typically associated with geopolitical events. Strategic petroleum reserves, though lower than historical levels, still provide an additional buffer against short-term supply shocks.
The U.S. Strategic Petroleum Reserve (SPR) can influence prices when the government announces significant releases or purchases. Currently, the SPR is at lower levels following major releases in recent years, potentially limiting its ability to moderate price spikes.
SPR levels have declined from approximately 700 million barrels in 2020 to around 365 million barrels today, representing the lowest level since 1983. This reduction diminishes the government’s capacity to intervene in markets during supply disruptions.
While the Biden administration has announced plans to begin replenishing the SPR, purchases have been limited to opportunistic acquisitions when prices fall below $70 per barrel. This price-contingent approach creates a potential floor for market prices, though its effectiveness depends on market conditions.
As oil is priced globally in U.S. dollars, a stronger dollar typically puts downward pressure on oil prices by making crude more expensive for buyers using other currencies. Current dollar strength has been one factor weighing on oil prices.
The Dollar Index (DXY) has appreciated approximately 3.5% year-to-date, creating headwinds for dollar-denominated commodities including crude oil. This relationship tends to be most pronounced during periods of significant currency volatility.
Central bank policies, particularly Federal Reserve interest rate decisions, influence dollar strength and consequently impact oil prices. Market expectations for future interest rate paths therefore have indirect effects on crude oil markets.
Futures prices reflect market expectations about future physical oil prices, incorporating current supply-demand dynamics, storage levels, and anticipated market developments. The relationship between futures and physical prices provides important signals about market conditions and expectations.
The current futures curve is in “backwardation,” meaning near-term contracts trade at a premium to longer-dated contracts. This structure typically indicates market participants expect current tightness to resolve over time, encouraging immediate consumption rather than storage.
The spread between front-month and second-month futures contracts (known as the prompt spread) currently stands at approximately $0.40 per barrel. This relatively narrow spread suggests limited immediate concerns about physical market tightness.
The growing market share of renewable energy
Discover why major mineral discoveries can lead to exceptional returns by exploring Discovery Alert’s dedicated discoveries page, where the proprietary Discovery IQ model provides real-time alerts on significant ASX mineral announcements, giving subscribers an immediate market advantage.
The USD/JPY weekly forecast points to cautious tones during next week’s Fed and Bank of Japan policy meetings.
The USD/JPY price ended the week red but far above its lows. The price fluctuated throughout the week as traders focused on elections, tariffs, and economic data. The ruling party in Japan lost its majority in the upper house. However, the yen gained after Prime Minister Ishiba said he would stay on.
-Are you looking for the best CFD broker? Check our detailed guide-
Meanwhile, a surprise trade deal between Japan and the US further boosted the yen. It lowered Japan’s reciprocal tariff from 25% to 15%. However, the pair reversed its decline after unemployment claims data revealed resilience in the US labor market, pushing the dollar higher.
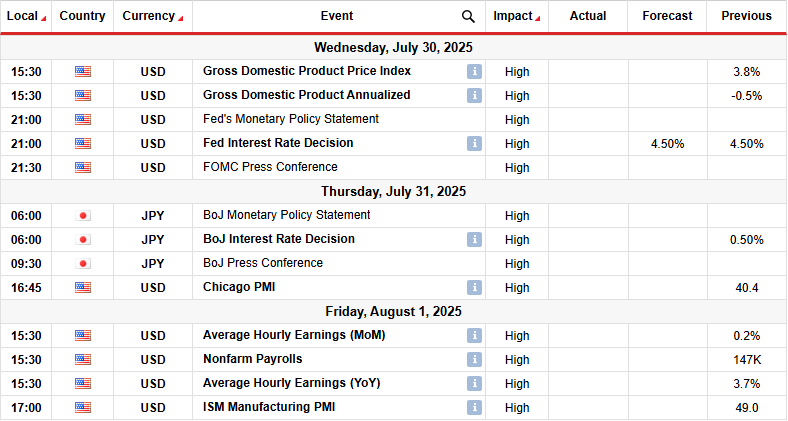
Next week, the US will release its GDP report, business activity data, and the nonfarm payrolls. At the same time, traders will focus on the FOMC policy meeting for clues on the next rate cut. Meanwhile, the Bank of Japan is also set to meet on Thursday.
Both the Fed and the BoJ are likely to keep delaying their next moves due to the impact of Trump’s tariffs. Therefore, Powell might remain cautious about rate cuts while Ueda will remain cautious about rate hikes.
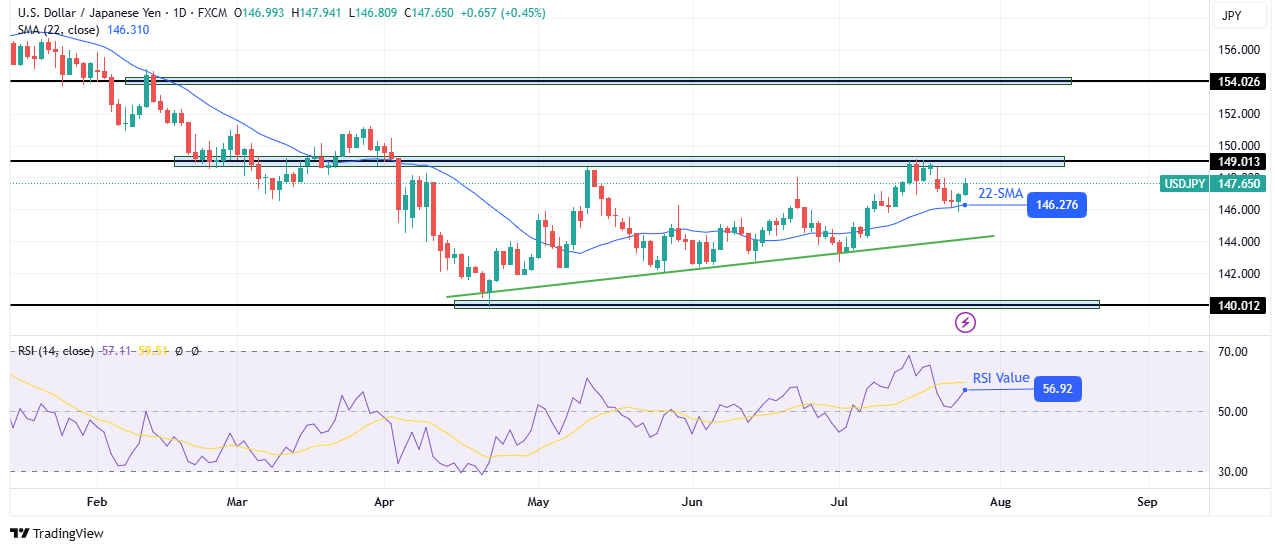
On the technical side, the USD/JPY price is bouncing towards the 149.01 resistance after retesting the 22-SMA support line. The price has been in a corrective move between a key support trendline and the 149.01 key resistance level. Within this area, the price has chopped through the SMA, a sign that bears and bulls are almost equally matched.
-If you are interested in guaranteed stop-loss forex brokers, check our detailed guide-
The corrective move came after a downtrend that paused at the 140.01 support level. Therefore, it might only be a pause as bears regain momentum. If this is the case, the price will likely soon break below the support trendline. To retest the 140.01 support. Such a move would also allow the previous downtrend to continue.
On the other hand, if bulls are ready to take charge, the price will break above the 149.01 key resistance level. This would allow USD/JPY to retest the 154.02 resistance level.
Looking to trade forex now? Invest at eToro!
68% of retail investor accounts lose money when trading CFDs with this provider. You should consider whether you can afford to take the high risk of losing your money.
A continuation of the bear trend was signaled this week on a drop below the $3.14 lower swing low (B), and a bearish reversal triggered on a decline below the $3.10 higher swing low from May 19. One or both bearish signals may confirm on a weekly basis if today’s closing price is below the first or both levels. Subsequently, there are two lower target zones as shown on the chart. The first is near a long-term AVWAP line (light blue) at around $2.96.
It began from the 2024 low and was successfully tested as support twice previously, in April and October. Both instances led to sharp recoveries. The potential to see support around that AVWAP level is enhanced by a long-term rising trendline that indicates potential support around the same price area.
The AVWAP is converging with the trendline at a time that it might be tested as support. This could increase the chance that it is reached before the current decline finds a sustainable bottom. Nonetheless, if the $2.96 price zone fails to hold as support, the next lower potential support zone looks to be around $2.86 to $2.79. The first level is the April swing low and the second is a 78.6% retracement level. A decisive decline below today’s low will trigger the bear flag, while a drop below this week’s low of $3.06 will further confirm.
Despite the signs for a bearish continuation, a potential upside reversal is signaled on a decisive rally above today’s high, and further above the two-day high of $3.17. Wednesday’s high of $3.27 would be the next potential resistance level, followed by an internal rising trendline that previously represented dynamic support.
For a look at all of today’s economic events, check out our economic calendar.