The main category of Forex News.
You can use the search box below to find what you need.
[wd_asp id=1]
The main category of Forex News.
You can use the search box below to find what you need.
[wd_asp id=1]
A continuation of the bear trend was signaled this week on a drop below the $3.14 lower swing low (B), and a bearish reversal triggered on a decline below the $3.10 higher swing low from May 19. One or both bearish signals may confirm on a weekly basis if today’s closing price is below the first or both levels. Subsequently, there are two lower target zones as shown on the chart. The first is near a long-term AVWAP line (light blue) at around $2.96.
It began from the 2024 low and was successfully tested as support twice previously, in April and October. Both instances led to sharp recoveries. The potential to see support around that AVWAP level is enhanced by a long-term rising trendline that indicates potential support around the same price area.
The AVWAP is converging with the trendline at a time that it might be tested as support. This could increase the chance that it is reached before the current decline finds a sustainable bottom. Nonetheless, if the $2.96 price zone fails to hold as support, the next lower potential support zone looks to be around $2.86 to $2.79. The first level is the April swing low and the second is a 78.6% retracement level. A decisive decline below today’s low will trigger the bear flag, while a drop below this week’s low of $3.06 will further confirm.
Despite the signs for a bearish continuation, a potential upside reversal is signaled on a decisive rally above today’s high, and further above the two-day high of $3.17. Wednesday’s high of $3.27 would be the next potential resistance level, followed by an internal rising trendline that previously represented dynamic support.
For a look at all of today’s economic events, check out our economic calendar.
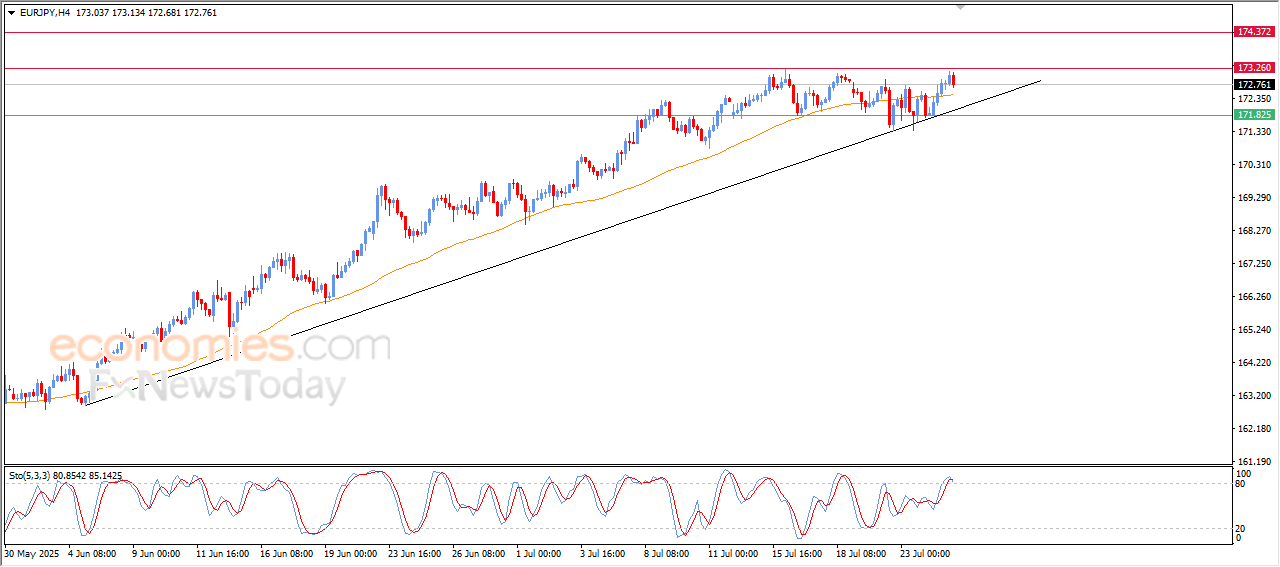
The CADCHF pair declined in its last intraday levels, to gather the gains of its previous rises, attempting to gather bullish momentum that might assist it to breach the critical resistance at 173.25, and attempting to offload some of its clear overbought conditions on the (RSI), especially with the beginning of negative overlapping signals appearance, amid the continuation of the positive support due to its trading above EMA50, and under the dominance of the main bullish trend on the short-term basis.
Therefore, our expectations suggest a rise in the (CADCHF) price in its upcoming intraday trading, conditioned by breaching the mentioned resistance at 173.25 initially, to target its next resistance at 174.35.
The expected trading range for today is between 171.85 support and 173.80 resistance.
Trend forecast: Bullish
High-accuracy trading signals delivered directly to your Telegram. Subscribe to specialized packages tailored for the world’s most important markets – all powered by BestTradingSignal.com .
The longer the subscription, the greater the savings and the more value you get.
Weekly performance report available here: Trading Signal Results – Week of July 14–18, 2025
The price of (Silver) declined in its last intraday trading, amid the dominance of the negative signals on the (RSI), after reaching overbought levels with the stability of the critical resistance level at $39.10, which forced it to attempt to gain the required positive momentum for breaching it, which led the price to break a minor bullish bias line that supports the last move of the price, which might put it under negative pressure temporarily, where it approaches from leaning on the support of EMA50, amid the dominance of the main bullish trend on the short-term basis and its trading alongside a supportive bias line for the trend.
Therefore, our expectations suggest a rise in (silver) price in their upcoming intraday trading, especially if the support settles at $38.40 level, to target the mentioned resistance level at $39.10.
Expected trading range for today: Between the support at $38.40 and resistance at $39.10
Today’s forecast: Neutral
High-accuracy trading signals delivered directly to your Telegram. Subscribe to specialized packages tailored for the world’s most important markets – all powered by BestTradingSignal.com .
The longer the subscription, the greater the savings and the more value you get.
Weekly performance report available here: Trading Signal Results – Week of July 14–18, 2025
July 25, 2025 – Written by Frank Davies
STORY LINK Pound to US Dollar Forecast: Long-term GBP/USD Uptrend Faltering Again?
The Pound to Dollar (GBP/USD) exchange rate pushed to a peak just below 1.3590 before a retreat to near 1.3550.
The latest UK data triggered some fresh unease over the outlook and hampered the Pound, but dollar confidence remained weak amid signs of higher inflation which would intensify the debate surrounding Federal Reserve policy.
Scotiabank considers that the long-term GBP/USD uptrend could be faltering again and added; “We look to a near-term range bound between 1.3500 support and 1.3580 resistance.”
According to UoB; “Although the outlook for GBP remains positive, short-term conditions are deeply overbought, and the next resistance at 1.3650 is unlikely to come into view so soon.”
On a longer-term view, Danske Bank expects that GBP/USD will creep higher to 1.38 on a 12-month view.
As far as UK data is concerned, the UK PMI manufacturing index edged higher to a 6-month high of 48.2 for July from 47.7 previously and just above consensus forecasts.
The services-sector index, however, dipped to a 2-month low of 51.2 from 52.8 in June and compared with expectations of no change for the month.

The CBI industrial trends index improved slightly to -30 for July from -33 previously, but this was below consensus forecasts of -27 and indicated further stresses in the manufacturing sector.
The ONS also reported that UK vehicle production in the first half of 2025 slumped to the lowest level since 1953.
The issue of US interest rates and Fed independence will remain a key market concern.
Markets remain very confident that there will be no change in interest rates at next week’s meeting and the potential for a September rate cut has also drifted lower to near 35%.
There are still important concerns surrounding political pressure on the Fed with the future of Chair Powell still a major talking point.
There has been further speculation that the Administration will find a pretext to dismiss Powell or undermine his authority.
Rabobank commented; “Later today, Trump will visit the Fed to take a look at the construction site where the $2.5 billion renovation project is taking place that could become the “cause” that the Trump administration is looking for to fire Powell if they want to get rid of him before his term as Fed Chair expires in May 2026. That should certainly move the process to find a new Chair into high gear.”

The latest US data will complicate the argument surrounding Federal Reserve policy and Administration demands for lower interest rates.
The PMI manufacturing index dipped to a 7-month low of 49.5 for July from 52.9 and below consensus forecasts of 52.7.
The services-sector index, however, increased to a 7-month high of 55.2 from 52.9 in June.
Overall business confidence dipped again with the second-weakest reading for 30 months.
Costs increased at the second-highest rate since January 2023 while output charges increased at the second-highest rate since September 2022.
Chris Williamson, Chief Business Economist at S&P Global Market Intelligence noted a strong start to the third quarter, but commented; “Whether this growth can be sustained is by no means assured. Growth was worryingly uneven and overly reliant on the services economy.”
On inflation, he added; “The rise in selling prices for goods and services in July suggests that consumer price inflation will rise further above the Federal Reserve’s 2% target in the coming months as these price hikes feed through to households.”
International Money Transfer? Ask our resident FX expert a money transfer question or try John’s new, free, no-obligation personal service! ,where he helps every step of the way,
ensuring you get the best exchange rates on your currency requirements.
TAGS: Pound Dollar Forecasts
The US dollar has raised higher against the Japanese yen during the trading session on Friday to touch the 148 yen level and by extension, the 200 day EMA. This is a market that I do think breaks out eventually, but as things stand right now, it is rather difficult to get above here. If we do, then the 149 yen level is your next target. Anything above there opens up the floodgates. I expect to see that sooner or later, I just don’t know if we’ll see it right at this moment.
The Australian dollar has fallen yet again against the US dollar to reach the 0.6550 region yet again. We are in a fairly obvious uptrending channel, we are right in the middle of it, so this is about as neutral as it gets. Longer term, it does look like we want to go higher, but it’s more of a grind, it’s not really a huge move that I think it is going to push this market, I think it’s going to lull people to sleep for some time. And in fact, if you draw the channel out a little bit, maybe make it a little bit longer in time, you can even make an argument that we’re just continuing the same channel we were in before that big dip in early April, with the tariffs being announced.
For a look at all of today’s economic events, check out our economic calendar.
The (ETHUSD) price declined in its last intraday trading, to attempt to offload some of its clear overbought conditions on the (RSI), especially with the beginning of the negative signals emergence, to gather its positive strength that might assist it to recover and rise again, leaning on the support of its EMA50, amid the dominance of the main bullish trend and its trading alongside a minor bullish bias that supports this trend.
Therefore, our expectations suggest a rise in the (ETHUSD) price in the upcoming intraday trading, conditioned by the stability of the support at $3,500, to target the critical resistance level at $3,800.
The expected trading range is between $3,450 support and $3,800 resistance.
Today’s forecast: Bullish
High-accuracy trading signals delivered directly to your Telegram. Subscribe to specialized packages tailored for the world’s most important markets – all powered by BestTradingSignal.com .
The longer the subscription, the greater the savings and the more value you get.
Weekly performance report available here: Trading Signal Results – Week of July 14–18, 2025
The (ETHUSD) price declined in its last intraday trading, to attempt to offload some of its clear overbought conditions on the (RSI), especially with the beginning of the negative signals emergence, to gather its positive strength that might assist it to recover and rise again, leaning on the support of its EMA50, amid the dominance of the main bullish trend and its trading alongside a minor bullish bias that supports this trend.
Therefore, our expectations suggest a rise in the (ETHUSD) price in the upcoming intraday trading, conditioned by the stability of the support at $3,500, to target the critical resistance level at $3,800.
The expected trading range is between $3,450 support and $3,800 resistance.
Today’s forecast: Bullish
High-accuracy trading signals delivered directly to your Telegram. Subscribe to specialized packages tailored for the world’s most important markets – all powered by BestTradingSignal.com .
The longer the subscription, the greater the savings and the more value you get.
Weekly performance report available here: Trading Signal Results – Week of July 14–18, 2025
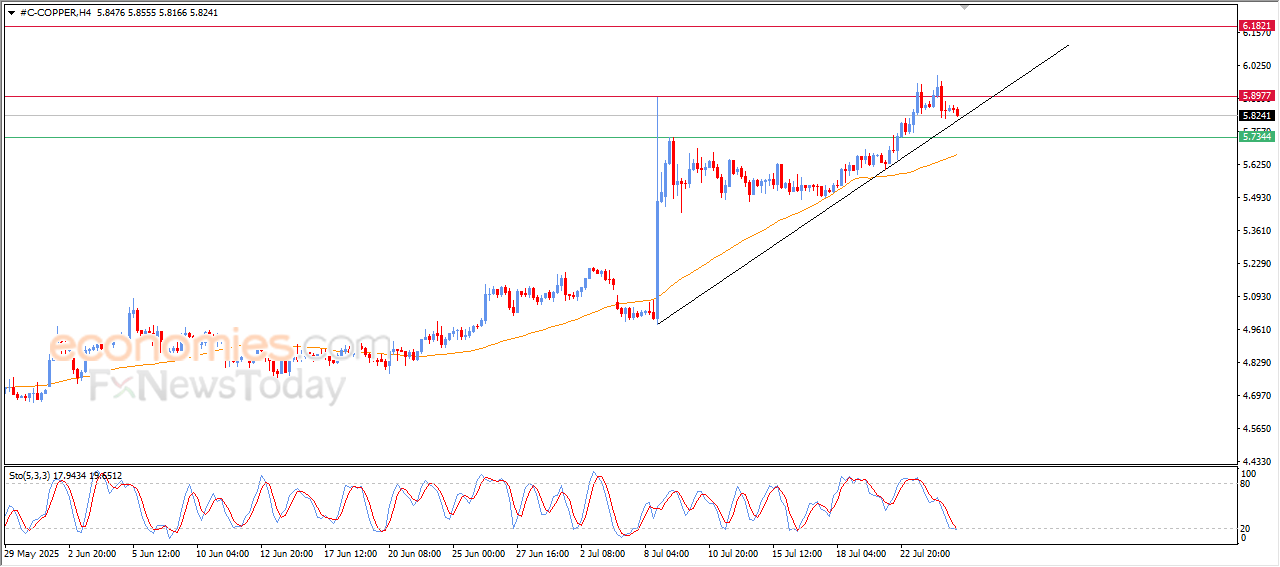
Copper price declined in its last intraday trading, due to the stability of the resistance level at $5.89, attempting to look for a rising low to take it as a base that might assist it to gain the required positive momentum to help it to breach this resistance, to lean on the support of a minor bullish trend line on the short-term basis, amid the continuation of the positive pressure that comes from its trading above EMA50, besides the (RSI) reach to oversold levels, exaggeratedly compared to the price movement, suggesting the beginning of forming positive divergence, intensifying the positive pressure on the price.
Therefore, our expectations suggest a rise in (copper) price in its intraday trading, especially when breaching the mentioned resistance at $5.89, to target the next resistance level at $6.1820.
The expected trading range for today is between $5.7344 and $6.0500
Trend forecast: Bullish
High-accuracy trading signals delivered directly to your Telegram. Subscribe to specialized packages tailored for the world’s most important markets – all powered by BestTradingSignal.com .
The longer the subscription, the greater the savings and the more value you get.
Weekly performance report available here: Trading Signal Results – Week of July 14–18, 2025
The (ETHUSD) price declined in its last intraday trading, to attempt to offload some of its clear overbought conditions on the (RSI), especially with the beginning of the negative signals emergence, to gather its positive strength that might assist it to recover and rise again, leaning on the support of its EMA50, amid the dominance of the main bullish trend and its trading alongside a minor bullish bias that supports this trend.
Therefore, our expectations suggest a rise in the (ETHUSD) price in the upcoming intraday trading, conditioned by the stability of the support at $3,500, to target the critical resistance level at $3,800.
The expected trading range is between $3,450 support and $3,800 resistance.
Today’s forecast: Bullish
High-accuracy trading signals delivered directly to your Telegram. Subscribe to specialized packages tailored for the world’s most important markets – all powered by BestTradingSignal.com .
The longer the subscription, the greater the savings and the more value you get.
Weekly performance report available here: Trading Signal Results – Week of July 14–18, 2025
GBP/USD came under bearish pressure on Thursday and lost more than 0.5%, snapping a three-day winning streak in the process. The pair extends its slide on Friday and trades below 1.3500.
The table below shows the percentage change of British Pound (GBP) against listed major currencies today. British Pound was the weakest against the Euro.
| USD | EUR | GBP | JPY | CAD | AUD | NZD | CHF | |
|---|---|---|---|---|---|---|---|---|
| USD | 0.01% | 0.36% | 0.47% | 0.30% | 0.44% | 0.31% | 0.07% | |
| EUR | -0.01% | 0.39% | 0.47% | 0.31% | 0.33% | 0.30% | 0.04% | |
| GBP | -0.36% | -0.39% | 0.10% | -0.10% | -0.06% | -0.07% | -0.33% | |
| JPY | -0.47% | -0.47% | -0.10% | -0.19% | -0.10% | -0.17% | -0.41% | |
| CAD | -0.30% | -0.31% | 0.10% | 0.19% | 0.18% | 0.01% | -0.26% | |
| AUD | -0.44% | -0.33% | 0.06% | 0.10% | -0.18% | -0.03% | -0.25% | |
| NZD | -0.31% | -0.30% | 0.07% | 0.17% | -0.01% | 0.03% | -0.24% | |
| CHF | -0.07% | -0.04% | 0.33% | 0.41% | 0.26% | 0.25% | 0.24% |
The heat map shows percentage changes of major currencies against each other. The base currency is picked from the left column, while the quote currency is picked from the top row. For example, if you pick the British Pound from the left column and move along the horizontal line to the US Dollar, the percentage change displayed in the box will represent GBP (base)/USD (quote).
The renewed US Dollar (USD) strength weighed on GBP/USD on Thursday. The US Department of Labor reported that the number of first-time applications for unemployment benefits declined to 217,000 in the week ending July 19 from 221,000 in the previous week. This reading came in better than the market expectation of 227,000. Additionally, the S&P Global Composite Purchasing Managers Index (PMI) improved to 54.6 (preliminary) in July from 52.9 in June, reflecting an ongoing expansion in the private sector’s business activity, at an accelerating pace.
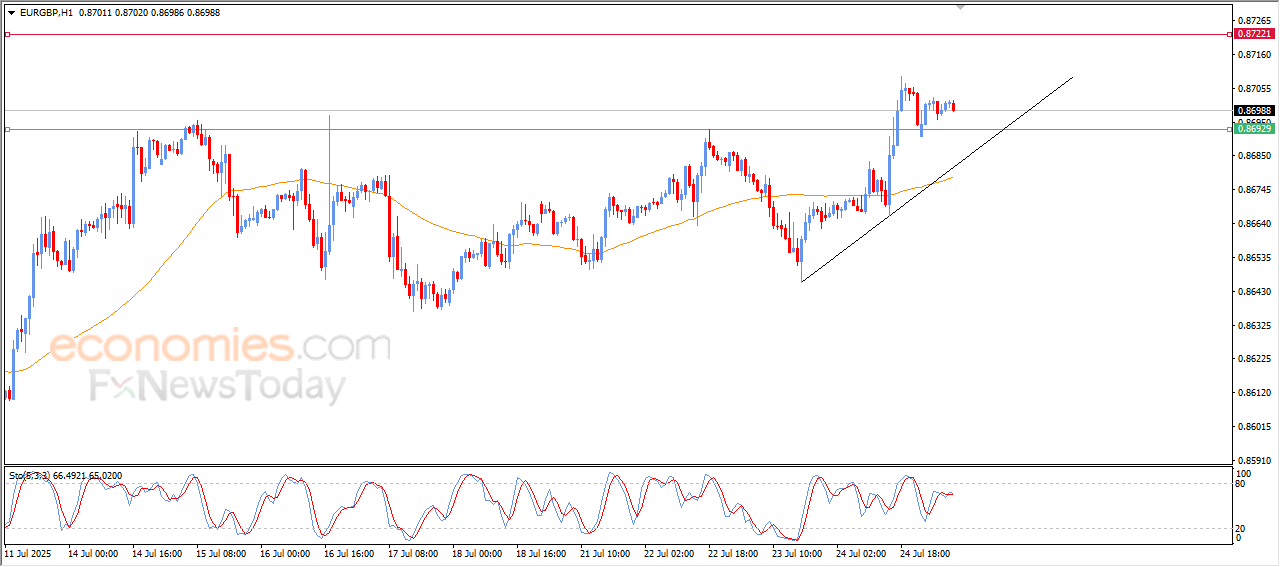
Meanwhile, the EUR/GBP cross rose more than 0.3% on Thursday as the Euro benefited from the European Central Bank’s (ECB) cautious tone on policy-easing. EUR/GBP preserves its bullish momentum and trades at its highest level since early April above 0.8700 on Friday, suggesting that the Euro continues to capture capital outflows out of Pound Sterling.
Early Friday, the UK’s Office for National Statistics reported that Retail Sales rose by 0.9% on a monthly basis in June. This reading followed the 2.8% decrease recorded in May but came in worse than the market expectation for an increase of 1.2%, making it difficult for GBP/USD to stage a rebound.
In the second half of the day, Durable Goods Orders data for June will be the only data featured in the US economic calendar. Nevertheless, this data is unlikely to have a long-lasting impact on the USD’s valuation.
GBP/USD broke below the 100-period and the 200-period Simple Moving Averages (SMAs) on the 4-hour chart and the Relative Strength Index (RSI) indicator dropped below 40, pointing to a bearish tilt in the near term.
In case GBP/USD confirms 1.3470 (Fibonacci 50% retracement of the latest uptrend) as resistance, 1.3400 (Fibonacci 61.8% retracement) could be seen as the next support level before 1.3340. On the upside, resistance levels could be spotted at 1.3520 (100-period SMA) and 1.3540-1.3550 (Fibonacci 38.2% retracement, 200-period SMA).
The Pound Sterling (GBP) is the oldest currency in the world (886 AD) and the official currency of the United Kingdom. It is the fourth most traded unit for foreign exchange (FX) in the world, accounting for 12% of all transactions, averaging $630 billion a day, according to 2022 data.
Its key trading pairs are GBP/USD, also known as ‘Cable’, which accounts for 11% of FX, GBP/JPY, or the ‘Dragon’ as it is known by traders (3%), and EUR/GBP (2%). The Pound Sterling is issued by the Bank of England (BoE).
The single most important factor influencing the value of the Pound Sterling is monetary policy decided by the Bank of England. The BoE bases its decisions on whether it has achieved its primary goal of “price stability” – a steady inflation rate of around 2%. Its primary tool for achieving this is the adjustment of interest rates.
When inflation is too high, the BoE will try to rein it in by raising interest rates, making it more expensive for people and businesses to access credit. This is generally positive for GBP, as higher interest rates make the UK a more attractive place for global investors to park their money.
When inflation falls too low it is a sign economic growth is slowing. In this scenario, the BoE will consider lowering interest rates to cheapen credit so businesses will borrow more to invest in growth-generating projects.
Data releases gauge the health of the economy and can impact the value of the Pound Sterling. Indicators such as GDP, Manufacturing and Services PMIs, and employment can all influence the direction of the GBP.
A strong economy is good for Sterling. Not only does it attract more foreign investment but it may encourage the BoE to put up interest rates, which will directly strengthen GBP. Otherwise, if economic data is weak, the Pound Sterling is likely to fall.
Another significant data release for the Pound Sterling is the Trade Balance. This indicator measures the difference between what a country earns from its exports and what it spends on imports over a given period.
If a country produces highly sought-after exports, its currency will benefit purely from the extra demand created from foreign buyers seeking to purchase these goods. Therefore, a positive net Trade Balance strengthens a currency and vice versa for a negative balance.