The main category of Forex News.
You can use the search box below to find what you need.
[wd_asp id=1]
The main category of Forex News.
You can use the search box below to find what you need.
[wd_asp id=1]
Gold price is licking its wounds below $3,400 early Friday, having bounced off the $3,350 psychological mark. Despite the recent pullback from five-week highs, Gold price remains on track to book a weekly gain.
Markets have turned a bit in Friday’s Asian trading, assessing the gravity of the ongoing military conflict between Thailand and Cambodia.
Both Asian nations have requested the United Nations Security Council to call an emergency meeting on Friday, according to China’s CCTV News.
The neighbours are locked in a bitter spat over an area known as the Emerald Triangle, where the borders of both countries and Laos meet, and which is home to several ancient temples.
Investors remain worried that the clash between these two countries does not translate into a wider regional conflict.
Risk-off flows revive the haven demand for both the US Dollar (USD) and Gold price, fuelling a bounce in the former while capping the latter’s downside.
Additionally, markets remain wary ahead of next week’s crucial US Federal Reserve (Fed) and the Bank of Japan (BoJ) monetary policy decisions.
Hence, a short-covering recovery in Gold price cannot be ruled out as the USD heads for the biggest weekly drop on easing trade tensions.
US trade deals with Japan, Indonesia and Philippines, as well as, some progress on the US and European Union (EU) trade negotiations have helped ebb fears over a potential tariff war restarting as the August 1 deadline nears.
Besides, the mid-tier US Durable Goods Orders data could keep traders entertained heading into the weekend.
Gold price extended the downside on Thursday and settled below the 23.6% Fibonacci Retracement (Fibo) level of the April record rally at $3,377, then a powerful resistance-turned-support.
However, the 14-day Relative Strength Index (RSI) remains above the midline, currently near 52, keeping buyers hopeful.
They need to recapture the abovementioned Fibo level of $3,377 to regain the upper hand.
Acceptance above the $3,440 static resistance is critical for a sustained uptrend, targeting the June 16 high of $3,453 next.
If the selling bias intensifies again, Gold price could challenge the $3,340 area, which is the confluence of the 21-day SMA and the 50-day SMA.
The next support on sellers’ radars is the 38.2% Fibo level of the same rally at $3,297.
Gold has played a key role in human’s history as it has been widely used as a store of value and medium of exchange. Currently, apart from its shine and usage for jewelry, the precious metal is widely seen as a safe-haven asset, meaning that it is considered a good investment during turbulent times. Gold is also widely seen as a hedge against inflation and against depreciating currencies as it doesn’t rely on any specific issuer or government.
Central banks are the biggest Gold holders. In their aim to support their currencies in turbulent times, central banks tend to diversify their reserves and buy Gold to improve the perceived strength of the economy and the currency. High Gold reserves can be a source of trust for a country’s solvency. Central banks added 1,136 tonnes of Gold worth around $70 billion to their reserves in 2022, according to data from the World Gold Council. This is the highest yearly purchase since records began. Central banks from emerging economies such as China, India and Turkey are quickly increasing their Gold reserves.
Gold has an inverse correlation with the US Dollar and US Treasuries, which are both major reserve and safe-haven assets. When the Dollar depreciates, Gold tends to rise, enabling investors and central banks to diversify their assets in turbulent times. Gold is also inversely correlated with risk assets. A rally in the stock market tends to weaken Gold price, while sell-offs in riskier markets tend to favor the precious metal.
The price can move due to a wide range of factors. Geopolitical instability or fears of a deep recession can quickly make Gold price escalate due to its safe-haven status. As a yield-less asset, Gold tends to rise with lower interest rates, while higher cost of money usually weighs down on the yellow metal. Still, most moves depend on how the US Dollar (USD) behaves as the asset is priced in dollars (XAU/USD). A strong Dollar tends to keep the price of Gold controlled, whereas a weaker Dollar is likely to push Gold prices up.
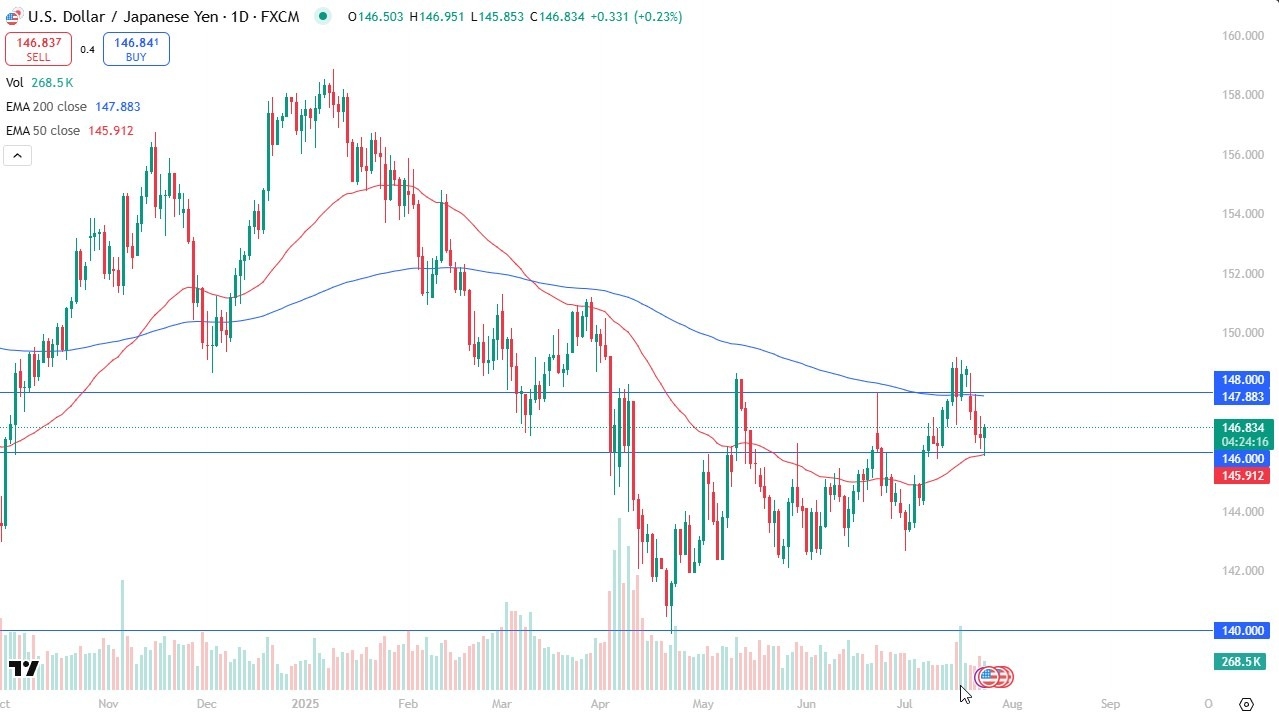
Ultimately, this is a market that given enough time, I believe probably opens up the possibility of a move towards the 200 day EMA, which sits right around the 148 yen level. This is how I have been approaching it. The market participants out there will continue to look at this through the prism of interest rate differential over the longer term, and with so much foreign capital flowing into the United States, it does make a certain amount of sense that the US dollar benefits against the Japanese yen specifically. That being said, if we break the 148 yen level, it then opens up the possibility of a move to the 149 yen level where we had peaked recently. I would anticipate a lot of issues in that area if we can get there.

A breakdown below the 50 day EMA opens up the possibility of a move down to the 144 yen level, but that’s not necessarily something that I’m looking for at the moment. I recognize this is a market that will probably continue to be very noisy and choppy, but that is typical for this pair regardless.
So with that, I like this buying of the dip as we had tried to break out, but overall, I think this is probably more of a grind to the upside and it will take significant time to reach its destination.
Want to trade our USD/JPY forex analysis and predictions? Here’s a list of forex brokers in Japan to check out.
Christopher Lewis has been trading Forex and has over 20 years experience in financial markets. Chris has been a regular contributor to Daily Forex since the early days of the site. He writes about Forex for several online publications, including FX Empire, Investing.com, and his own site, aptly named The Trader Guy. Chris favours technical analysis methods to identify his trades and likes to trade equity indices and commodities as well as Forex. He favours a longer-term trading style, and his trades often last for days or weeks.
It is interesting to note that the 20-Day and 50-Day MAs recently converged and are identifying a similar price area. This reflects the decline in volatility recently that is also expressed by the pennant symmetrical triangle. The convergence of the moving averages may occur before volatility increases in a noticeable way. Notice how in January, a bull breakout of consolidation triggered as the same two moving averages converged then as well. The 50-Day line has done a relatively good job of identifying dynamic trend support since it was reclaimed in January. It’s now $3,338.
A second bull breakout attempt of the pennant is indicated on a rally above this week’s high of $3,439, with a clearer trigger above $3,451 (B). But then gold should see a clear pickup in bullish momentum if it is to have a chance to exceed the record high of $3,500. If a move above the record high can be sustained, then gold first heads towards the initial target of a rising ABCD pattern (purple) at $3,578. A little higher is the projected 227.2% target at $3,595 for a long-term rising ABCD pattern that begins from an August 2018 swing low.
Despite gold being in a strong bull trend, there is always the potential for a breakdown of the pennant and a bearish correction rather than an upside continuation. A drop below support around the interim swing low of $3,366 will show weakness and a potential failure of the pennant. Further weakness would then be indicated on a drop below the higher swing low at $3,247 (C). There is only one more day till the week is over. Be aware that this week’s weekly bullish continuation signal will not confirm on that time frame unless this week ends above last week’s high of $3,377.
For a look at all of today’s economic events, check out our economic calendar.
Today’s bearish behavior keeps the next lower support zone in sight. It is around a long-term rising trendline, and an anchored volume weighted average price (AVWAP) level around $2.96. The trendline has not been challenged since it was established by connecting to the August 2024 swing low. This contrasts with the AVWAP line, which showed support during the market corrections in October 2024 and April.
Since the two lines are marking a similar potential support area, the price area takes on greater potential significance. However, if it fails to lead to a bottom, the next lower support zone is shown from around the April swing low of $2.86 and down to a 78.6% retracement level at $2.79. There is also the completion of a bearish measured move that matches a downswing starting from an interim swing high on March 31, on a percentage basis that matches around $2.79.
Since there is only one more trading day to the week, a weekly closing price below the prior swing low of $3.15 will confirm a bearish continuation of the decline from the June swing high (A). That will open the door to a possible drop to the trendline and AVWAP price zone. If support is seen and it is followed by a bullish reversal, a new higher swing low will be established. Given the bearish implications currently in the chart, rallies are likely to encounter resistance that turns price back down.
For a look at all of today’s economic events, check out our economic calendar.
July 24, 2025 – Written by Frank Davies
STORY LINK GBP to USD Forecast: Sterling Pressured by Weak UK PMI, Upbeat US Labour Figures
The Pound US Dollar exchange rate lost ground on Thursday following the release of the UK’s latest PMI data and the US’s initial jobless claims and PMIs.
At the time of writing, GBP/USD was trading at approximately $1.3539, down roughly 0.3% from the start of Thursday’s session.
The Pound (GBP) stumbled against its peers on Thursday as lacklustre UK PMI data for July weighed heavily on the currency.
Although the manufacturing sector showed a modest improvement, with the index rising from 47.7 to 48.2, it remained stuck in contraction territory (a reading below 50), and failed to inspire investor confidence.
However, it was the disappointing services PMI that proved most damaging to Sterling on Thursday.
As the UK’s largest economic sector, services play a vital role in shaping overall growth.
July’s flash reading unexpectedly dropped to 51.2 from 52.8, falling short of the projected uptick to 53, and sparked concerns about slowing momentum in the economy.

This underwhelming performance prompted traders to increase bets on an interest rate cut from the Bank of England (BoE), a shift in sentiment that saw GBP retreat across the board as the session progressed.
The US Dollar (USD) advanced against several major peers on Thursday, buoyed by stronger-than-expected labour market data.
Initial jobless claims dipped to 217,000 in the week ending 19 July, beating expectations for a rise to 227,000.
The decline signalled ongoing resilience in the US jobs market and lent early support to the ‘Greenback’.
Later in the day, the US published its latest S&P Global flash PMIs for July.
The services index surprised to the upside, jumping from 52.9 to 55.2 and suggested solid momentum in the service sector.
However, gains were tempered by a weaker manufacturing print, which fell into contraction territory for the first time this year, slipping to 49.5 against forecasts of 52.6.

Despite the mixed PMI release, the US Dollar maintained its positive footing throughout the remainder of the session.
Looking ahead to Friday, movement in the GBP/USD exchange rate is likely to be shaped by a pair of key economic releases from the UK and the US.
For the UK, focus will fall on June’s retail sales figures.
Economists are forecasting a rebound, with sales expected to rise by 1.2% following the sharp 2.7% contraction seen in May.
A strong print would suggest that consumer activity is picking up, which may boost confidence in the UK’s economic outlook and lend support to the Pound heading into the weekend.
Across the Atlantic, the spotlight will be on the US’s latest durable goods orders.
After a sharp jump in May, orders are forecast to slump by 10.8% in June.
If the data matches expectations, it could weigh heavily on the US Dollar by fuelling concerns about a slowdown in broader economic momentum.
International Money Transfer? Ask our resident FX expert a money transfer question or try John’s new, free, no-obligation personal service! ,where he helps every step of the way,
ensuring you get the best exchange rates on your currency requirements.
TAGS: Pound Dollar Forecasts
Support around last week’s swing low was marked by the confluence of an AVWAP line starting from the April trend low, the neckline breakout level of a double bottom that subsequently formed (prior resistance becomes support), and a rising trendline that is the bottom of a trend channel. A reversal from one side of the channel opens the door to the possibility of reaching the other side. Nevertheless, the presence of the channel increases the chance that lower targets may be reached.
A decisive rally above $68.34 will trigger a bullish continuation, while potential resistance is defined by the convergence of the 200-Day MA and the 20-Day MA, between $68.89 and $68.92, respectively. But given the potential for upside momentum on a bounce off the bottom of the channel, that potential resistance zone should easily be broken. If it is not, that would not be consistent with a strong bullish reversal. Crude oil has done a good job of confirming the trend channel by hitting the top line on multiple days recently and finding resistance.
Upside targets can be considered starting at the 38.2% Fibonacci retracement at $70.14, and the 50% retracement level at $71.73. The price zone around the 50% level is strengthened by an AVWAP level from the April 2024 swing high around $72.12. Crude oil might even reach the 61.8% Fibonacci retracement area at $73.31, possibly putting it near the downtrend line. A bullish reversal has the potential to reach the dashed midline line of the rising channel. Given the angle of ascent, the 61.8% targets look very possible.
For a look at all of today’s economic events, check out our economic calendar.
July 24, 2025 – Written by Tim Boyer
STORY LINK Euro to Dollar Forecast: Can EUR/USD Challenge 45-Month Best?
The dollar posted sharp losses on Tuesday with the Euro to Dollar (EUR/USD) exchange rate surging to 2-week highs just above 1.1750 before settling just below this level with Administration rhetoric against Federal Reserve still sapping support while there is solid underlying Euro demand.
According to UoB, the Euro is looking a bit stretched; “While there is potential for EUR to rise above 1.1765 today, overbought conditions suggest it might not be able to hold above this level.”
ING is not convinced that EUR/USD can hold above 1.1700.
Danske Bank maintains a positive long-term outlook on EUR/USD for a move above 1.20 for the first time since June 2021; “While EU-US trade negotiations may introduce near-term volatility, long-term drivers such as relative rates, capital flows into European assets, and global monetary conditions continue to support the cross.”
Overnight, President Trump announced that the US had reached a framework trade deal with Japan.
There will be a 15% tariff on Japanese exports to the US while Japan has committed to purchases of aircraft and rice.
Japan also pledged a $550bn sovereign wealth fund to invest in the US, although there will be scepticism that this will make much headway.
ING discusses the weak dollar performance. It noted the possibility that trade jitters were a significant factor in undermining the currency, but considers that the overall price action makes this unlikely.
According to the bank; “This week’s losses could somehow represent a catch-up with some lower US yields seen last week or merely represent some investor re-allocation out of the US and into say Europe or Emerging Markets on a global growth play.”
It added; “we suspect that EUR/USD demand is related to the ongoing rotation out of assets in the equity, government bond and credit space. Indeed, news from the credit space is that global investors are showing a keener interest in euro-denominated products, and issuers are obliging.”
Federal Reserve policy and the threat of political intimidation remains an important underlying market element.
There has been some walking back from calls for Fed Chair Powell’s immediate departure, but no let-up in attacks on Fed policy.
In comments on Tuesday, Treasury Secretary Bessent stated that there was no need for Powell to step down immediately as he will be leaving in May anyway.
Markets are still concerned that Powell is under threat.
Schwab senior fixed income strategist Kathy Jones commented; “You can criticize the Fed for many of its policy moves over the years. But pushing the Fed chair out because he won’t follow White House instructions is a step too far.”
She added; “It will undermine confidence in the central bank at a time when inflation is still too high, and policy is a confusing mix of priorities. If Powell is replaced by someone who is seen as doing the administration’s bidding, it would likely lead to a weaker dollar and much higher long-term interest rates.”
There are very strong expectations that the ECB will leave interest rates at 2.00% on Thursday with guidance likely to be crucial for the market reaction.
According to ING, there is some risk of a Euro retreat; “We think a relatively quiet July meeting could feature some heightened scrutiny on how comfortable policymakers would be with another euro rally. FX considerations may not make their way to official communication, but could help tilt the balance to a more dovish overall tone.”
International Money Transfer? Ask our resident FX expert a money transfer question or try John’s new, free, no-obligation personal service! ,where he helps every step of the way,
ensuring you get the best exchange rates on your currency requirements.
TAGS: Euro Dollar Forecasts
Gold price (XAU/USD) trades almost 0.7% lower around $3,360 during the European trading session on Thursday. The precious metal faces a sharp selling pressure as global trade worries have eased amid hopes that the United States (US) and the European Union (EU) will close a trade agreement before the August 1 tariff deadline.
On Wednesday, a report from Financial Times (FT) showed that EU officials have signaled green signal to a trade pact with the US to avert a damaging trade war. Market experts believe the US-Japan deal confirmed on Tuesday increased fears among EU officials that they could their automobile export market share in the US economy, as Washington has slashed tariffs on cars from Tokyo to 15%.
The minutes of the US-Japan deal showed that the baseline and automobile levy on imports from Tokyo to Washington will be 15%. The US charges 25% import duty on all foreign cars, which is separate from the baseline tariff rate.
Easing global trade tensions have diminished demand for safe-haven assets, such as Gold.
Meanwhile, a slight recovery move in the US Dollar (US) seen during the day has also weighed on the Gold price. Technically, a higher US Dollar makes the Gold price an expensive bet for investors.
The US Dollar Index (DXY), which tracks the Greenback’s value against six major currencies, rebounds to near 97.40 after posting a fresh over two-week low near 97.00 earlier in the day.
Going forward, the major trigger for the Gold price will be the Federal Reserve’s (Fed) monetary policy meeting, which is scheduled for next week.
Gold price faces selling pressure after failing to break the Symmetrical Triangle formation on the upside – a move that often leads to volatility expansion. The upward-sloping trendline of the above-mentioned chart pattern is placed from the May 15 low of $3,120.83, while its downward-sloping border is plotted from the April 22 high around $3,500
The 20-day Exponential Moving Average (EMA) still acts as a key support area for the Gold price around $3,355.
The 14-day Relative Strength Index (RSI) falls inside the 40.00-60.00 range, suggesting selling pressure at higher levels.
The Gold price would fall towards the round-level support of $3,200 and the May 15 low at $3,121, if it breaks below the May 29 low of $3,245.
Looking up, the Gold price will enter in an unchartered territory if it breaks above the psychological level of $3,500 decisively. Potential resistances would be $3,550 and $3,600.
Gold has played a key role in human’s history as it has been widely used as a store of value and medium of exchange. Currently, apart from its shine and usage for jewelry, the precious metal is widely seen as a safe-haven asset, meaning that it is considered a good investment during turbulent times. Gold is also widely seen as a hedge against inflation and against depreciating currencies as it doesn’t rely on any specific issuer or government.
Central banks are the biggest Gold holders. In their aim to support their currencies in turbulent times, central banks tend to diversify their reserves and buy Gold to improve the perceived strength of the economy and the currency. High Gold reserves can be a source of trust for a country’s solvency. Central banks added 1,136 tonnes of Gold worth around $70 billion to their reserves in 2022, according to data from the World Gold Council. This is the highest yearly purchase since records began. Central banks from emerging economies such as China, India and Turkey are quickly increasing their Gold reserves.
Gold has an inverse correlation with the US Dollar and US Treasuries, which are both major reserve and safe-haven assets. When the Dollar depreciates, Gold tends to rise, enabling investors and central banks to diversify their assets in turbulent times. Gold is also inversely correlated with risk assets. A rally in the stock market tends to weaken Gold price, while sell-offs in riskier markets tend to favor the precious metal.
The price can move due to a wide range of factors. Geopolitical instability or fears of a deep recession can quickly make Gold price escalate due to its safe-haven status. As a yield-less asset, Gold tends to rise with lower interest rates, while higher cost of money usually weighs down on the yellow metal. Still, most moves depend on how the US Dollar (USD) behaves as the asset is priced in dollars (XAU/USD). A strong Dollar tends to keep the price of Gold controlled, whereas a weaker Dollar is likely to push Gold prices up.
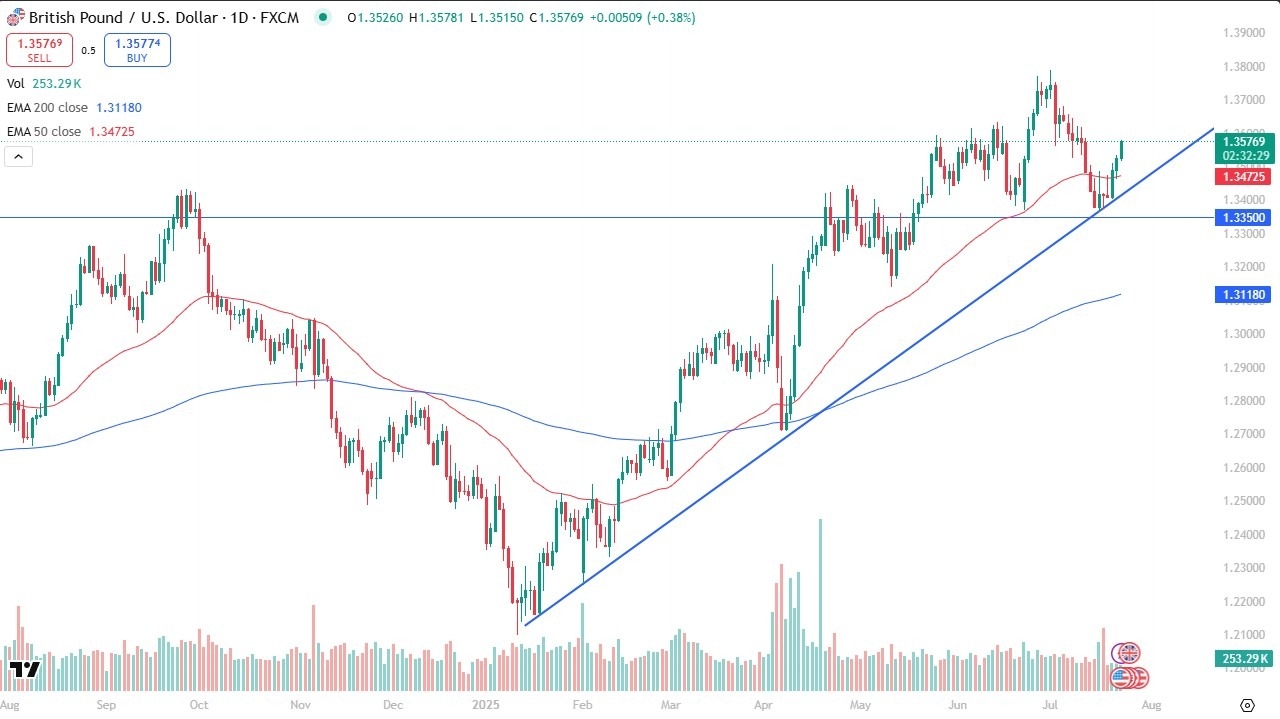
The technical analysis for this market is very bullish as long as we can stay above the 1.3350 level, but I would be concerned if we were to break down below there. At that point, we could come into the 200 Day EMA, near the 1.3118 level. All things being equal, the British pound has been a strong performer against the US dollar for some time, even when we were falling, because quite frankly “the British pound was less bad than the others.” In other words, the British pound has been relatively stronger than most of his contemporaries against the greenback, so that should translate in both directions unless something specific comes out London that we need to be worried about.
If we were to pull back in reach toward the 200 Day EMA, anything underneath there would be a very negative turn of events, and we would probably see the US dollar strengthen against almost everything around the world. The British pound may fall slower than other currencies, but if the British Pound finds itself under that much pressure, it’s likely that other currencies like the Canadian dollar, Japanese yen, euro, etc. will all be struggling against the US dollar. All things being equal though, this looks like a market that’s much more likely to go higher than lower
Ready to trade the Forex GBP/USD analysis and predictions? Here are the best forex trading platforms UK to choose from.
Christopher Lewis has been trading Forex and has over 20 years experience in financial markets. Chris has been a regular contributor to Daily Forex since the early days of the site. He writes about Forex for several online publications, including FX Empire, Investing.com, and his own site, aptly named The Trader Guy. Chris favours technical analysis methods to identify his trades and likes to trade equity indices and commodities as well as Forex. He favours a longer-term trading style, and his trades often last for days or weeks.
The light sweet crude oil market has shown itself to be bullish as we continue to hang around the $65 level. The $65 level also is backed up by the 50-day EMA, and it is the area that we previously had seen a lot of resistance. We had a massive move higher after the Israel airstrikes in Iran, but once the peace was signed and agreed to, oil markets collapsed. What I find interesting, though, is that we are hanging around this same area of previous resistance, and it seems like the market is getting comfortable. We have a lot of wicks to the upside. So, if we can break above the highest one, which is basically $66.50, then I think oil goes higher, probably more of a grind.
Brent looks very much the same, although we have the 50 day EMA above and the $68 level offering resistance. So, in this case, I’d like to see Brent break above $69. If we can do that, then the 200 day EMA gets targeted at $71.20. Short-term pullbacks are possible and quite frankly, we could just continue to stumble here. But I think we’ve got a situation where seasonality favors higher prices. And I do think that the market is trying to do everything it can to build up confidence to go to the upside. Because of this, I’m not really looking to short the market, but I think really at this point in time, we’re more or less in a wait and see type of situation after that wild move. I think most participants are a bit exhausted.