The main category of Forex News.
You can use the search box below to find what you need.
[wd_asp id=1]
The main category of Forex News.
You can use the search box below to find what you need.
[wd_asp id=1]
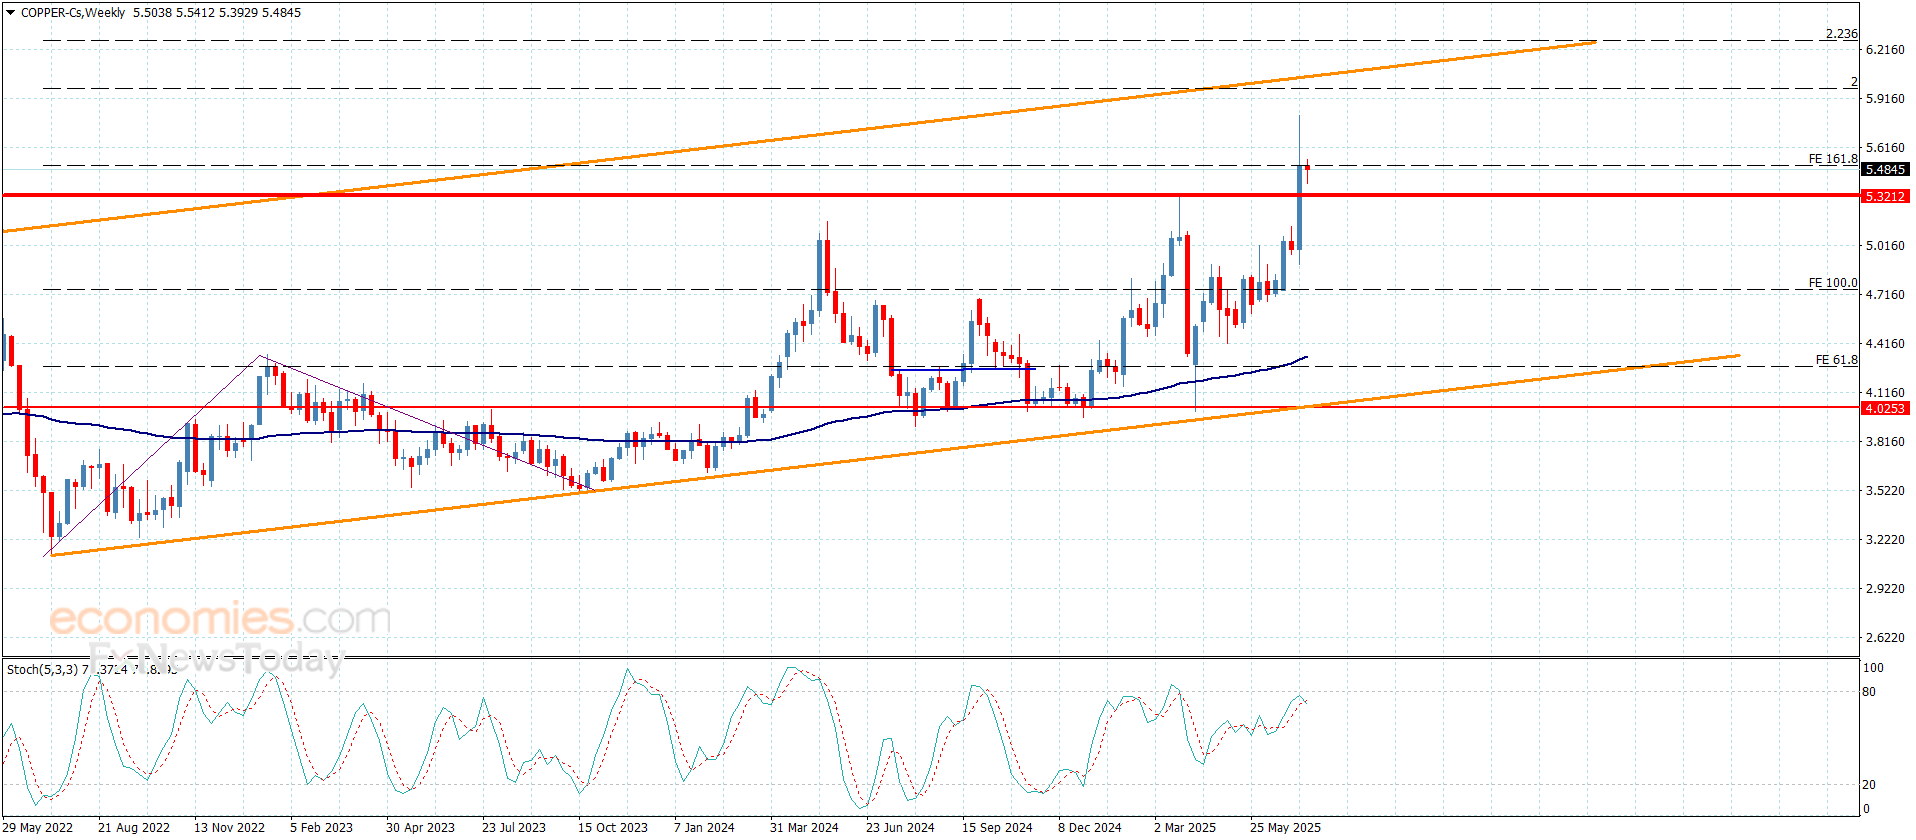
Despite the weakness of copper price trading, its success in holding above support level at $5.3200 reinforces the chances of renewing the bullish rally, by the attempt to provide clear pressures on the barrier at $5.5100.
We recommend waiting to breach the current barrier to open the way towards achieving several gains, which might begin at $5.6700 and $5.9700, while the decline below the support will cancel the bullish suggestion in the near trading, which forces it to suffer some losses by reaching $5.1500 and $4.9800.
The expected trading range for today is between $5.4200 and $5.6700
Trend forecast: Bullish
Silver (XAG/USD) is treading water on Friday, with spot prices hovering near $38.25 after marking a fresh 14-year high of $39.13 earlier this week. The metal continues to draw support from a firmly bullish structure, trading within a well-defined ascending channel on both the daily and weekly charts. While momentum has cooled slightly near multi-year highs, the broader technical outlook remains positive, with prices still comfortably positioned above key short-term moving averages.
The 21-day EMA at $37.05 continues to provide dynamic support, while the 50-day EMA near $35.82 offers a solid cushion for any deeper pullbacks.
Although price is consolidating just below the $38.50-$39.00 resistance zone, momentum indicators are beginning to turn higher again. The Relative Strength Index (RSI) eased slightly after nearing overbought territory earlier in the week when Silver hit its 14-year high. However, it has started to slope upward again, currently hovering around 66, pointing to a potential revival in buying interest.
The Average Directional Index (ADX) on the daily chart is also beginning to pick up, suggesting that trend strength may be strengthening after a brief slowdown. These developments indicate that the recent consolidation may be a healthy pause within the broader uptrend, rather than a signal of exhaustion.
Immediate support is seen around $37.00 round number, aligning with the 21-day EMA and marking a key line in the sand for bulls. A break below this level could trigger a deeper pullback, exposing the next support at $35.50, followed by a stronger demand zone near $34.50. On the upside, a sustained move above $39.13 would likely attract fresh buying interest, opening the door for a push toward the psychological $40.00 level and potentially higher.
Silver is a precious metal highly traded among investors. It has been historically used as a store of value and a medium of exchange. Although less popular than Gold, traders may turn to Silver to diversify their investment portfolio, for its intrinsic value or as a potential hedge during high-inflation periods. Investors can buy physical Silver, in coins or in bars, or trade it through vehicles such as Exchange Traded Funds, which track its price on international markets.
Silver prices can move due to a wide range of factors. Geopolitical instability or fears of a deep recession can make Silver price escalate due to its safe-haven status, although to a lesser extent than Gold’s. As a yieldless asset, Silver tends to rise with lower interest rates. Its moves also depend on how the US Dollar (USD) behaves as the asset is priced in dollars (XAG/USD). A strong Dollar tends to keep the price of Silver at bay, whereas a weaker Dollar is likely to propel prices up. Other factors such as investment demand, mining supply – Silver is much more abundant than Gold – and recycling rates can also affect prices.
Silver is widely used in industry, particularly in sectors such as electronics or solar energy, as it has one of the highest electric conductivity of all metals – more than Copper and Gold. A surge in demand can increase prices, while a decline tends to lower them. Dynamics in the US, Chinese and Indian economies can also contribute to price swings: for the US and particularly China, their big industrial sectors use Silver in various processes; in India, consumers’ demand for the precious metal for jewellery also plays a key role in setting prices.
Silver prices tend to follow Gold’s moves. When Gold prices rise, Silver typically follows suit, as their status as safe-haven assets is similar. The Gold/Silver ratio, which shows the number of ounces of Silver needed to equal the value of one ounce of Gold, may help to determine the relative valuation between both metals. Some investors may consider a high ratio as an indicator that Silver is undervalued, or Gold is overvalued. On the contrary, a low ratio might suggest that Gold is undervalued relative to Silver.
There are also questions about whether or not Russian gas will ever come back online on the continent. And this may, in the future at least, open up the possibility of higher prices in the off season, if you will, making natural gas extraordinarily supported. That being said, we also have to think about AI and electricity and things like that. So longer term, we may see a little bit of a change in the way the market works at this time of year.
Regardless, and thinking well past all of that, I look at this as a market that you’re still fading rallies in, at least for a couple of months. If we were to break above the previous uptrend line, then we could go looking to the $3.75 level and then possibly $4, which is the top of the overall range. On the downside, the $3.20 level is a potential target. After that, we could look at the $3 level. We’re essentially in the middle of the range, but it does look like we’re getting a bit tired, so I think more downward than upward pressure is present.
For a look at all of today’s economic events, check out our economic calendar.
Despite the weakness of copper price trading, its success in holding above support level at $5.3200 reinforces the chances of renewing the bullish rally, by the attempt to provide clear pressures on the barrier at $5.5100.
We recommend waiting to breach the current barrier to open the way towards achieving several gains, which might begin at $5.6700 and $5.9700, while the decline below the support will cancel the bullish suggestion in the near trading, which forces it to suffer some losses by reaching $5.1500 and $4.9800.
The expected trading range for today is between $5.4200 and $5.6700
Trend forecast: Bullish
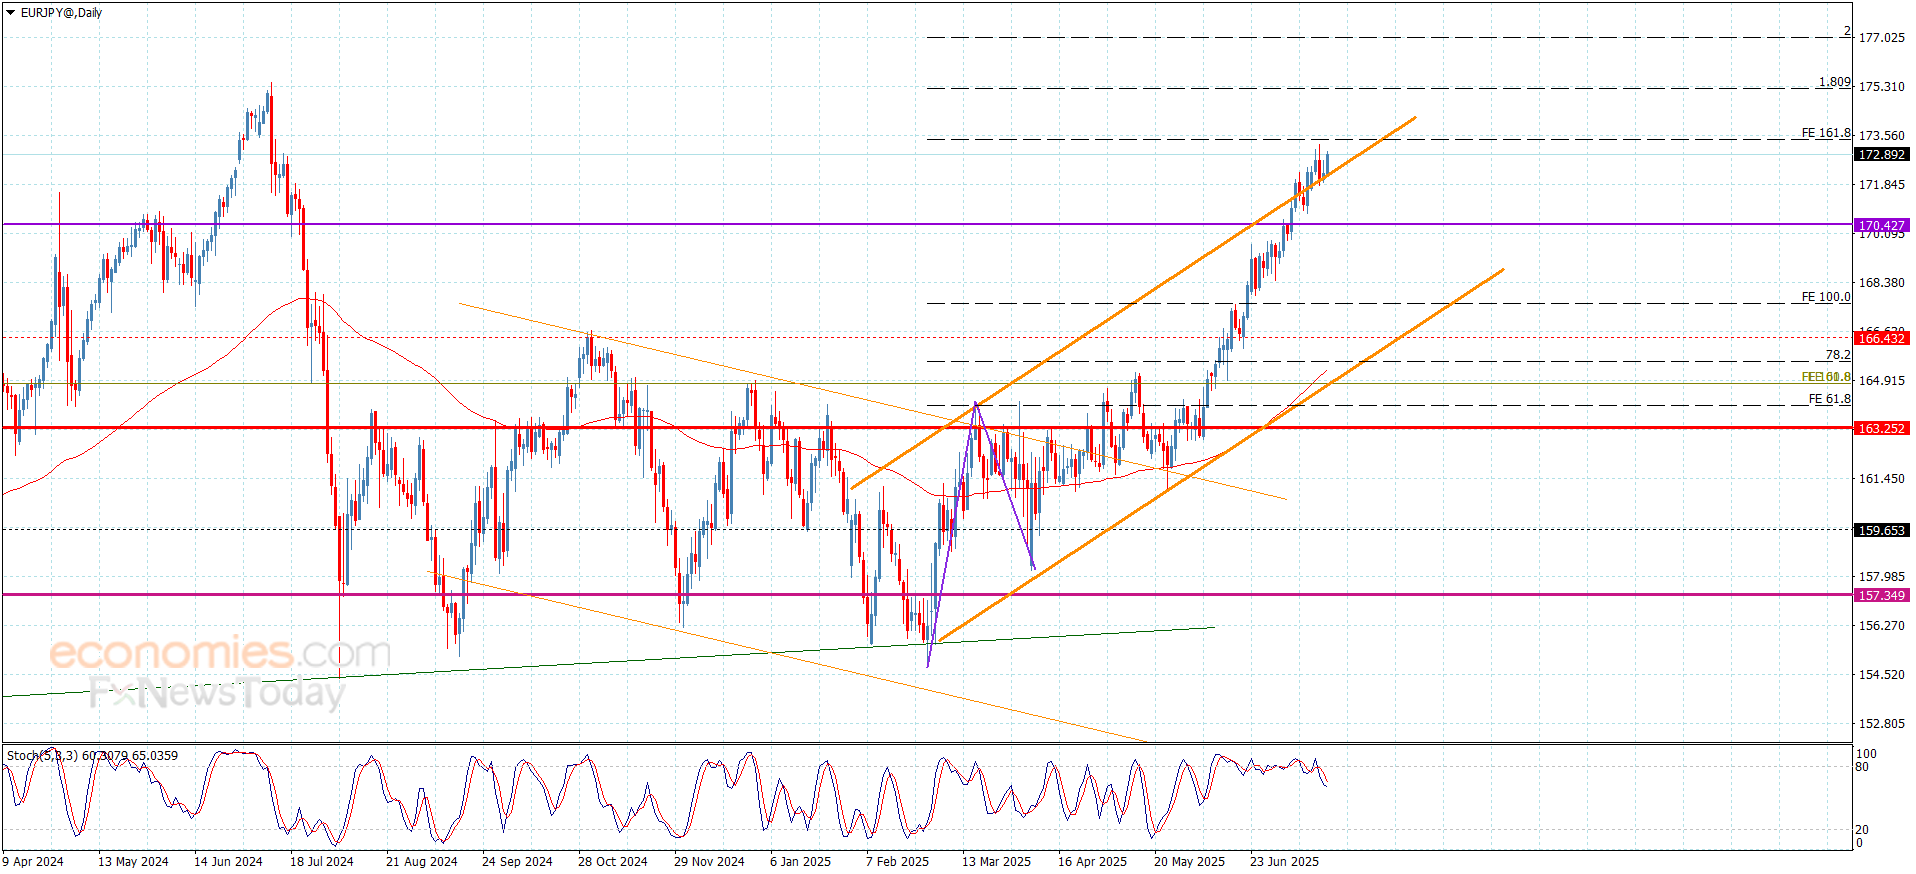
The EURJPY pair kept its stability above the breached bullish channel’s resistance, which forms an extra support at 172.10, forming a new bullish rally and its fluctuation near 173.00 level.
Note that monitoring the price behavior after achieving the target at 173.40, due to the continuation of stochastic contradiction by its fluctuations below 80 level, and surpassing this level is important to reinforce the chances for resuming the bullish attack and reaching new positive stations that might extend to 173.85 and 174.40, while activating the bearish correctional track requires a sharp decline to settle below 172.00.
The expected trading range for today is between 172.10 and 173.85.
Trend forecast: Bullish
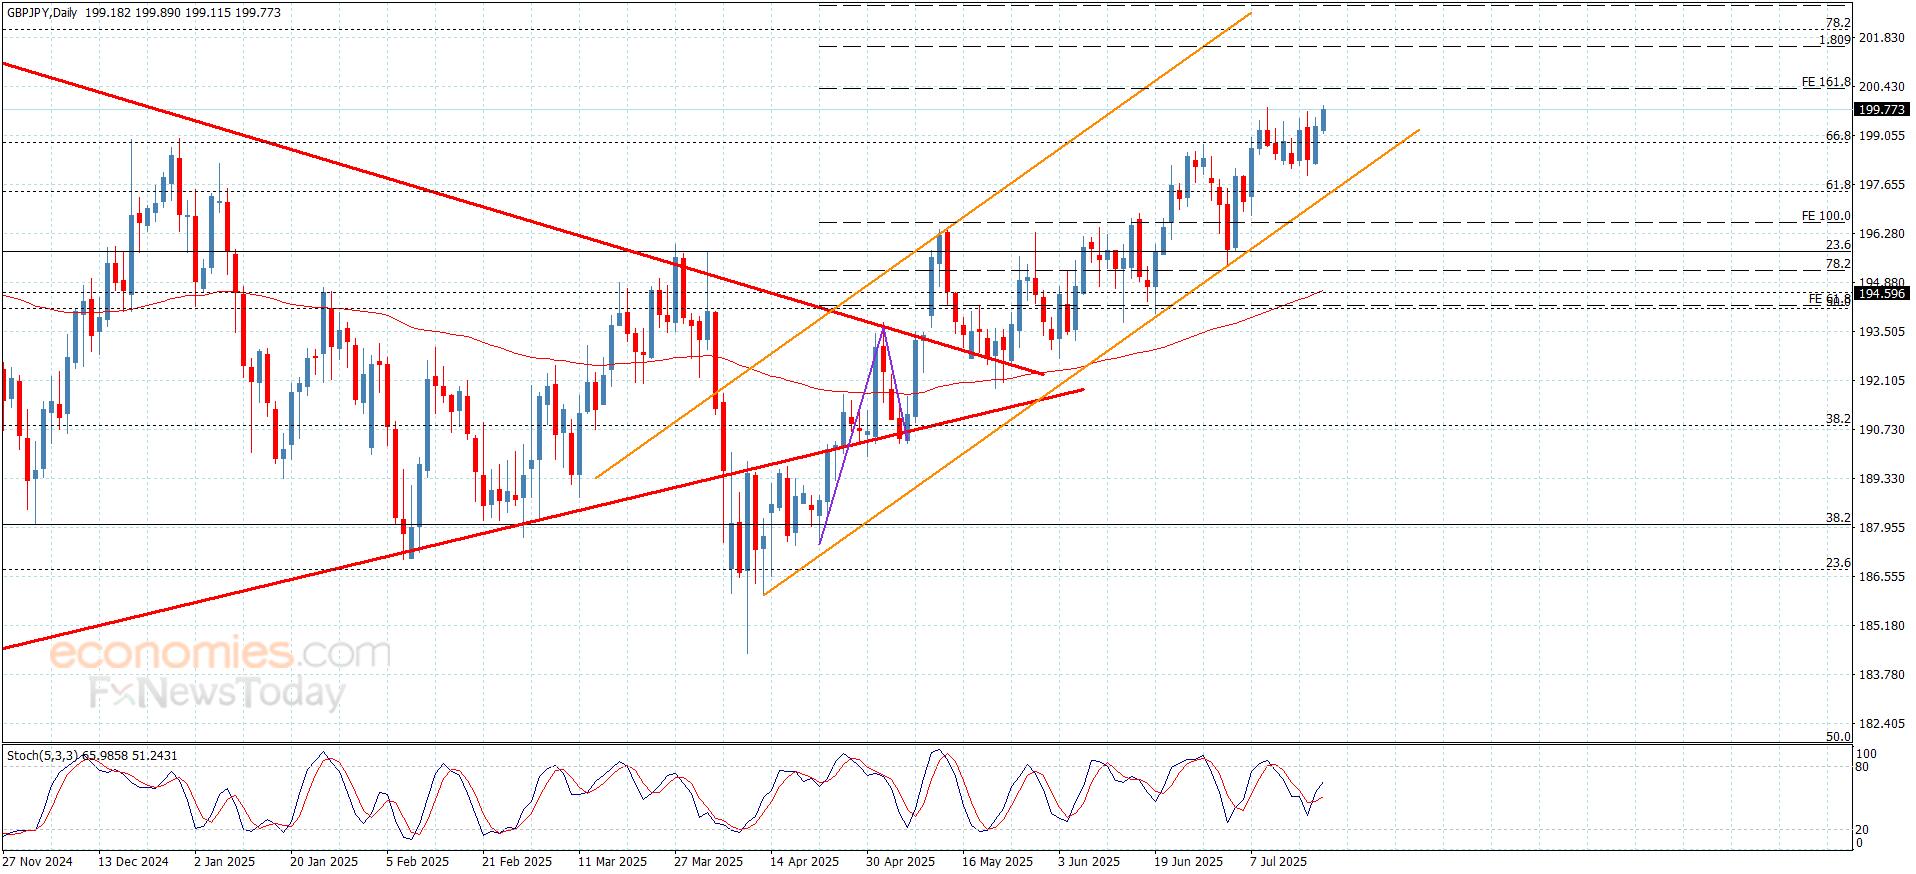
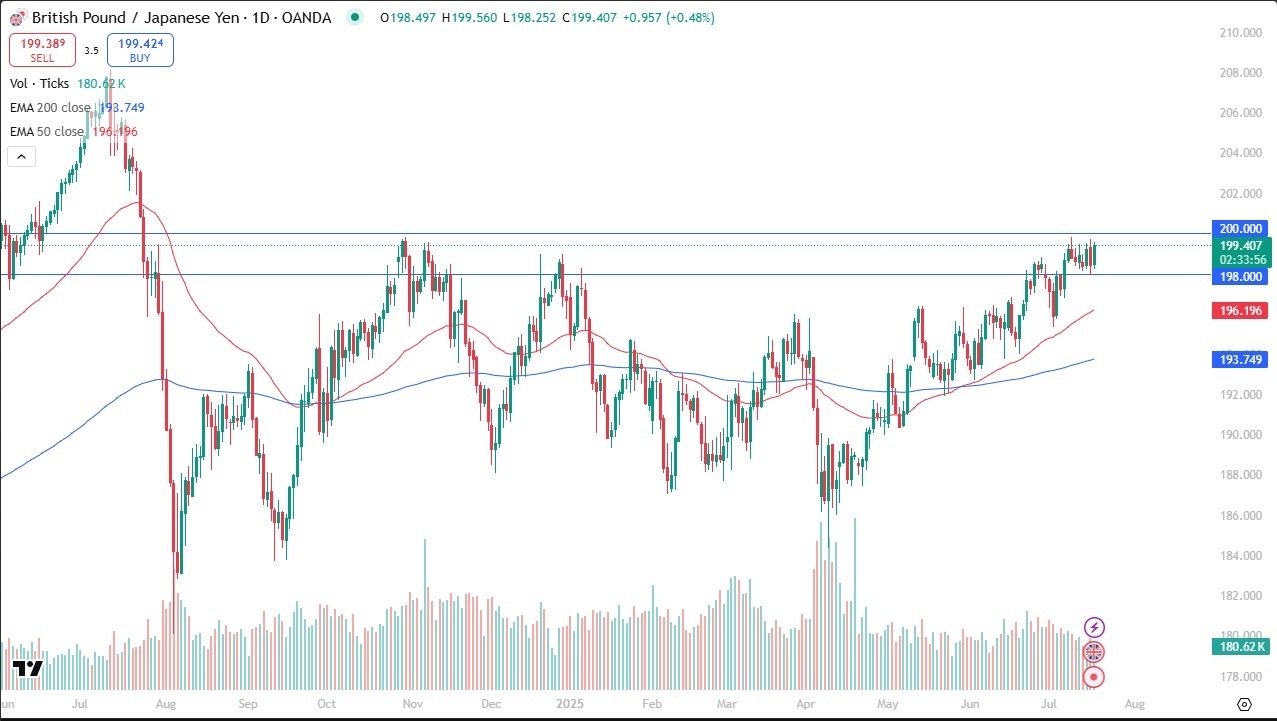
On the downside, I see the ¥198 level as the bottom of this consolidation area, so what I want to see is this market stay above the crucial ¥190 level, which is a pretty significant area going back multiple days. If we were to break down below there, then I think you might have a bigger problem. If we can break below there, then it’s very possible that we could drop all the way down to the ¥196 region.

Keep in mind that the pair is highly sensitive to risk appetite overall, as the Japanese yen is considered to be a safety currency, while the British pound is considered to be a little bit “riskier”, although that doesn’t necessarily mean that the United Kingdom is a place where I’d be worried about putting my money. It just seems to be the overall attitude of this pair.
With that being said, I think that you need to pay close attention to what is going on here, but I would point out that risk appetite has been pretty good on Thursday, so we need just a bit more positive attitude out there I think to send this market to the upside. All things being equal, this is a market that I think continues to be very noisy but given enough time I do think that we below passed the ¥200 level and continue to go higher.
Begin trading our daily forecasts and analysis. Here is a list of Forex brokers in Japan to work with.
Christopher Lewis has been trading Forex and has over 20 years experience in financial markets. Chris has been a regular contributor to Daily Forex since the early days of the site. He writes about Forex for several online publications, including FX Empire, Investing.com, and his own site, aptly named The Trader Guy. Chris favours technical analysis methods to identify his trades and likes to trade equity indices and commodities as well as Forex. He favours a longer-term trading style, and his trades often last for days or weeks.
Despite the weakness of copper price trading, its success in holding above support level at $5.3200 reinforces the chances of renewing the bullish rally, by the attempt to provide clear pressures on the barrier at $5.5100.
We recommend waiting to breach the current barrier to open the way towards achieving several gains, which might begin at $5.6700 and $5.9700, while the decline below the support will cancel the bullish suggestion in the near trading, which forces it to suffer some losses by reaching $5.1500 and $4.9800.
The expected trading range for today is between $5.4200 and $5.6700
Trend forecast: Bullish
Despite the weakness of copper price trading, its success in holding above support level at $5.3200 reinforces the chances of renewing the bullish rally, by the attempt to provide clear pressures on the barrier at $5.5100.
We recommend waiting to breach the current barrier to open the way towards achieving several gains, which might begin at $5.6700 and $5.9700, while the decline below the support will cancel the bullish suggestion in the near trading, which forces it to suffer some losses by reaching $5.1500 and $4.9800.
The expected trading range for today is between $5.4200 and $5.6700
Trend forecast: Bullish
Silver (XAG/USD) is rallying for the third consecutive day on Friday, with bulls testing July 15 highs of 38.40 at the time of writing, as the US Dollar falls alongside US Treasury yields amid higher risk appetite.
Corporate earnings reports from Netflix, the Chipmaker TSMC, PepsiCo, and United Airlines, among others, beat market expectations on Thursday, boosting demand for equities and risk-sensitive assets to the detriment of safe havens like the US Dollar.
These reports, coupled with dovish comments from Fed Governour Christopher Waller, who maintained that the bank should cut interest rates in July, citing downside risks for the labour market and economic growth, are contributing to keeping the US Dollar on the defensive on Friday.
From a technical perspective, the pair´s corrective reversal from long-term highs above $39.00 has been capped above the reverse trendline of a previous bullish channel, and the pair is trading higher again.
Bulls are testing the 15 July high at $38.40, with the 4-hour RSI steady at levels above 50, which suggests that further appreciation is likely. A confirmation above that level brings the July 14 high, at $39.15, to the focus.
A rejection from current levels, on the contrary, might find support at the mentioned trendline, now at $37.8, ahead of the July 15, 16, and 17 lows, at $37,60. Below here, the 50% Fibonacci retracement of the June-July rally, and the July 6 low, at $37.25, might attract selling pressure.
Silver is a precious metal highly traded among investors. It has been historically used as a store of value and a medium of exchange. Although less popular than Gold, traders may turn to Silver to diversify their investment portfolio, for its intrinsic value or as a potential hedge during high-inflation periods. Investors can buy physical Silver, in coins or in bars, or trade it through vehicles such as Exchange Traded Funds, which track its price on international markets.
Silver prices can move due to a wide range of factors. Geopolitical instability or fears of a deep recession can make Silver price escalate due to its safe-haven status, although to a lesser extent than Gold’s. As a yieldless asset, Silver tends to rise with lower interest rates. Its moves also depend on how the US Dollar (USD) behaves as the asset is priced in dollars (XAG/USD). A strong Dollar tends to keep the price of Silver at bay, whereas a weaker Dollar is likely to propel prices up. Other factors such as investment demand, mining supply – Silver is much more abundant than Gold – and recycling rates can also affect prices.
Silver is widely used in industry, particularly in sectors such as electronics or solar energy, as it has one of the highest electric conductivity of all metals – more than Copper and Gold. A surge in demand can increase prices, while a decline tends to lower them. Dynamics in the US, Chinese and Indian economies can also contribute to price swings: for the US and particularly China, their big industrial sectors use Silver in various processes; in India, consumers’ demand for the precious metal for jewellery also plays a key role in setting prices.
Silver prices tend to follow Gold’s moves. When Gold prices rise, Silver typically follows suit, as their status as safe-haven assets is similar. The Gold/Silver ratio, which shows the number of ounces of Silver needed to equal the value of one ounce of Gold, may help to determine the relative valuation between both metals. Some investors may consider a high ratio as an indicator that Silver is undervalued, or Gold is overvalued. On the contrary, a low ratio might suggest that Gold is undervalued relative to Silver.
Following Thursday’s choppy action, GBP/USD gains traction and rises toward 1.3450 in the European session on Friday.
The table below shows the percentage change of British Pound (GBP) against listed major currencies today. British Pound was the strongest against the US Dollar.
| USD | EUR | GBP | JPY | CAD | AUD | NZD | CHF | |
|---|---|---|---|---|---|---|---|---|
| USD | -0.33% | -0.18% | 0.00% | -0.17% | -0.45% | -0.49% | -0.35% | |
| EUR | 0.33% | 0.15% | 0.33% | 0.16% | -0.12% | -0.28% | -0.02% | |
| GBP | 0.18% | -0.15% | 0.16% | 0.02% | -0.26% | -0.38% | -0.16% | |
| JPY | 0.00% | -0.33% | -0.16% | -0.18% | -0.46% | -0.60% | -0.26% | |
| CAD | 0.17% | -0.16% | -0.02% | 0.18% | -0.31% | -0.40% | -0.18% | |
| AUD | 0.45% | 0.12% | 0.26% | 0.46% | 0.31% | -0.11% | 0.11% | |
| NZD | 0.49% | 0.28% | 0.38% | 0.60% | 0.40% | 0.11% | 0.22% | |
| CHF | 0.35% | 0.02% | 0.16% | 0.26% | 0.18% | -0.11% | -0.22% |
The heat map shows percentage changes of major currencies against each other. The base currency is picked from the left column, while the quote currency is picked from the top row. For example, if you pick the British Pound from the left column and move along the horizontal line to the US Dollar, the percentage change displayed in the box will represent GBP (base)/USD (quote).
Although Pound Sterling managed to hold its ground following the employment report, the upbeat data releases from the US supported the US Dollar and made it difficult for the pair to gather bullish momentum on Thursday.
The US Census Bureau reported that Retail Sales in the US rose by 0.6% on a monthly basis in June, surpassing the market forecast for an increase of 0.1%. Additionally, the number of first-time applications for unemployment benefits declined to 221,000 from 228,000 in the previous week.
Meanwhile, dovish comments from Federal Reserve (Fed) Governor Christopher Waller, who said late Thursday that he continues to believe that the Fed should cut its interest rate target at the July meeting, limited the USD’s gains and allowed GBP/USD to keep its footing.
The University of Michigan (UoM) will release the preliminary Consumer Sentiment Index data for July later in the day. Investors could ignore the headline number and react to the 1-year Consumer Inflation Expectations component of the survey. A noticeable increase in this data could boost the USD with the immediate reaction. Nevertheless, in case markets remain risk-positive heading into the weekend, GBP/USD could stretch higher. At the time of press, US stock index futures were up between 0.1% and 0.2%.
The Relative Strength Index (RSI) indicator on the 4-hour chart recovered to 50 and GBP/USD closed the last three 4-hour candles above the 20-period Simple Moving Average (SMA), reflecting a lack of seller interest.
On the upside, 1.3470 (Fibonacci 50% retracement of the latest uptrend) aligns as the first resistance level before 1.3500 (static level, round level) and 1.3540 (Fibonacci 38.2% retracement). Looking south, support levels could be seen at 1.3400-1.3390 (round level, Fibonacci 61.8% retracement) and 1.3300 (Fibonacci 78.6% retracement).
The Pound Sterling (GBP) is the oldest currency in the world (886 AD) and the official currency of the United Kingdom. It is the fourth most traded unit for foreign exchange (FX) in the world, accounting for 12% of all transactions, averaging $630 billion a day, according to 2022 data.
Its key trading pairs are GBP/USD, also known as ‘Cable’, which accounts for 11% of FX, GBP/JPY, or the ‘Dragon’ as it is known by traders (3%), and EUR/GBP (2%). The Pound Sterling is issued by the Bank of England (BoE).
The single most important factor influencing the value of the Pound Sterling is monetary policy decided by the Bank of England. The BoE bases its decisions on whether it has achieved its primary goal of “price stability” – a steady inflation rate of around 2%. Its primary tool for achieving this is the adjustment of interest rates.
When inflation is too high, the BoE will try to rein it in by raising interest rates, making it more expensive for people and businesses to access credit. This is generally positive for GBP, as higher interest rates make the UK a more attractive place for global investors to park their money.
When inflation falls too low it is a sign economic growth is slowing. In this scenario, the BoE will consider lowering interest rates to cheapen credit so businesses will borrow more to invest in growth-generating projects.
Data releases gauge the health of the economy and can impact the value of the Pound Sterling. Indicators such as GDP, Manufacturing and Services PMIs, and employment can all influence the direction of the GBP.
A strong economy is good for Sterling. Not only does it attract more foreign investment but it may encourage the BoE to put up interest rates, which will directly strengthen GBP. Otherwise, if economic data is weak, the Pound Sterling is likely to fall.
Another significant data release for the Pound Sterling is the Trade Balance. This indicator measures the difference between what a country earns from its exports and what it spends on imports over a given period.
If a country produces highly sought-after exports, its currency will benefit purely from the extra demand created from foreign buyers seeking to purchase these goods. Therefore, a positive net Trade Balance strengthens a currency and vice versa for a negative balance.