The main category of Forex News.
You can use the search box below to find what you need.
[wd_asp id=1]
The main category of Forex News.
You can use the search box below to find what you need.
[wd_asp id=1]
The EURJPY pair kept its stability above the breached bullish channel’s resistance, which forms an extra support at 172.10, forming a new bullish rally and its fluctuation near 173.00 level.
Note that monitoring the price behavior after achieving the target at 173.40, due to the continuation of stochastic contradiction by its fluctuations below 80 level, and surpassing this level is important to reinforce the chances for resuming the bullish attack and reaching new positive stations that might extend to 173.85 and 174.40, while activating the bearish correctional track requires a sharp decline to settle below 172.00.
The expected trading range for today is between 172.10 and 173.85.
Trend forecast: Bullish
The Bank of Japan has had several issues recently, not the least of which will be the fact that the Japanese Government Bond market has seen a couple of days where there have been nobody willing to bid for Japanese debt. This is not a good thing and could cause serious problems for the Japanese going forward. In that environment, you can see a potential need for the Bank of Japan to step in and start buying bonds.

This is exactly what “quantitative easing” is most of the time, and it does tend to work against the value of the currency.
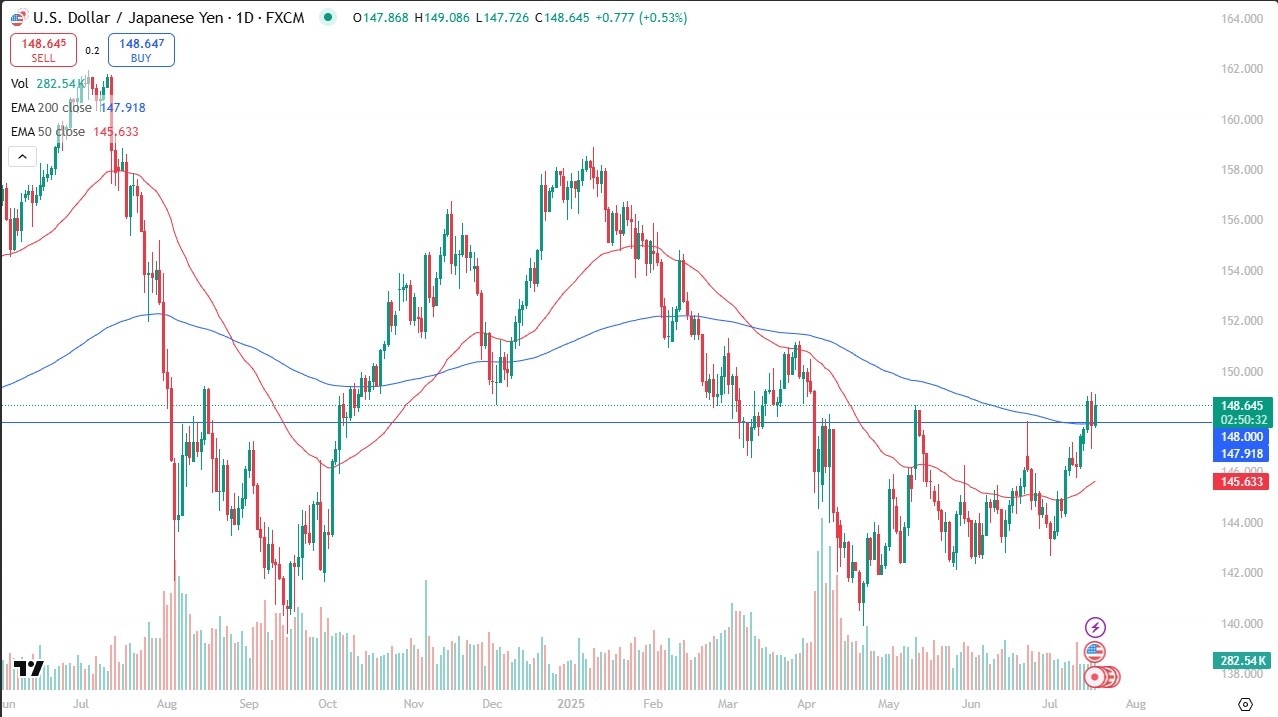
The technical analysis for this market is a bit mixed at the moment, because we have fallen pretty significantly, so it’s a little bit of a stretch to say that we have the “all clear” to start buying, but at this point in time I just don’t have any interest in shorting this pair. I get paid at the end of every session to own this market, at least to the upside, and that’s exactly how I’ve been playing this. It’s been very boring, and quite frankly you have to simply hold this pair and forget it most of the time.
I do think that if the market were to break below the low of Wednesday, we could have a drop to the 50 day EMA, this is more of a swing trade for me, and therefore I’m not looking to do anything rash. I don’t have a huge position, but it’s worth noting that the prophet that I’m making gets bigger every day due to that swap. If we can break above the high of the last couple of days, then the next target will almost certainly be the ¥151 level.
Want to trade our USD/JPY forex analysis and predictions? Here’s a list of forex brokers in Japan to check out.
Christopher Lewis has been trading Forex and has over 20 years experience in financial markets. Chris has been a regular contributor to Daily Forex since the early days of the site. He writes about Forex for several online publications, including FX Empire, Investing.com, and his own site, aptly named The Trader Guy. Chris favours technical analysis methods to identify his trades and likes to trade equity indices and commodities as well as Forex. He favours a longer-term trading style, and his trades often last for days or weeks.
Today’s behavior shows improving demand for gold and possibly the completion of another test of the lower uptrend line across the bottom of a developing bull pennant pattern. Therefore, the short-term pullback is likely complete. A daily close above the 20-Day MA will confirm strength indicated by the reclaim of the 20-Day line.
Moreover, the day is set to end with a potentially bullish hammer candlestick pattern. Although it is not distinct at the bottom of a downtrend, it does provide another piece of bullish evidence. Also, the one-day pattern, which indicates an intraday bullish reversal, can be used to alert a short-term bullish indication on a rise above the high for the day, currently at $3,352.
It is important to understand however, that a hammer breakout would be happening inside a five-day price range, which may impact the response. On Wednesday, gold triggered an upside breakout of a 16-day relatively tight price range and reached a new high for the range at $3,377. The breakout failed to follow through and led to the drop to a six-day low of $3,310 today.
That high was a three-week high. So, a breakout above $3,377 will confirm a multi-week bull breakout. Of course, this would be a bullish sign and put gold in site of the top line at the top of the pennant pattern. That could lead to the pennant triggering an upside-breakout, or a consolidation of some degree first.
With Wednesday’s rally a higher weekly high was established, and a higher low will be completed today. This is the second week for the pattern, and it shows improving demand. Although a break above the top trendline triggers the pennant, a more significant signal would be above the lower swing high at $3,451. An initial upside target is at $3,578, indicated by a rising ABCD pattern.
For a look at all of today’s economic events, check out our economic calendar.
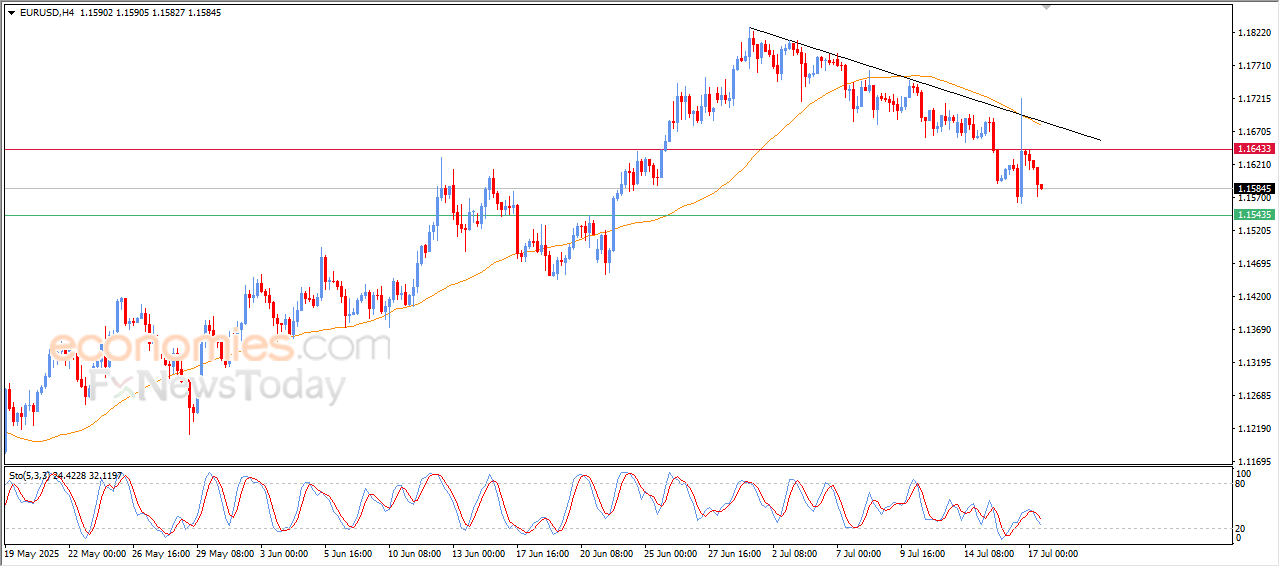
The euro has fallen again during the trading session on Thursday as we continue to see a bit of a pullback. The 50-day EMA sits just above the 1.15 level, which of course is a large, round, psychologically significant figure and an area where we had seen a lot of resistance previously. So, the question at this point in time looks as if the market is going to test this for market memory. The Euro, of course, has been in a strong uptrend for some time. So, I’m not ready to start shorting it yet, but if we get below the 1.15 level, it’s possible I may end up doing exactly that. In the meantime, I’m waiting to see if we get a reaction to this support region.
The US dollar has rallied quite nicely against the Japanese yen as the 148 yen level and the 50 day EMA both offered support. I suspect given enough time, this is a market that could go looking to the 151 yen level, which is an area we had seen a little bit of a double top at previously. So, I do think that might be where we’re heading in the short term. If we were to break down below the lows of the crazy Wednesday candlestick, then that could throw that in the garbage bin. But all things being equal, this is a market that pays you to hang on to it. And clearly it looks like we’re trying to do everything we can to rally.
Forecast models remain in alignment on increasingly hot conditions for the second half of July, particularly across the eastern two-thirds of the U.S. NatGasWeather noted that the next five days will carry solid demand due to widespread heat, while days 6–15 show a “decisively hotter” outlook.
Temperatures are expected to surge into the 90s along the East Coast and hit triple digits in California and the Southwest, with modest cooling only in the northern third of the country.
These heat-driven forecasts are boosting near-term demand expectations for electricity generation, increasing the call on gas-fired power.
On Wednesday, August Nymex natural gas settled up $0.028 (+0.79%) at a new two-week high. The rally has been fueled by stronger air conditioning load and steady LNG exports, which climbed slightly to 15.1 bcf/day, according to BNEF.
Attention is now turning to Thursday’s EIA storage report for the week ended July 11, which is expected to show a +45 bcf injection—above the five-year average of +41 bcf.
However, analysts are treating the print as “tricky,” factoring in distortions from the Fourth of July holiday and weaker wind generation. Last week’s inventory build of +53 bcf was bullish, falling below expectations and aligning with seasonal norms.
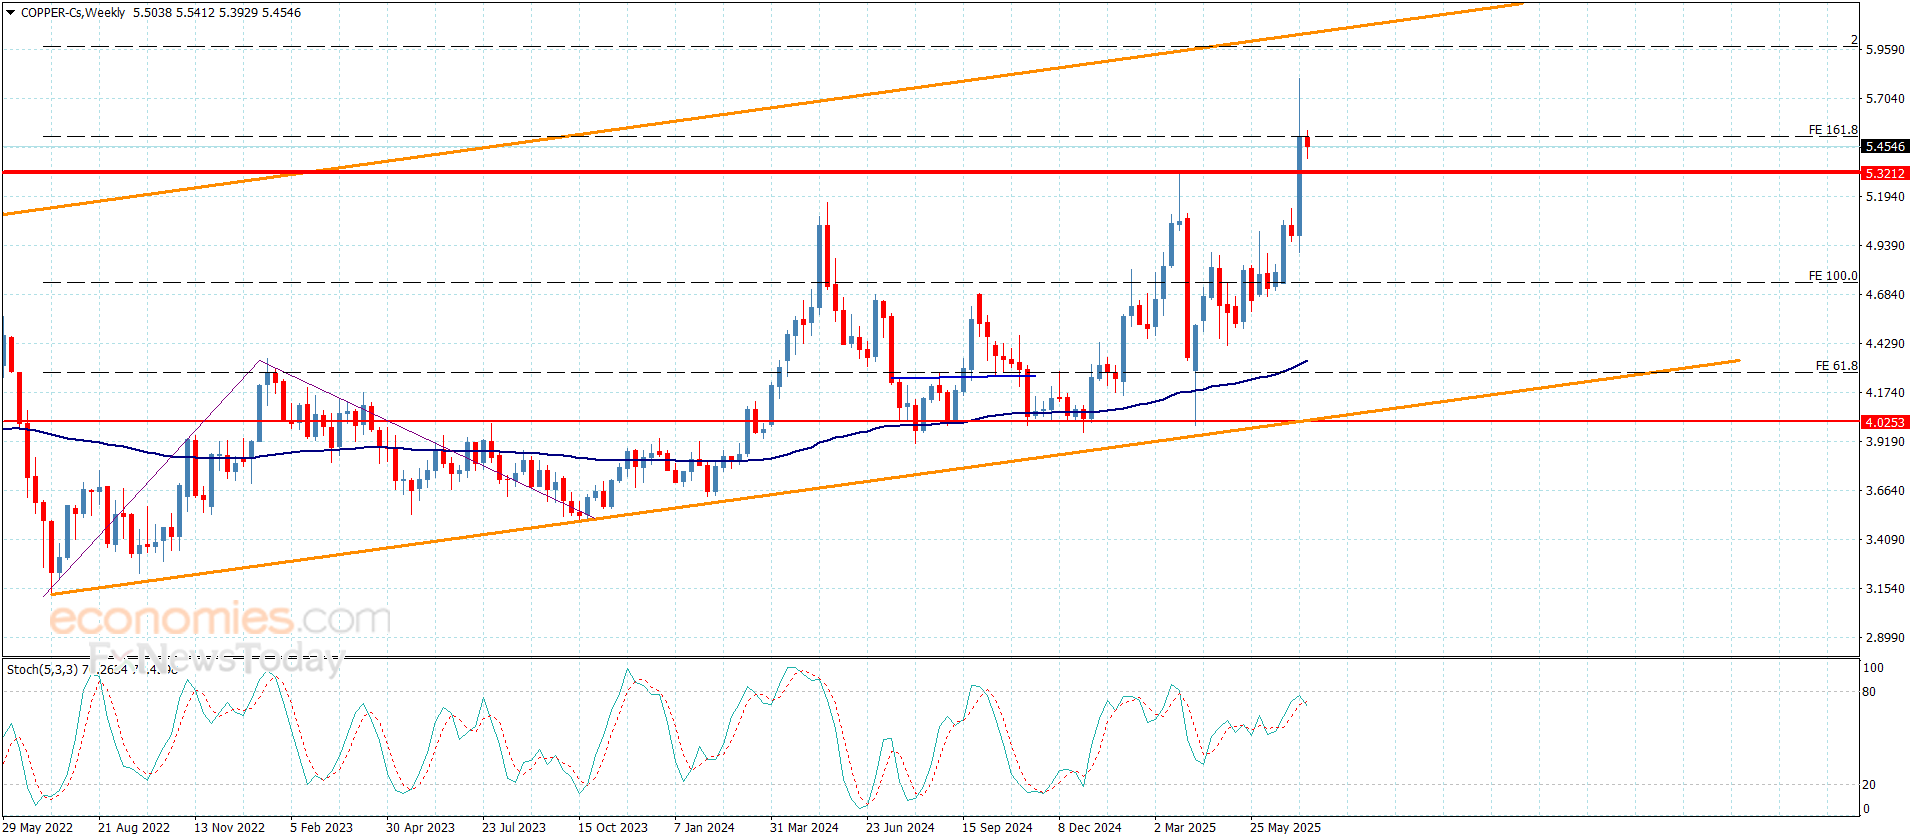
No news for copper price, it remains confined between $5.3200 support and $5.5100 level which represents an extra barrier against the bullish attempts, and the contradiction between the main indicators confirming delaying the bullish attempts, to recommend neutrality and wait for surpassing these levels to detect the expected targets in the near trading.
Trading success in surpassing the barrier and holding above it will reinforce the dominance of the bullish bias, which might target $5.6700, while breaking the support will force it to form bearish correctional waves, to expect reaching $5.1500 and $4.9800.
The expected trading range for today is between $5.3100 and $5.5100
Trend forecast: Neutral
Revolve Group’s stock price (RVLV) declined in latest intraday trading, under negative pressure from trading below the 50-day SMA. This drop positions the stock to potentially break a short-term upward correctional trend line, a scenario supported by negative signals starting to stream from the Stochastic after reaching extremely overbought levels — exaggerated relative to the stock’s movement.
Therefore we expect the stock to decline in upcoming trading, especially if it breaks the mentioned upward trend line, targeting the support level of $18.75.
Today’s price forecast: Bearish
Gold price hovers around $3,340, recovering from a fresh weekly low of $3,309.96. The FX board is all about United States (US) headlines and sentiment. The US Dollar (USD) traded with a firmer tone throughout the day, partially backed by comments from US President Donald Trump, hinting at trade deals with India and the Eurozone, and partially supported by upbeat macroeconomic figures.
Retail Sales in the US surged my more than anticipated in June, up 0.6% after falling by 0.9% in May and much better than the 0.1% advance anticipated. Additionally, Initial Jobless Claims in the week ended July 12 rose by 221K, beating the 235K expected. Finally, the Philadelphia Fed Manufacturing Survey improved to 15.9 in July from the -4 posted in June, much better than the -1 anticipated by market’s analysts.
The upbeat figures boosted Wall Street, with the three major indexes rallying, limiting USD demand in the second half of the day. At the same time, the XAU/USD pair got to bounce from the aforementioned low, amid speculative interest betting on higher highs ahead for the bright metal.
Meanwhile, speculative interest has set aside concerns about the Federal Reserve (Fed) autonomy, after US President Donald Trump poured could water on speculation he may replace Fed’s Chair, Jerome Powell, before the end of his term in May 2026.
Friday will bring the preliminary estimate of the July Michigan Consumer Sentiment Index, expected to have improved to 61.5 from the 60.7 posted in June.
The quick bounce in Gold despite the better mood suggests buyers are still willing to add on dip. The daily chart for the XAU/USD pair temporarily fell below the 38.2% retracement of the $3,452.51 – $3,247.83 decline at around $3,325, while sellers contained advances around the 50% retracement of the same decline at around $3,350. The same chart shows that the pair is currently a handful of bucks above a flat 20 Simple Moving Average (SMA), while the 100 and 200 SMAs extended their advances far below the current level. Technical indicators, in the meantime, diverge within neutral levels, failing to provide clear directional clues.
The near term picture shows the bullish potential is limited, as the pair would need to run past the next Fibonacci resistance, the 61.8% retracement at $3,374.56, to turn positive. The 4-hour chart shows a mildly bearish 20 SMA extends its slide below a flat 200 SMA, while technical indicators recovered from their early lows near oversold readings, but remain within negative levels.
Support levels: 3,325.00 3,311.70 3,295.50
Resistance levels: 3,350.18 3,374.56 3,390.10
July 17, 2025 – Written by David Woodsmith
STORY LINK Pound to Euro Forecast: Sell GBP/EUR Rallies says This Bank
The Pound to Euro exchange rate (GBP/EUR) spiked higher in response to the UK inflation data, but failed to hold the gains and traded around 1.1525, not far above the 3-month lows of 1.1500 posted on Tuesday.
Traders still expect a rate cut in August and are braced for a weak jobs report on Thursday while confidence in the UK bond market remains notably fragile.
ING commented; “A soft jobs print tomorrow should send EUR/GBP back above 0.870.” (GBP/EUR) sliding below 1.1500)
Goldman Sachs expects longer-term losses, but would prefer to sell GBP/EUR rallies rather than sell now; “we are more inclined to wait for better entry points before engaging with Sterling shorts.”
The headline UK inflation rate increased to 3.6% for June compared with consensus forecasts of an unchanged rate of 3.4% and the highest annual rate since January 2024.
From a global perspective, the inflation rate was also the highest in the G7 area.
Core inflation also increased to 3.7% from 3.5% and compared with expectations of no change.

The goods inflation rate increased to 2.4% from 2.0% with the services-sector rate unchanged at 4.7%.
There was upward pressure on transport prices for the month while food price inflation increased to 4.5%, the strongest reading since early 2024.
Paul Dales, chief UK economist at Capital Economics commented; “The UK does still have an inflation problem.”
Looking at trends in online data, Michael Metcalfe of State Street Markets is more confident over the outlook; “online prices suggest inflation pressures have already begun to subside in the first two weeks of July, which warns against reading too much into summer inflation strength seen so far.”
ING noted the persistence in services-sector inflation; “this latest data appears to set the bar fairly high for faster rate cuts. The fact that headline inflation is edging closer to 4% doesn’t help. BoE Chief Economist Huw Pill has recently spoken of internal research, which shows that inflation has a habit of becoming more entrenched when CPI reaches these levels.”
ING also noted that the position could still change quickly; “Thursday’s payroll data is absolutely key. If May’s shockingly bad figures aren’t revised up and/or if June’s numbers are as bad, that could be a catalyst for the Bank to rethink its current cautious approach to rate cuts. For now, though, we expect “gradual” cuts in August and November.”
According to Deutsche Bank’s chief UK economist Sanjay Raja; “Is an August rate cut in jeopardy? No, we don’t think so. There’s enough of a slowdown in GDP and the labour market to warrant a ‘gradual and careful’ easing of monetary policy.

He added; “But the onus now rests on the labour market to shape how far and how fast the MPC can cut this year and next.”
Reaction in the bond market will be monitored closely, especially as there has been upward pressure on long-term yields.
The 10-year yield increased to 4.68% in immediate reaction to the data before a retreat to 4.66%.
James Flintoft of AJ Bell commented; “The persistence of inflation above 3pc, well ahead of the Bank of England’s 2pc target, further highlights the risk that higher inflation is here to stay, and parts of the gilt market need to adjust.”
Higher yields could, in theory, underpin the Pound, but there will also be concerns that higher yields will be seen as a symptom of global markets losing confidence in UK bonds and undermine the Pound.
International Money Transfer? Ask our resident FX expert a money transfer question or try John’s new, free, no-obligation personal service! ,where he helps every step of the way,
ensuring you get the best exchange rates on your currency requirements.
TAGS: Pound Euro Forecasts
Despite the neediness of the EURJPY pair to positive momentum since yesterday, its positive stability above 171.75 confirms the stability of the bullish track, to increase the chances of reaching the initial main target at 173.40 and surpassing it will reinforce the chances for recording extra gains that might extend towards 173.85 and 174.40.
Notet that the price decline below 171.75 and providing bearish closes will increase the chances for activating the attempts of gathering the gains by forming bearish correctional waves, to expect targeting 171.10 level, reaching the support near 170.45.
The expected trading range for today is between 172.00 and 173.80
Trend forecast: Bullish