The main category of Forex News.
You can use the search box below to find what you need.
[wd_asp id=1]
The main category of Forex News.
You can use the search box below to find what you need.
[wd_asp id=1]
Welcome, my fellow traders! I have prepared a price forecast for the USCrude, XAUUSD, and EURUSD using a combination of the margin zones method and technical analysis. Based on the market analysis, I suggest entry signals for intraday traders.
The oil price is approaching support A of 83.32–82.92.
The article covers the following subjects:
Oil is approaching support A of 83.32–82.92. Once this zone is tested, consider long trades, with the first target at 85.14 and the second one around 87.36.
If the price breaks below the support A today, the correction will extend toward support B of 81.30–80.70, the trend boundary. Long trades can be considered near this zone.
Buy near support A of 83.32–82.92. TakeProfit: 85.14, 87.36. StopLoss: 81.86.
Yesterday, the gold price hit the Target Zone 3 of 4,698–4,677 within a short-term uptrend. However, the metal failed to break through this zone. Consequently, the price began to decline today, approaching support A of 4,594–4,583. Once this zone is tested, long trades can be considered, with the first target at 4,640 and the second one around 4,696.
The trend boundary is shifting to 4,542–4,527.
Buy near support A of 4,594–4,583. TakeProfit: 4,640, 4,696. StopLoss: 4,558.
The euro is correcting lower and nearing support A of 1.1627–1.1619. Once this zone is tested, long trades can be considered, with the first target at 1.1665 and the second at 1.1711.
If the price exceeds the 1.1711 level, the rally may continue toward the Target Zone 2 of 1.1761–1.1744. If the asset breaks below the support A, the correction may extend toward support B of 1.1585–1.1572.
Buy near support A of 1.1627–1.1619. TakeProfit: 1.1665, 1.1711. StopLoss: 1.1597.
Would you like to learn more about technical analysis methods and principles? Explore our comprehensive guide.
P.S. Did you like my article? Share it in social networks: it will be the best “thank you” 🙂
Useful links:
The content of this article reflects the author’s opinion and does not necessarily reflect the official position of LiteFinance broker. The material published on this page is provided for informational purposes only and should not be considered as the provision of investment advice for the purposes of Directive 2014/65/EU.
According to copyright law, this article is considered intellectual property, which includes a prohibition on copying and distributing it without consent.
– Written by
David Woodsmith
STORY LINK GBP/USD Forecast: Pound Eyes 1.37 as Dollar Risks Mount
The Pound to Dollar (GBP/USD) exchange rate maintained a firm tone on Tuesday, trading around 1.3630-1.3640 and holding close to Friday’s six-month high above 1.3670.
Pound Sterling has struggled to extend its advance, but the Dollar remains under pressure amid persistent concerns over US fiscal policy, trade tensions and the credibility of recent Treasury intervention in the bond market.
GBP/USD reached 1.3675 at the end of last week before correcting modestly, with the pair retaining a generally bullish technical tone.
On a short-term view, UoB sees scope for GBP/USD gains towards 1.3700, but added; “On the downside, if GBP breaks below 1.3585 it would mean that 1.3700 is out of reach.”
Scotiabank maintains a positive outlook on the Pound; “Underlying trend dynamics remain solidly bullish and, after a period of range trading and two tests of 1.3150, a sustained push above 1.3650/60 implies potential for an extension towards the 1.41 zone over the balance of the year.”
US policy developments remain a dominant influence on currency markets this week.
Get better rates and lower fees on your next international money transfer.
Compare TorFX with top UK banks in seconds and see how much you could save.
Trade tensions with Canada have intensified sharply following the collapse of negotiations.
Canada announced retaliatory tariffs on around $20bn of US goods on Tuesday, matching recent US tariffs dollar-for-dollar.
The measures cover hundreds of products and are due to take effect in September.
President Trump has also threatened to impose 50% tariffs on Canadian cars, trucks and automotive parts from January 2027, increasing concerns over disruption to highly integrated North American supply chains.
ING had commented; “With a new chapter in the US-Canada trade war opening up over the weekend, the question will be to what degree the new sanctions on Iran threaten US trade ties with China again.”
The bank added that a significant re-escalation in the tariff conflict would probably be negative for the Dollar.

US Treasury Secretary Scott Bessent also announced an expansion of sanctions against Iran on Monday.
The measures are intended to restrict Iran’s access to the global financial system and target economic activity supporting Tehran.
However, Washington stopped short of immediately applying the most severe measures against China, Iran’s largest energy customer, reducing fears of an abrupt escalation in US-China tensions.
The announcement produced only limited support for the Dollar.
Markets remain cautious over whether sanctions will materially alter Iran’s behaviour or instead increase geopolitical and energy-market risks.
Fiscal policy is also attracting increasing attention following last week’s Treasury intervention in the bond market.
The Treasury doubled the size of buybacks of longer-dated government securities after the 30-year yield climbed to its highest level since 2007.
Bessent said on Monday that regularly scheduled Treasury auctions would continue despite the larger buyback programme.
The strategy remains controversial.
Billionaire investor Stanley Druckenmiller criticised the intervention this week, arguing that Treasury bond buying risks undermining the credibility of the world’s largest government debt market.
Concerns have also intensified after total US government debt surpassed $40trn.
MUFG commented; “We await US Treasury Secretary Scott Bessent’s details on addressing concerns over the fiscal outlook in the US but we along with market participants are very sceptical of anything meaningful coming from an announcement.”
It added; “A failure to cap yields would be viewed as a policy misstep that would undermine investor confidence and hurt the dollar while steps to cap yields would also likely undermine the dollar.”
This potentially leaves the Dollar in a difficult position.
A renewed surge in long-term yields could revive concerns over US debt sustainability, while more aggressive Treasury intervention could encourage investors to reduce exposure to the currency.
Fed Chair Kevin Warsh’s Jackson Hole speech later this week is likely to become the next major test for GBP/USD.
The Federal Reserve remains caught between inflation that is still above target and a recent run of softer US employment, retail sales and inflation data.
Warsh will also be speaking against an increasingly sensitive political backdrop following Treasury efforts to contain long-term borrowing costs.
A hawkish speech could push Treasury yields higher and offer the Dollar some support, although another aggressive bond sell-off could revive broader concerns over US fiscal stability.
Conversely, a softer message would reinforce expectations that the Fed will leave rates unchanged in September and could push GBP/USD back towards 1.3675 and 1.3700.
A sustained break above 1.3700 would strengthen the bullish technical picture and bring the 1.3800 area into focus.
Initial support is located around 1.3585-1.3600, with a break below this region likely to undermine the current upward bias.
International Money Transfer? Ask our resident FX expert a money transfer question or try John’s new, free, no-obligation personal service! ,where he helps every step of the way,
ensuring you get the best exchange rates on your currency requirements.
TAGS: Pound Dollar Forecasts
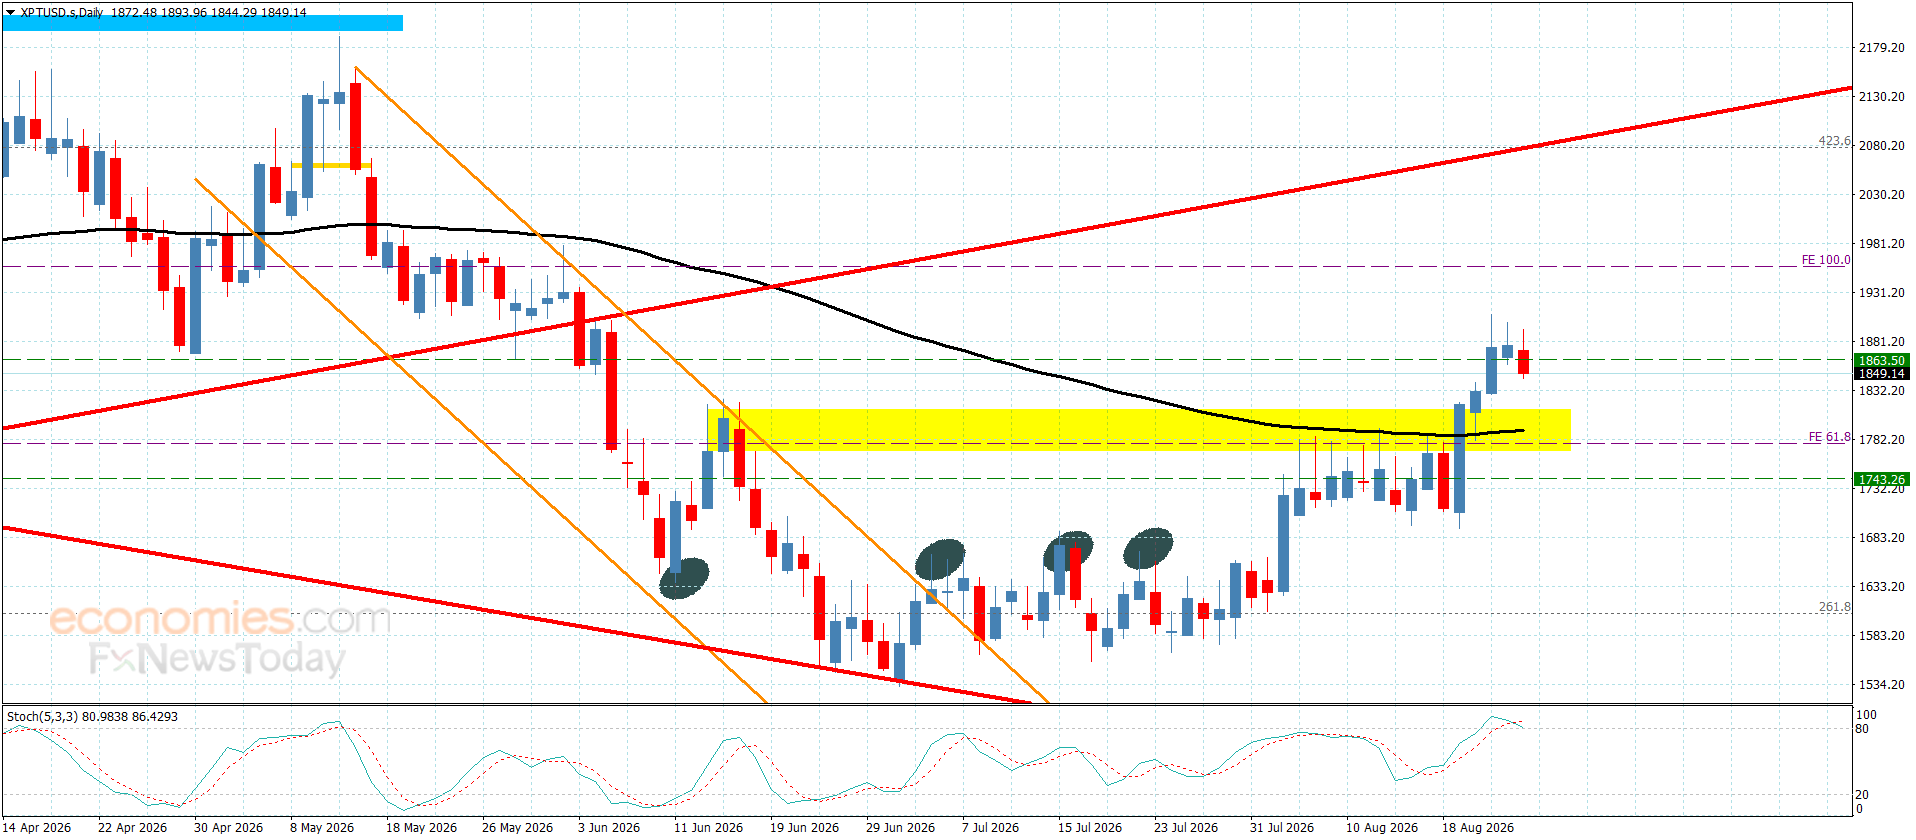
The platinum price failed to break through the barrier at $1905.00, forcing it to postpone its bullish attack and begin forming negative waves, as it is currently edging toward the $1,845.00 level.
Repeatedly holding below the barrier could increase the negative pressure on current trading, leading us to favor further temporary bearish attempts, which could target $1815.00 and $1780.00, respectively. However, a successful break above the barrier and holding above it would give the price a strong opportunity to achieve new gains, initially targeting $1955.00.
The expected trading range for today is between $1815.00 and $1890.00
Trend forecast: Bearish
USD/JPY Forecast: UOB Sees Yen Trading in 157.90–159.80 Range
United Overseas Bank (UOB) Group’s foreign exchange strategists indicated that the Japanese yen is likely to trade within a range of 157.90 to 159.80 against the US dollar in the near term, as of the latest market commentary.
According to UOB’s FX analysis, the USD/JPY pair is expected to consolidate within the 157.90–159.80 band, suggesting a lack of directional momentum in the immediate session. The forecast reflects a market where both upside and downside movements are limited by prevailing economic conditions and central bank policies.
The range-bound view comes amid ongoing expectations regarding the Bank of Japan’s monetary policy stance and the Federal Reserve’s interest rate trajectory. Traders are closely watching for any shifts in the interest rate differential between the US and Japan, which remains a key driver for the currency pair.
Several factors are contributing to the yen’s range-bound trading. Japan’s economic data, including inflation and wage growth, are being monitored for their potential impact on the Bank of Japan’s decision to adjust its ultra-loose monetary policy. On the other hand, US economic resilience and Fed officials’ comments on future rate cuts are shaping dollar strength.
Geopolitical events and risk sentiment also play a role, as investors often turn to the yen as a safe-haven currency during times of uncertainty. However, with no major catalysts on the horizon, the pair appears to be in a wait-and-see mode.
For traders, the identified range provides a clear framework for short-term strategies, such as selling near the upper boundary and buying near the lower boundary, while keeping stop-loss orders in place to manage risk. For investors and businesses with yen exposure, the range suggests a period of relative stability, but they should remain vigilant for breakouts driven by unexpected economic data or policy announcements.
In summary, UOB’s forecast for USD/JPY within 157.90–159.80 highlights a market awaiting fresh direction. With the Bank of Japan and Federal Reserve policies in focus, the pair is likely to remain range-bound until clearer signals emerge. Traders should monitor economic releases and central bank communications for potential breakout opportunities.
Q1: What is the significance of UOB’s USD/JPY forecast?
UOB’s forecast provides a technical range for traders, indicating where the pair is likely to trade in the near term, helping them make informed trading decisions.
Q2: What factors could break the yen out of this range?
Unexpected changes in US economic data, Federal Reserve policy shifts, or Bank of Japan actions could trigger a breakout from the 157.90–159.80 range.
Q3: How can traders use this range information?
Traders can implement range-bound strategies, such as buying near support at 157.90 and selling near resistance at 159.80, while using stop-loss orders to manage risk.
This post USD/JPY Forecast: UOB Sees Yen Trading in 157.90–159.80 Range first appeared on BitcoinWorld.
The shared currency registers minimal losses of 0.13% versus the US Dollar as EUR/USD fails to surpass 1.1700, exacerbating the drop towards the 1.1660 area, despite retaining its current neutral-to-upward bias.
The EUR/USD is poised to consolidate further, as price action has failed to extend the market structure of higher highs and higher lows. Momentum shifted bullish, as the Relative Strength Index (RSI) shifted overbought, an indication that bulls are in charge.
However, the path of least resistance for EUR/USD is for it to continue trading sideways.
For a bullish resumption, the first resistance for EUR/USD is 1.1700. A breach of the latter will expose the 1.1750 psychological level, followed by the May 6 high at 1.1795, ahead of 1.1800. On further strength, the next stop is the April 17 swing high of 1.1849.
On the downside, if EUR/USD dives below 1.1650, the next area of interest would become the 200-day Simple Moving Average (SMA) at 1.1631. Below this level lies the 1.1600 mark, followed by the 100-day SMA at 1.1574 and by 1.1500.
The table below shows the percentage change of Euro (EUR) against listed major currencies today. Euro was the strongest against the Canadian Dollar.
| USD | EUR | GBP | JPY | CAD | AUD | NZD | CHF | |
|---|---|---|---|---|---|---|---|---|
| USD | 0.13% | 0.07% | 0.08% | 0.57% | 0.29% | 0.32% | 0.17% | |
| EUR | -0.13% | -0.03% | -0.02% | 0.43% | 0.21% | 0.25% | 0.06% | |
| GBP | -0.07% | 0.03% | 0.00% | 0.49% | 0.21% | 0.30% | 0.06% | |
| JPY | -0.08% | 0.02% | 0.00% | 0.54% | 0.13% | 0.24% | 0.06% | |
| CAD | -0.57% | -0.43% | -0.49% | -0.54% | -0.36% | -0.19% | -0.42% | |
| AUD | -0.29% | -0.21% | -0.21% | -0.13% | 0.36% | 0.08% | -0.13% | |
| NZD | -0.32% | -0.25% | -0.30% | -0.24% | 0.19% | -0.08% | -0.23% | |
| CHF | -0.17% | -0.06% | -0.06% | -0.06% | 0.42% | 0.13% | 0.23% |
The heat map shows percentage changes of major currencies against each other. The base currency is picked from the left column, while the quote currency is picked from the top row. For example, if you pick the Euro from the left column and move along the horizontal line to the US Dollar, the percentage change displayed in the box will represent EUR (base)/USD (quote).
Domestic coffee prices today
Coffee prices today in the domestic market increased sharply in key areas. According to giacaphe. com, the average coffee price on August 25 was 97,600 VND/kg, an increase of 1,000 VND/kg compared to the previous session.
In Dak Lak, coffee prices were recorded at 97,500 VND/kg, an increase of 1,000 VND/kg.
In Lam Dong, coffee prices reached 97,000 VND/kg, an increase of 1,000 VND/kg. This is the lowest level among the surveyed areas.
In Gia Lai, coffee prices are at 97,500 VND/kg, an increase of 1,000 VND/kg.
The old Dak Nong area recorded a level of 97,700 VND/kg, an increase of 1,000 VND/kg. This is the highest level in today’s price list.
After a strong increase session, the price level has regained the area close to 98,000 VND/kg, but still lower than the area of 99,000-100,000 VND/kg previously recorded.
The USD/VND exchange rate according to Vietcombank was recorded at 25,920 VND/USD, an increase of 20 VND.
World coffee prices
In the world market, coffee prices increased sharply in the most recent session.
According to Barchart, the December 2026 Arabica contract closed the session up 19 US cents/lb, equivalent to 5.89%. In the same session, the September 2026 Robusta contract increased by 192 USD/ton, equivalent to 5.34%.
Barchart said coffee prices rose sharply in the session of August 24, in which Arabica rose to a 7.5-month high, and Robusta rose to a 1.5-week high. This development created significant support for domestic coffee prices in today’s session.
Coffee price assessment
Domestic coffee prices increased by 1,000 VND/kg in the context of a strong recovery in the world market. Notably, Robusta increased by more than 5% in the most recent session, which is a factor that has a more direct impact on purchasing prices in Vietnam.
According to Barchart, the increase in coffee prices is supported by slow harvest progress in Brazil. Cooxupe Cooperative said harvests reached 81.1% as of August 14, lower than 86.1% in the same period last year. Safras & Mercado also recorded Brazilian coffee harvests reaching 90% as of August 12, lower than 97% in the same period and the 5-year average of 94%.
Barchart also said that Arabica certified inventories on ICE fell to a 2.75-year low, which is a factor supporting the Arabica group. However, increased Robusta inventories are still factors that can curb Robusta’s upward momentum in subsequent sessions.
Domestically, according to the Ministry of Agriculture and Environment, in July, Vietnam exported about 147,600 tons of coffee, worth 639.5 million USD. Accumulated in the first 7 months of the year, coffee exports reached about 1.2 million tons, up 10.8% in volume but turnover decreased by 11.2%, to 5.45 billion USD. This development is mainly due to the average export price decreasing by 19.9% compared to the same period, down to 4,537 USD/ton.
Regarding the weather, the National Center for Hydro-Meteorological Forecasting said that on the day and night of August 25, the Central Highlands area will be sunny during the day, with showers and scattered thunderstorms in the late afternoon and night. The lowest temperature is 21-24 degrees Celsius, in some places below 20 degrees Celsius; the highest is 27-30 degrees Celsius, in some places above 31 degrees Celsius. In thunderstorms, there is a possibility of tornadoes, lightning and strong gusts of wind.
This season’s thunderstorms need to be monitored in terms of garden care, pest and disease prevention, and goods preservation. The risk of drought in the Central Highlands should not be interpreted in the direction of drought.
In the coming sessions, the diễn biến of Robusta London, Arabica New York, USD/VND exchange rate, inventory and demand for export purchases will continue to dominate the domestic price level.
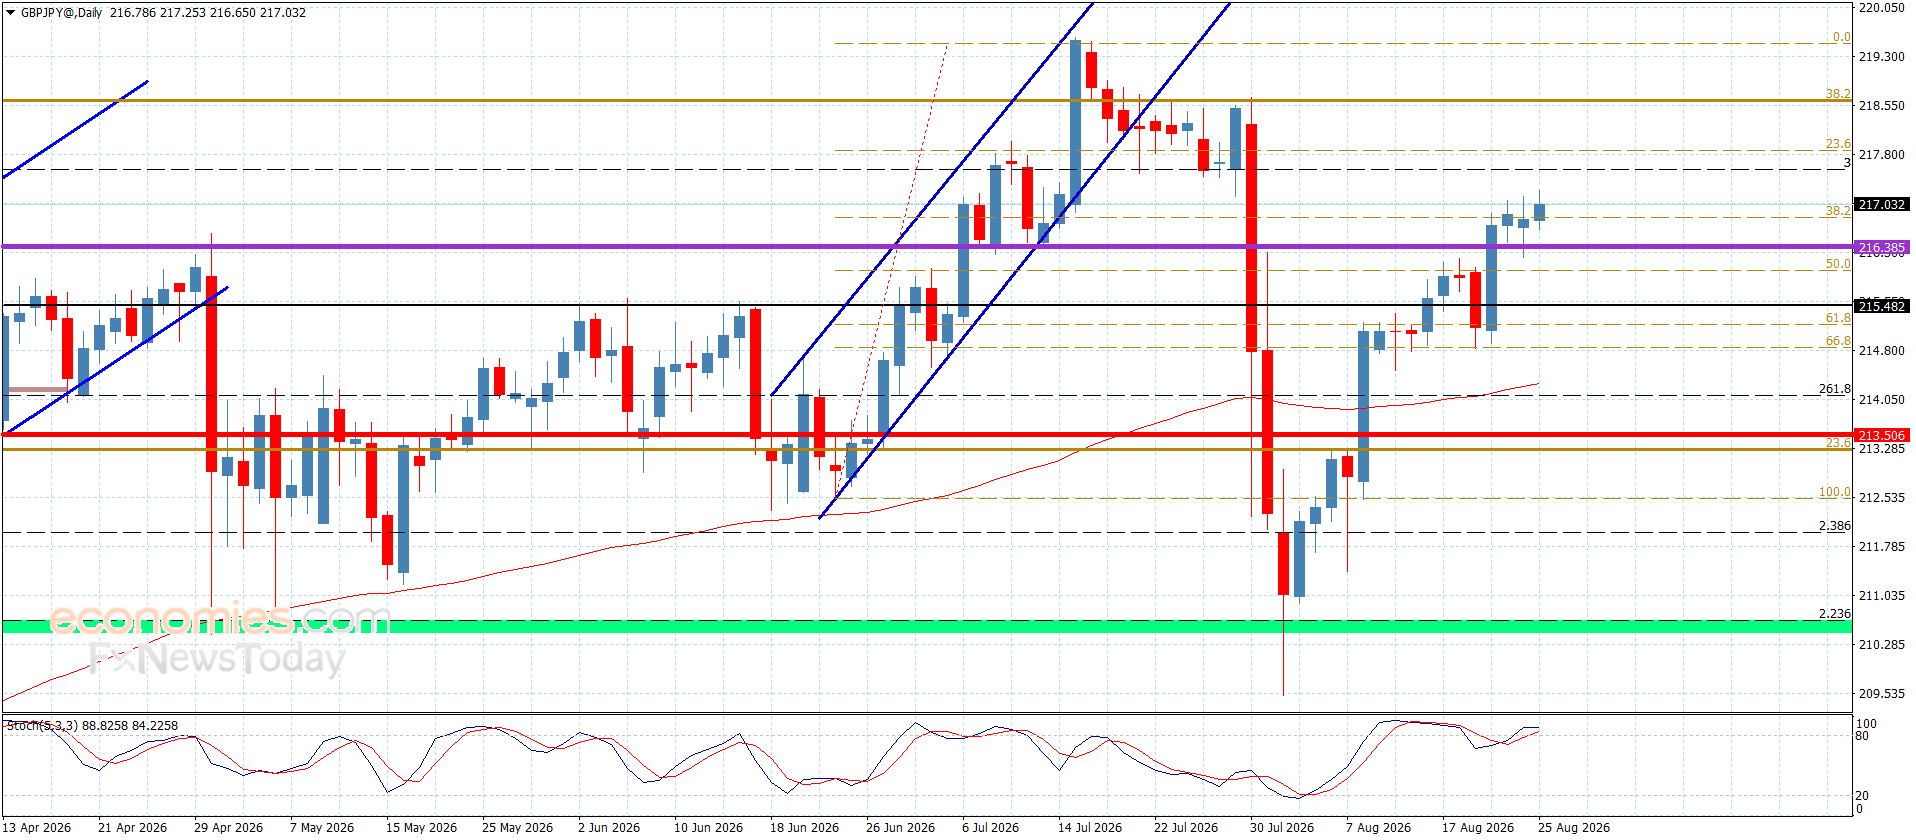
Despite the weakness in the pair’s trading yesterday, its repeated stability above the additional support level at 216.35 continues to support the bullish outlook. This morning, the pair has formed some positive waves, approaching the previously suggested first target at 217.35.
The price currently has little choice but to resume its bullish attempts, given that the main momentum indicators continue to provide positive signals. We expect the pair to be drawn soon toward the intraday barrier near 217.85, which represents the key level for determining the upcoming short- and medium-term targets.
A successful break above this barrier would open the way for further gains, potentially extending toward 218.65. On the other hand, failure to break through it would increase the chances of activating a bearish corrective path, pushing the price to break below 216.35 and head directly toward 215.55.
The expected trading range for today is between 216.50 and 217.85
Trend forecast: Bullish
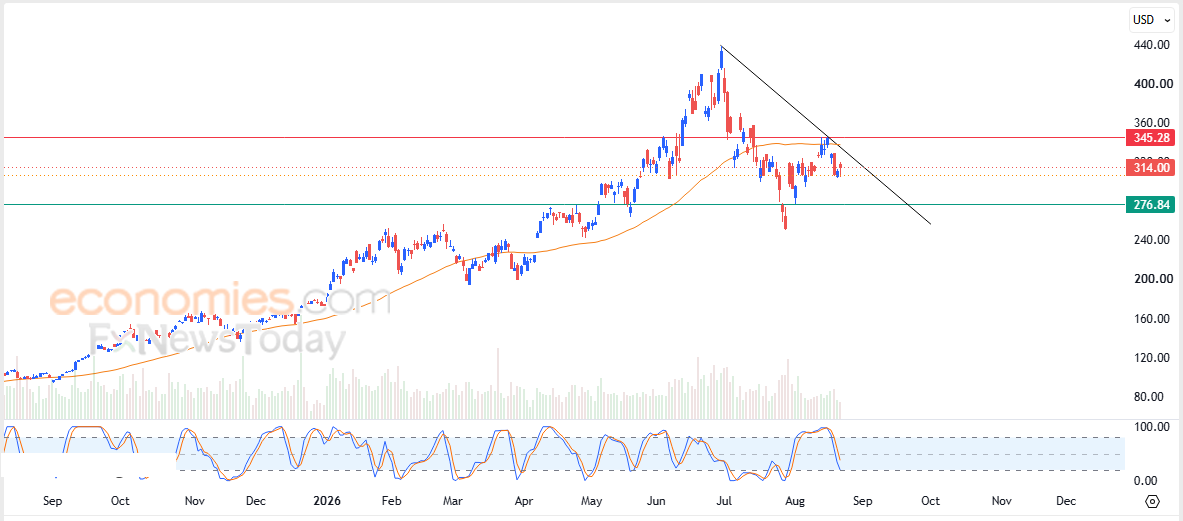
Lam Research Corporation (LRCX) edged higher in recent intraday trading, while negative pressure persists as the stock continues to trade below its 50-day Simple Moving Average (SMA), which is acting as dynamic resistance and reinforcing the stability of the short-term bearish corrective trend. Meanwhile, momentum indicators continue to generate bearish signals after previously reaching extremely overbought territory, adding further downside pressure to the stock.
Therefore, our outlook remains bearish for the stock’s upcoming trading sessions, as long as resistance at $345.00 remains intact. Under this scenario, the stock is expected to target the support level at $277.00.
Today’s price forecast: Bearish.
EUR/JPY appreciates after two days of gains, trading around 185.80 during the Asian hours on Tuesday. Technical analysis of the daily chart indicates the currency cross remains within the ascending channel pattern, signaling an ongoing bullish bias.
The EUR/JPY cross is maintaining a bullish near-term tone as it holds above both the nine-day and 50-day Exponential Moving Averages (EMAs). The 14-day Relative Strength Index (RSI) at 59.45 stays in positive territory, suggesting firm but not overstretched upside momentum.
The EUR/JPY cross may explore the upper boundary of the ascending channel around 187.70, followed by the all-time high of 187.95 set on April 17.
On the downside, the EUR/JPY cross may test the immediate support at the lower boundary of the ascending channel around 185.50, followed by the nine-day EMA of 185.07 and the 50-day EMA at 184.70. A break below this confluence support zone may cause the bearish reversal, potentially pressing the currency cross down toward its nine-month low of 179.37, recorded on August 3.
Strategists at Scotiabank observe that the recent Yen narrative is evolving, with markets moving away from the summer’s emphasis on official action. They note that “the market narrative appears to be shifting from the official intervention that dominated through much of the summer,” with participants “now tightening their focus on fundamentals into the September 18 BoJ meeting.” This refocusing on underlying drivers, rather than headline intervention risk, is increasingly shaping positioning in JPY ahead of the policy decision.
(The technical analysis of this story was written with the help of an AI tool. Know more.)
The table below shows the percentage change of Euro (EUR) against listed major currencies today. Euro was the strongest against the Japanese Yen.
| USD | EUR | GBP | JPY | CAD | AUD | NZD | CHF | |
|---|---|---|---|---|---|---|---|---|
| USD | 0.06% | 0.04% | 0.14% | 0.09% | 0.02% | 0.02% | 0.16% | |
| EUR | -0.06% | -0.02% | 0.11% | 0.03% | -0.04% | -0.07% | 0.10% | |
| GBP | -0.04% | 0.02% | 0.13% | 0.05% | -0.01% | -0.04% | 0.12% | |
| JPY | -0.14% | -0.11% | -0.13% | -0.07% | -0.14% | -0.17% | 0.00% | |
| CAD | -0.09% | -0.03% | -0.05% | 0.07% | -0.07% | -0.09% | 0.07% | |
| AUD | -0.02% | 0.04% | 0.00% | 0.14% | 0.07% | -0.02% | 0.10% | |
| NZD | -0.02% | 0.07% | 0.04% | 0.17% | 0.09% | 0.02% | 0.16% | |
| CHF | -0.16% | -0.10% | -0.12% | -0.00% | -0.07% | -0.10% | -0.16% |
The heat map shows percentage changes of major currencies against each other. The base currency is picked from the left column, while the quote currency is picked from the top row. For example, if you pick the Euro from the left column and move along the horizontal line to the US Dollar, the percentage change displayed in the box will represent EUR (base)/USD (quote).