The main category of Forex News.
You can use the search box below to find what you need.
[wd_asp id=1]
The main category of Forex News.
You can use the search box below to find what you need.
[wd_asp id=1]
Gold prices are rallying on Tuesday as traders digest remarks from policymakers currently gathered at the European Central Bank (ECB) forum in Portugal.
Focus has been on comments from Federal Reserve Chairman Jerome Powell, who has been facing increasing pressure from US President Donald Trump to reduce interest rates in July.
Despite Fed Chair Powell’s hawkish comments and better-than-expected US economic data, which have helped limit US Dollar losses, XAU/USD continues to trade around $3,350 at the time of writing.
Fed Powell’s comments included, “As long as the US economy is in solid shape, we think that the prudent thing to do is to wait and learn more and see what those effects might be.”
So far, Powell has adhered to the cautious script, but investors are aware that this could shift quickly if the data dictates otherwise.
Additionally, Powell stated that “It’s going to depend on the data, and we are going meeting by meeting,” Powell said. “I wouldn’t take any meeting off the table or put it directly on the table. It’s going to depend on how the data evolve.”
These comments suggest that the Fed is not rushing to cut rates, increasing the potential for a September cut. With the US ISM Manufacturing and JOLTs data beating expectations, a resilient US data remains supportive of a more data-dependent Fed, limiting US Dollar losses.
The focus on Tuesday was on the European Central Bank (ECB) Forum on Central Banking, currently underway in Sintra, Portugal. This rare convergence of the world’s top central bankers offers a critical opportunity for markets to assess the direction of global monetary policy.
ECB President Christine Lagarde, Bank of Japan (BoJ) Governor Kazuo Ueda, Bank of England Governor Andrew Bailey, and Federal Reserve Chair Jerome Powell are currently speaking on monetary policy.
The joint appearance is more than symbolic. Previous Forums have triggered coordinated messaging or revealed stark divergences in policy outlooks that have moved major asset classes, including Gold, currencies, and bonds.
With central banks navigating a delicate balance between inflation control and slowing growth, any nuance in today’s remarks could set the tone for the third quarter.
After falling to trendline support from the January low on Monday, failure to gain traction below $3,250 allowed bulls to regain control of the imminent trend. With the 50-day Simple Moving Average (SMA) currently providing support for the yellow metal at $3,320, XAU/USD is now threatening a break of the 20-day SMA at $3,351. The 23.6% Fibonacci retracement of the April low-high move provides an additional barrier of resistance near $3,371.
The Relative Strength Index (RSI) is currently at 52, rising back above the neutral zone and pointing higher. This suggests a modest bullish bias. With the Gold price threatening the 20-day SMA, a clear break of $3,351 and a move above $3,371 could see prices retest the major psychological level of $3,400.
Gold (XAU/USD) daily chart
If bullish momentum fades and prices slip below $3,300, the 38.2% Fibo level could come into play at $3,292, with a deeper pullback driving Gold to the midpoint of the April move at $3,328.
Pretty much every headline that you hear is how the US dollar is going to disappear. And my experience has been anytime you hear that, you’re getting close to the end. The Japanese yen is a little bit different, mainly due to the fact that the Bank of Japan is stuck with loose policy. Quite frankly, when you have a situation where people aren’t willing to step in and buy your bonds, that’s not a good look.
The Australian dollar initially fell, but it looks like it’s going to actually hold the 0.6550 level finally. This is an area that had been a little bit of a problem for some time. So, this is actually a really good sign for the Aussie. At this point in time, I suspect we will try to get to the 0.6650 level, but it’s probably going to be a grind just like the previous 200 pips. This is not a market that has anywhere to be anytime soon. It’s just gradually drifting higher, mainly, I suspect, because of US dollar weakness and not really anything to do with Australia itself. So, with this, I think you just have a grind, perhaps for another 100 pips before it’s all said and done.
For a look at all of today’s economic events, check out our economic calendar.
Important DisclaimersThe content provided on the website includes general news and publications, our personal analysis and opinions, and contents provided by third parties, which are intended for educational and research purposes only. It does not constitute, and should not be read as, any recommendation or advice to take any action whatsoever, including to make any investment or buy any product. When making any financial decision, you should perform your own due diligence checks, apply your own discretion and consult your competent advisors. The content of the website is not personally directed to you, and we does not take into account your financial situation or needs.The information contained in this website is not necessarily provided in real-time nor is it necessarily accurate. Prices provided herein may be provided by market makers and not by exchanges.Any trading or other financial decision you make shall be at your full responsibility, and you must not rely on any information provided through the website. FX Empire does not provide any warranty regarding any of the information contained in the website, and shall bear no responsibility for any trading losses you might incur as a result of using any information contained in the website.The website may include advertisements and other promotional contents, and FX Empire may receive compensation from third parties in connection with the content. FX Empire does not endorse any third party or recommends using any third party’s services, and does not assume responsibility for your use of any such third party’s website or services.FX Empire and its employees, officers, subsidiaries and associates, are not liable nor shall they be held liable for any loss or damage resulting from your use of the website or reliance on the information provided on this website.Risk DisclaimersThis website includes information about cryptocurrencies, contracts for difference (CFDs) and other financial instruments, and about brokers, exchanges and other entities trading in such instruments. Both cryptocurrencies and CFDs are complex instruments and come with a high risk of losing money. You should carefully consider whether you understand how these instruments work and whether you can afford to take the high risk of losing your money.FX Empire encourages you to perform your own research before making any investment decision, and to avoid investing in any financial instrument which you do not fully understand how it works and what are the risks involved.
The EURJPY pair didn’t move anything since yesterday, to notice its fluctuations in sideways range near 196.60 level, attempting to face the negativity of stochastic and finding an exit to resume the bullish attempts until reaching the resistance of the bullish channel at 170.40.
Therefore, we will return to prefer the bullish attempts in the current trading, depending on the stability of the price above 168.70 level, confirming the importance of monitoring its behavior after reaching the targeted resistance, which forms a main key to detect the main trend in the upcoming trading.
The expected trading range for today is between 168.70 and 170.40
Trend forecast: Bullish
Natural gas price lost the positive momentum yesterday, affected by stochastic stability below 50 level, forcing it to form bearish waves to settle near the support base at $3.460 level, to form strong and important resistance to detect the main trend in the upcoming trading.
The stability of the current support will reinforce the chances for regaining the bullish bias, to expect its rally towards $3.600, then attempts to reach the extra initial target at $3.830, while the continuation of the negative pressures and its decline below the current support will confirm its move to the bearish track, which forces it to suffer several losses by targeting $3.320 and $3.140 level.
The expected trading range for today is between $3.450 and $3.600
Trend forecast: Bullish
GBP/USD gathers bullish momentum following Monday’s choppy action and trades at its highest level since October 2021 above 1.3770. In the second half of the day, macroeconomic data releases from the US and comments from central bankers could drive the pair’s action.
The table below shows the percentage change of British Pound (GBP) against listed major currencies this week. British Pound was the strongest against the US Dollar.
| USD | EUR | GBP | JPY | CAD | AUD | NZD | CHF | |
|---|---|---|---|---|---|---|---|---|
| USD | -0.76% | -0.49% | -1.03% | -0.71% | -0.74% | -1.03% | -1.35% | |
| EUR | 0.76% | 0.24% | -0.24% | 0.04% | 0.00% | -0.26% | -0.60% | |
| GBP | 0.49% | -0.24% | -0.69% | -0.21% | -0.24% | -0.52% | -0.85% | |
| JPY | 1.03% | 0.24% | 0.69% | 0.31% | 0.33% | 0.04% | -0.28% | |
| CAD | 0.71% | -0.04% | 0.21% | -0.31% | -0.08% | -0.32% | -0.64% | |
| AUD | 0.74% | -0.00% | 0.24% | -0.33% | 0.08% | -0.28% | -0.61% | |
| NZD | 1.03% | 0.26% | 0.52% | -0.04% | 0.32% | 0.28% | -0.32% | |
| CHF | 1.35% | 0.60% | 0.85% | 0.28% | 0.64% | 0.61% | 0.32% |
The heat map shows percentage changes of major currencies against each other. The base currency is picked from the left column, while the quote currency is picked from the top row. For example, if you pick the British Pound from the left column and move along the horizontal line to the US Dollar, the percentage change displayed in the box will represent GBP (base)/USD (quote).
Following the previous week’s sharp decline, the US Dollar (USD) Index stays under bearish pressure early Tuesday, fuelling GBP/USD’s rally.
The risk-positive market atmosphere and increasing political pressure on the Federal Reserve (Fed) continue to weigh on the USD. White House press secretary Karoline Leavitt said late Monday that US President Donald Trump sent a handwritten note to Fed Chairman Jerome Powell, asking him to lower interest rates. She further noted that Trump believes interest rates should be lowered to about 1%.
Meanwhile, Bank of England (BoE) Governor Andrew Bailey reiterated on Tuesday that the path of interest rates will continue to be gradually downwards.
“The increase in uncertainty is coming through in terms of economic activity and growth,” Bailey added. “Businesses tell me they are putting off investment decisions.” Nevertheless, these comments failed to influence Pound Sterling’s valuation.
Later in the day, JOLTS Job Openings data for May and the ISM Manufacturing PMI data for June will be featured in the US economic calendar. The market reaction to these releases is likely to be straightforward and remain short-lived. In case both of these data offer positive surprises, the USD could stage a rebound and trigger a downward correction in GBP/USD.
Moreover, BoE Governor Bailey and Fed Chairman Powell will participate in a policy panel at the ECB Forum on Central Banking in Sintra, Portugal. In case Powell suggests that they are unlikely to consider a rate cut until September and continue to assess the impact of tariffs on inflation, the USD could stay resilient against its peers.
The Relative Strength Index (RSI) indicator on the 4-hour chart stays slightly above 70, suggesting that GBP/USD is about to turn technically overbought. On the upside, 1.3830 (upper limit of the ascending channel) aligns as an important resistance level before 1.3900 (static level, round level).
Looking south, the first support could be spotted at 1.3730 (20-period Simple Moving Average) ahead of 1.3700 (static level, round level) and 1.3670 (mid-point of the ascending channel).
The Pound Sterling (GBP) is the oldest currency in the world (886 AD) and the official currency of the United Kingdom. It is the fourth most traded unit for foreign exchange (FX) in the world, accounting for 12% of all transactions, averaging $630 billion a day, according to 2022 data.
Its key trading pairs are GBP/USD, also known as ‘Cable’, which accounts for 11% of FX, GBP/JPY, or the ‘Dragon’ as it is known by traders (3%), and EUR/GBP (2%). The Pound Sterling is issued by the Bank of England (BoE).
The single most important factor influencing the value of the Pound Sterling is monetary policy decided by the Bank of England. The BoE bases its decisions on whether it has achieved its primary goal of “price stability” – a steady inflation rate of around 2%. Its primary tool for achieving this is the adjustment of interest rates.
When inflation is too high, the BoE will try to rein it in by raising interest rates, making it more expensive for people and businesses to access credit. This is generally positive for GBP, as higher interest rates make the UK a more attractive place for global investors to park their money.
When inflation falls too low it is a sign economic growth is slowing. In this scenario, the BoE will consider lowering interest rates to cheapen credit so businesses will borrow more to invest in growth-generating projects.
Data releases gauge the health of the economy and can impact the value of the Pound Sterling. Indicators such as GDP, Manufacturing and Services PMIs, and employment can all influence the direction of the GBP.
A strong economy is good for Sterling. Not only does it attract more foreign investment but it may encourage the BoE to put up interest rates, which will directly strengthen GBP. Otherwise, if economic data is weak, the Pound Sterling is likely to fall.
Another significant data release for the Pound Sterling is the Trade Balance. This indicator measures the difference between what a country earns from its exports and what it spends on imports over a given period.
If a country produces highly sought-after exports, its currency will benefit purely from the extra demand created from foreign buyers seeking to purchase these goods. Therefore, a positive net Trade Balance strengthens a currency and vice versa for a negative balance.
Gold price has paused its recovery from monthly lows early Tuesday, as the US Dollar (USD) finds fresh demand while the market mood turns cautious.
Traders seem to resort to position adjustments on their USD shorts, bracing for US Federal Reserve’s (Fed) Chairman Jerome Powell’s appearance for fresh cues on the timing of the next interest rate cut.
Fed Chair Powell participates in a policy panel alongside other key central banks’ chiefs at the European Central Bank (ECB) Forum on central banking in Sintra on Tuesday.
Markets continue to price in a 20% chance of the Fed trimming rates this month while predicting a 77% probability of a rate cut in September.
If Powell once again signals prospects of weaker-than-expected inflation, it would ramp up the Fed’s easing bets, triggering a fresh leg down in the US Dollar.
The dovish tone could help the non-yielding Gold price recover further ground.
However, if Powell surprises with some hawkish or prudent remarks, it could double down on the recent Gold price downtrend.
Besides, the focus will be also on the US JOLTS Job Openings data and US trade talks as the July 9 deadline approaches.
The Greenback faced a double-whammy on Monday and hit over three-year lows against its major currency rivals.
Increased concerns over US fiscal health ahead of the Senate’s efforts to pass President Donald Trump’s ‘big, beautiful’ spending bill weighed heavily on the US Dollar.
Meanwhile, investors remained wary over the potential US trade deals with Japan and the European Union (EU), especially after Treasury Secretary Scott Bessent warned that countries could be notified of sharply higher tariffs despite good-faith negotiations.
Furthermore, the record-rally on Wall Street indices also hit the sentiment around the Greenback, allowing Gold price to stage a decent comeback on Monday.
Gold price tests the 50-day Simple Moving Average (SMA) at $3,320, having found support near the $3,250 psychological level on Monday.
On the road to recovery, Gold price recaptured the 38.2% Fibonacci Retracement (Fibo) level of the April record rally at $3,297 on a daily closing basis.
However, the 14-day Relative Strength Index (RSI) holds below the 50 level, raising doubts about the prospects of a sustained recovery from monthly troughs.
If Gold price settles Tuesday above the 50-day SMA at $3,320, the turnaround could gather strength toward the 21-day SMA at $3,350.
Further north, the 23.6% Fibo level of the same ascent at $3,377 will be challenged again.
On the flip side, acceptance below $3,297, the 38.2% Fibo level will open the door toward the monthly lows of $3,248.
Jerome H. Powell took office as a member of the Board of Governors of the Federal Reserve System on May 25, 2012, to fill an unexpired term. On November 2, 2017, President Donald Trump nominated Powell to serve as the next Chairman of the Federal Reserve. Powell assumed office as Chair on February 5, 2018.
Next release:
Tue Jul 01, 2025 13:30
Frequency:
Irregular
Consensus:
–
Previous:
–
Source:
Federal Reserve
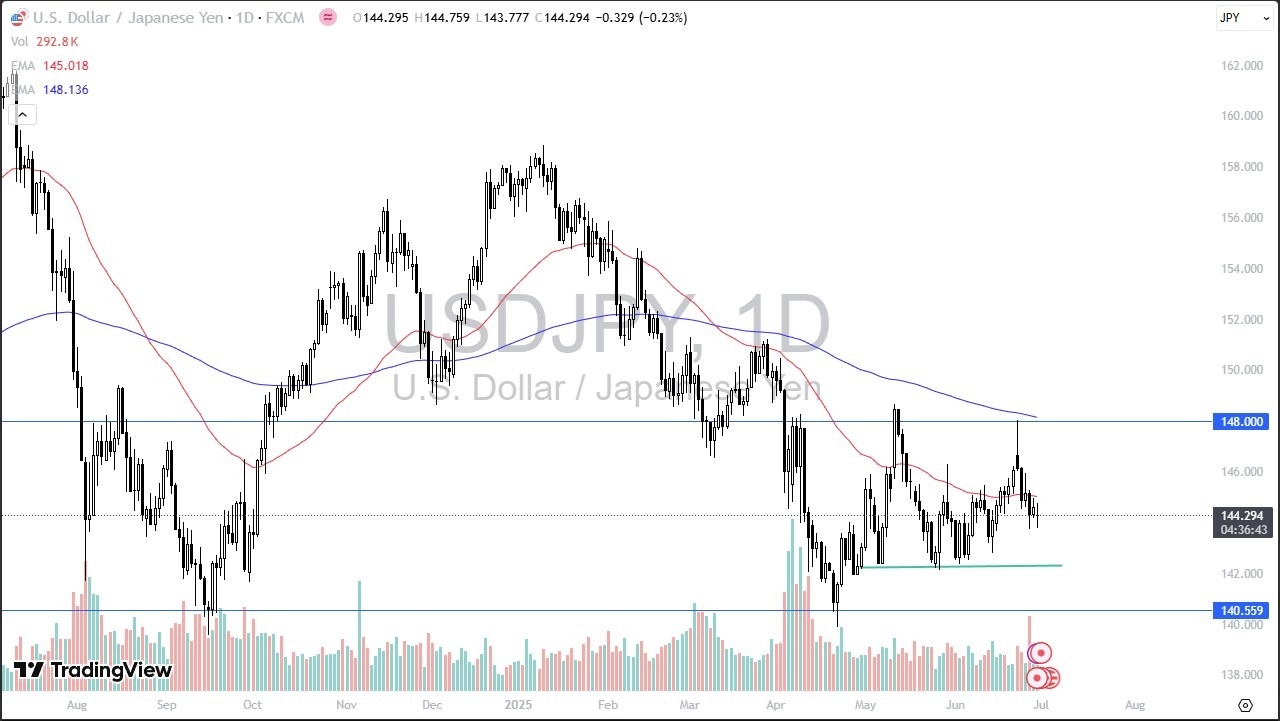
The Bank of Japan has a significant issue at the moment, due to the fact that there have been a lack of buyers in the Japanese Government Bond markets. This is a major problem for central banks and will almost always lead to more central bank buying of bonds, or what you probably know as “quantitative easing.” That’s an extreme simplification of what’s going on, but it is a very realistic example. By contrast, we have the Federal Reserve possibly cutting rates by 25 basis points in September, but that would still leave a major interest rate differential between these 2 currencies and make the dollar attractive against the yen itself.

The technical analysis at the moment is somewhat flat, as we have been trading in a range for a couple of months. The ¥142 level on the bottom is an area of significant support, while the ¥148 level has been significant resistance. It seems as if the market is very comfortable near the ¥145 level, which is also attracting the 50 Day EMA. As the market has gone into a multi-month consolidation area, this tells me that we could possibly be trying to form some type of bottoming pattern. This could take months though, which would not be unusual for this currency pair.
If we were to break above the ¥148 level, that opens up a move above the 200 Day EMA as well and perhaps should send the USD/JPY pair to the ¥150 level. On the other hand, if we were to break down below the ¥142 level, then I suspect we revisit the ¥140 level relatively quickly.
Want to trade our USD/JPY forex analysis and predictions? Here’s a list of forex brokers in Japan to check out.
Christopher Lewis has been trading Forex and has over 20 years experience in financial markets. Chris has been a regular contributor to Daily Forex since the early days of the site. He writes about Forex for several online publications, including FX Empire, Investing.com, and his own site, aptly named The Trader Guy. Chris favours technical analysis methods to identify his trades and likes to trade equity indices and commodities as well as Forex. He favours a longer-term trading style, and his trades often last for days or weeks.
Natural gas price lost the positive momentum yesterday, affected by stochastic stability below 50 level, forcing it to form bearish waves to settle near the support base at $3.460 level, to form strong and important resistance to detect the main trend in the upcoming trading.
The stability of the current support will reinforce the chances for regaining the bullish bias, to expect its rally towards $3.600, then attempts to reach the extra initial target at $3.830, while the continuation of the negative pressures and its decline below the current support will confirm its move to the bearish track, which forces it to suffer several losses by targeting $3.320 and $3.140 level.
The expected trading range for today is between $3.450 and $3.600
Trend forecast: Bullish
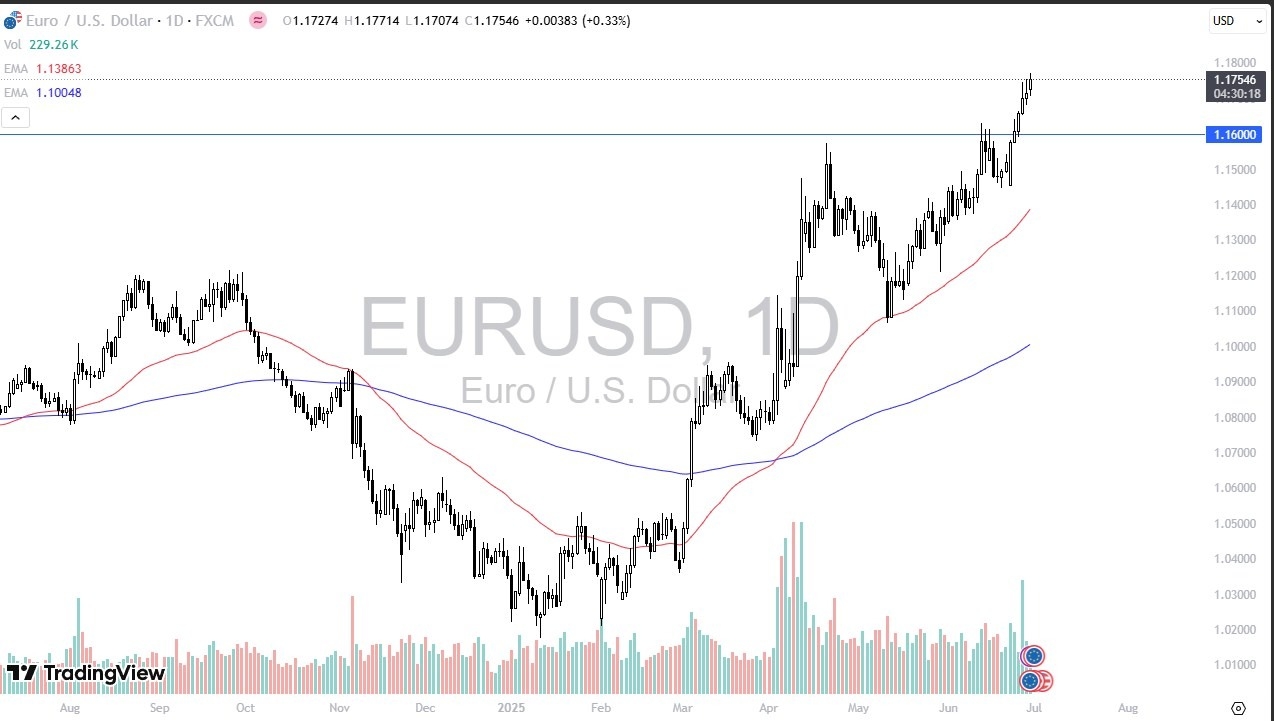
Perhaps we will turn around, but at this point in time you have to assume that there will be a bit of continuation overall, as the trend has clearly been positive for several months. If we do pull back from here, then we could look at a move to the 1.16 level, an area that previously had been a major resistance level. This could bring in a bit of “market memory” into the market, as traders would try to either cover short positions that has been wrong or perhaps try to join in on what had been a massive move higher.
The technical analysis for this market is obviously very bullish, but I also recognize that we have gotten a little ahead of ourselves. After all, the 50 Day EMA is all the way down at the 1.14 level but is rising to perhaps try to meet the rest of the market. On the other hand, if we continue to go higher, we will have to deal with the 1.18 level, which is a large, round, psychologically significant figure, and an area that would attract a certain amount of attention. Regardless, it does seem as if the euro is hell-bent on going much higher given enough time, so I think most traders will be looking at this through the prism of perhaps trying to find a little bit of value.
Over the longer term, a lot of this will come down to what the Federal Reserve does, and you should keep in mind that the Non-Foreign Payroll announcement comes out on Thursday this week instead of Friday, so it will compress some of the volatility as far as time is concerned. Whether or not that influences this pair remains to be seen, but now market participants have priced in a 95% probability that the Federal Reserve cut interest rates in September, driving this pair higher.
Ready to trade our EUR/USD daily forecast? Here’s a list of some of the top forex brokers in Europe to check out.
Christopher Lewis has been trading Forex and has over 20 years experience in financial markets. Chris has been a regular contributor to Daily Forex since the early days of the site. He writes about Forex for several online publications, including FX Empire, Investing.com, and his own site, aptly named The Trader Guy. Chris favours technical analysis methods to identify his trades and likes to trade equity indices and commodities as well as Forex. He favours a longer-term trading style, and his trades often last for days or weeks.