The main category of Forex News.
You can use the search box below to find what you need.
[wd_asp id=1]
The main category of Forex News.
You can use the search box below to find what you need.
[wd_asp id=1]
Platinum price attempted to renew the bullish attempts by its rally to $1377.40, but its neediness to the positive momentum that pushed it to form weak and sideways trading, to settle near $1342.00 approaching from the bullish channel’s support at $1330.00.
The current scenario depends on the strength of the mentioned support, its stability makes us expect forming bullish waves, to confirm its stability above $1366.00 level, to ease the mission of resuming the bullish attack and reaching the next target near $1400.00, while breaking the support and holding below it will confirm activating the attempts of gathering the gains by reaching $1303.00 initially followed by $1275.00.
The expected trading range for today is between $1330.00 and $1382.00
Trend forecast: Bullish
Platinum price attempted to renew the bullish attempts by its rally to $1377.40, but its neediness to the positive momentum that pushed it to form weak and sideways trading, to settle near $1342.00 approaching from the bullish channel’s support at $1330.00.
The current scenario depends on the strength of the mentioned support, its stability makes us expect forming bullish waves, to confirm its stability above $1366.00 level, to ease the mission of resuming the bullish attack and reaching the next target near $1400.00, while breaking the support and holding below it will confirm activating the attempts of gathering the gains by reaching $1303.00 initially followed by $1275.00.
The expected trading range for today is between $1330.00 and $1382.00
Trend forecast: Bullish
EUR/JPY depreciates after two days of gains, trading around 169.40 during the Asian hours on Tuesday. The technical analysis of the daily chart shows that the currency cross moves upwards within the ascending channel pattern, strengthening the bullish bias.
The 14-day Relative Strength Index (RSI) is positioned slightly below the 70 mark, strengthening the bullish sentiment. However, if the RSI breaks above the 70 mark, the pair would be in an overbought zone and indicate a downward correction soon. Additionally, the short-term price momentum is stronger as the EUR/JPY cross remains above the nine-day Exponential Moving Average (EMA).
On the upside, the EUR/JPY cross may test the 12-month high at 169.86, which was recorded on June 30. A successful breach above this level would reinforce the market bias and support the currency cross to test the upper boundary of the ascending channel around 171.40.
The initial support appears at the nine-day EMA of 168.77. Further declines would weaken the short-term price momentum and put downward pressure on the EUR/JPY cross to fall toward the ascending channel’s lower boundary around 167.00, followed by the 50-day EMA at 165.32.
A break below the 50-day EMA would dampen the medium-term price momentum and prompt the pair to navigate the region around the “throwback resistance” at 161.00
The table below shows the percentage change of Euro (EUR) against listed major currencies today. Euro was the weakest against the Japanese Yen.
| USD | EUR | GBP | JPY | CAD | AUD | NZD | CHF | |
|---|---|---|---|---|---|---|---|---|
| USD | -0.04% | -0.09% | -0.27% | 0.01% | 0.11% | 0.06% | -0.13% | |
| EUR | 0.04% | -0.03% | -0.31% | 0.06% | 0.25% | 0.09% | -0.07% | |
| GBP | 0.09% | 0.03% | -0.14% | 0.12% | 0.28% | 0.14% | -0.03% | |
| JPY | 0.27% | 0.31% | 0.14% | 0.32% | 0.36% | 0.30% | 0.14% | |
| CAD | -0.01% | -0.06% | -0.12% | -0.32% | 0.08% | 0.01% | -0.16% | |
| AUD | -0.11% | -0.25% | -0.28% | -0.36% | -0.08% | -0.15% | -0.32% | |
| NZD | -0.06% | -0.09% | -0.14% | -0.30% | -0.01% | 0.15% | -0.18% | |
| CHF | 0.13% | 0.07% | 0.03% | -0.14% | 0.16% | 0.32% | 0.18% |
The heat map shows percentage changes of major currencies against each other. The base currency is picked from the left column, while the quote currency is picked from the top row. For example, if you pick the Euro from the left column and move along the horizontal line to the US Dollar, the percentage change displayed in the box will represent EUR (base)/USD (quote).
The USD/JPY is struggling to hold key support on Monday as bullish momentum continues to fade, with both the daily and weekly charts indicating weakening trend strength.
After failing to sustain gains above the 148.00 level last week, the pair has drifted lower, moving back toward rising trendline support near the 144.00 handle.
This trendline currently aligns with the 23.6% Fibonacci retracement of the January–April decline at 144.37, a zone the pair is now trying to defend. Monday’s price action shows USD/JPY attempting to stabilize above this support area, but momentum indicators suggest the move may lack conviction.
At the time of writing, the pair is trading around 144.19. With momentum softening across various timeframes, technical signals continue to indicate a range-bound market, increasing the risk of a downside break if support levels fail to hold.
The Average Directional Index (ADX) on the daily timeframe has dropped to 10.87, indicating an extremely weak trend, even more so than the weekly reading. This further confirms that recent moves are corrective in nature rather than part of a sustained trend.
The Moving Average Convergence Divergence (MACD) on the daily chart is also flattening out, with histogram bars losing strength and the signal line turning sideways. This suggests a lack of bullish follow-through after last week’s failed breakout near 148.00.
USD/JPY daily chart
The weekly chart below illustrates how longer-term moving averages continue to act as dynamic support and resistance for USD/JPY price action.
Last week, the pair surged after climbing above both the 20-week Simple Moving Average (SMA) and the 38.2% Fibonacci retracement at 147.14.
A weaker Yen helped fuel the recovery, briefly lifting the pair to retest the psychological 148.00 level.
However, the move stalled as profit-taking and a lack of bullish follow-through triggered a reversal. This is reflected in the weekly candle’s thin upper wick, indicating fading buying interest near 148.00. The pair has since slipped back below the 20-week SMA, which now turns into resistance at 145.92.
Momentum signals are softening. The ADX closed last week pointing lower, indicating weakening trend strength. Meanwhile, the MACD remains below the zero line, suggesting any upside seen so far is likely corrective rather than the start of a sustainable uptrend.
USD/JPY weekly chart
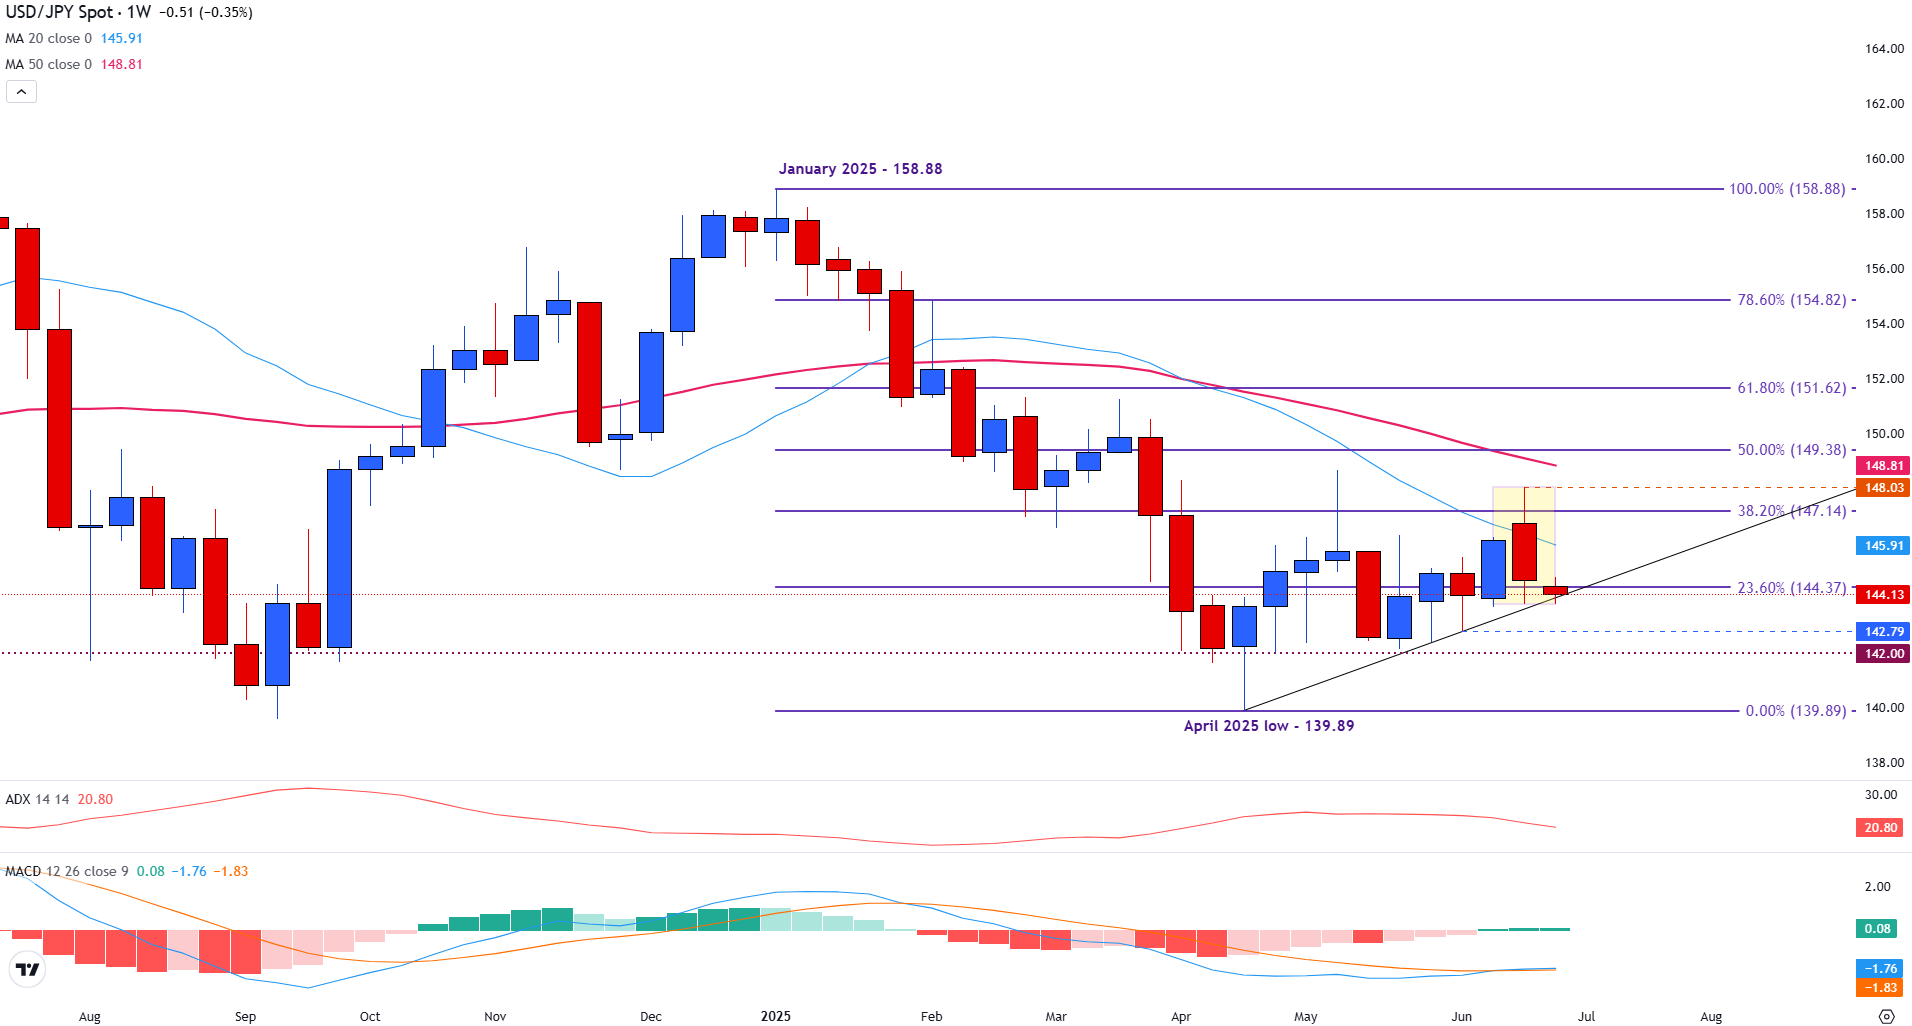
Looking to this week, Monday’s price action has pushed the pair toward rising trendline support, which is currently holding above the psychological 144.00 level.
A break below 144.00 could bring the 142.79 area into focus, the third touchpoint of the ascending trendline. Below that, 142.00 stands as another key psychological level, with a deeper move possibly exposing the 140.00 handle.
The April trendline remains a key short-term support structure; however, broader technical indicators suggest a cautious outlook. Both the 20 and 50-week SMAs continue to slope downward, reinforcing the longer-term bearish bias unless price can reclaim and hold above the 149.00 region.
The Japanese Yen (JPY) is one of the world’s most traded currencies. Its value is broadly determined by the performance of the Japanese economy, but more specifically by the Bank of Japan’s policy, the differential between Japanese and US bond yields, or risk sentiment among traders, among other factors.
One of the Bank of Japan’s mandates is currency control, so its moves are key for the Yen. The BoJ has directly intervened in currency markets sometimes, generally to lower the value of the Yen, although it refrains from doing it often due to political concerns of its main trading partners. The BoJ ultra-loose monetary policy between 2013 and 2024 caused the Yen to depreciate against its main currency peers due to an increasing policy divergence between the Bank of Japan and other main central banks. More recently, the gradually unwinding of this ultra-loose policy has given some support to the Yen.
Over the last decade, the BoJ’s stance of sticking to ultra-loose monetary policy has led to a widening policy divergence with other central banks, particularly with the US Federal Reserve. This supported a widening of the differential between the 10-year US and Japanese bonds, which favored the US Dollar against the Japanese Yen. The BoJ decision in 2024 to gradually abandon the ultra-loose policy, coupled with interest-rate cuts in other major central banks, is narrowing this differential.
The Japanese Yen is often seen as a safe-haven investment. This means that in times of market stress, investors are more likely to put their money in the Japanese currency due to its supposed reliability and stability. Turbulent times are likely to strengthen the Yen’s value against other currencies seen as more risky to invest in.
Last week’s higher swing low at $3.37 is more significant support as it is now part of the near-term bullish trend structure of higher swing lows. A bullish reversal following today’s low will be needed to further confirm trendline support. Support last week was seen at the confluence of the 61.8% Fibonacci retracement and the 200-Day MA. It was followed by a sharp one-day bullish reversal last Friday, which ended near the highs of the day.
The sharp bearish reversal seen today might be part of a shakeout before natural gas continues higher or the early signs of additional selling pressure that could lead to a break below the 200-Day MA and last week’s low. However, until then, the expectation is for the bullish trend to continue. It is contained within a long-term bull trend that began from the February 2024 lows.
On the daily chart, strength is not indicated until there is a rally above Friday’s high of $3.75. Therefore, given the relatively large price range for today, natural gas could trade within the range for a few days while it further test areas of dynamic support. Given its long-term nature and widespread use, the 200-Day is clearly showing support and needs to be respected unless signs of failure appear.
Finally, be aware that the swing low from last week is also a weekly low. Therefore, it takes on additional significance if it fails to hold. Moreover, that increases the chance for support to hold above that low as last week ended in a relatively strong position, in the top half of the week’s trading range.
For a look at all of today’s economic events, check out our economic calendar.
Moreover, Monay’s price action looks likely to complete a bullish hammer candlestick pattern. Notice that resistance at the high of the day of $36.23 was near the 20-Day MA. If the day ends with a hammer pattern and with the price of silver up for the day, there is the potential to reclaim the 20-Day line soon. An upside breakout will be triggered on a breakout above today’s high, which will also indicate a reclaim of the 20-Day line.
However, caution is warranted as silver is trading inside a small potential bull wedge consolidation pattern. The potential for follow-through in the near-term may be diminished due to activity within the pattern.
There is certainly the possibility that the wedge will continue to form as the pattern fills out. In addition to the wedge forming above an uptrend line, most of recent price action has occurred above a prior trend high at $34.87 as well. And last week a minimum 38.2% Fibonacci retracement of an internal upswing was completed, although support was found slightly above the $35.15 retracement level at $35.28.
Regardless of the potential for further consolidation within the confines of the wedge price structure, a bull breakout will trigger on a decisive rally above last week’s lower swing high of $36.84. That is also a weekly high. If the advance is subsequently confirmed by a breakout above the trend high of $37.32 from two weeks ago, it looks like silver could head towards the next higher target zone from $38.46 to $38.61.
For a look at all of today’s economic events, check out our economic calendar.
June 30, 2025 – Written by Tim Boyer
STORY LINK GBP/USD Forecast: Pound Steady vs Dollar as UK GDP in line with Expectations
The Pound Sterling trended mostly flat against the US Dollar on Monday despite the release of some optimistic UK GDP data.
The Pound (GBP) began the week on the back foot, weakening against several major peers despite the release of stronger-than-expected UK GDP figures.
According to the Office for National Statistics (ONS), the British economy expanded by 0.7% in the first quarter of 2025, a notable improvement from the previous 0.1% reading and in line with forecasts.
However, the Pound struggled to gain traction.
Markets appeared cautious in their response, with investors questioning whether the momentum can be sustained amid ongoing consumer spending pressures and signs of labour market weakness.
As a result, GBP was unable to fully capitalise on the economic rebound.
The US Dollar (USD) was largely directionless on Monday, trading in a narrow range against most major peers as a lack of high-impact US data left markets without a clear catalyst.

With little on the domestic economic calendar to drive movement, investors appeared hesitant to make bold moves on the ‘Greenback’ ahead of key releases due on Tuesday.
These include May’s JOLTs job openings and the ISM manufacturing PMI for June, both of which could significantly influence market sentiment if they deviate from expectations.
In the meantime, the absence of fresh drivers kept USD exchange rates mostly flat through Monday’s European session.
Looking ahead to Thursday’s European session, movement in the Pound to US Dollar (GBP/USD) exchange rate is likely to be driven by a mix of UK and US economic releases.
In the US, the spotlight will fall on the latest JOLTs job openings and ISM manufacturing PMI.
Job openings are forecast to decline, while the manufacturing index is expected to remain unchanged.
If both figures meet expectations or disappoint, the US Dollar could come under renewed pressure as signs of a cooling labour market and stagnant factory activity may weigh on Federal Reserve rate expectations.

Meanwhile, the UK will publish its finalised manufacturing PMI for June.
The index is set to be revised slightly higher, from 46.4 to 47.7. However, as the reading remains firmly below the 50 threshold that separates growth from contraction, the revision is unlikely to offer much meaningful support to Sterling.
International Money Transfer? Ask our resident FX expert a money transfer question or try John’s new, free, no-obligation personal service! ,where he helps every step of the way,
ensuring you get the best exchange rates on your currency requirements.
TAGS: Pound Dollar Forecasts
At 12:34 GMT, Natural Gas futures are trading $3.582, down $0.157 or -4.20%.
Last week, forecasts from NatGasWeather and Atmospheric G2 pointed to strong heat across the southern two-thirds of the U.S., with highs in the 80s to 100s across major East Coast cities and strong cooling demand into early July.
However, the current price retreat suggests traders are reassessing whether the heat will translate into sustained demand pressure, especially as lighter demand persists across the northern third of the country with milder temperatures.
Thursday’s EIA report added to bearish undertones, showing a +96 bcf injection, well above the consensus of +88 bcf and the five-year average of +79 bcf, signaling ample supply with inventories now 6.6% above the five-year seasonal average.
Additionally, easing geopolitical tensions, including the Israel-Iran ceasefire, have reduced near-term LNG disruption risks via the Strait of Hormuz, removing a bullish tailwind from the market.
Lower-48 dry gas production remains solid at 105.2 bcf/day (+1.7% y/y), while gas demand sits at 74.3 bcf/day (+1.0% y/y). LNG net flows to export terminals remain firm at 14.8 bcf/day (+7.4% w/w).
Tariffs bite, budget cracks widen, bets surge—pressure’s building and the technicals aren’t offering much relief.
With weakening through Q2 and falling correlations with traditional macro drivers, markets are clearly responding to a different set of influences. Once a pair heavily dictated by U.S.–Japan rate differentials and risk sentiment, that relationship has broken down, raising the prospect that political developments—especially those linked to U.S. trade and fiscal policy—may now be playing a greater role in driving price action.
This piece explores the fundamental backdrop heading into H2 2025, including the apparent correlation breakdown, the growing political overhang weighing on the , and what’s currently priced for both the Fed and BoJ in the second half of the year.
Source: TradingView
What stands out from the recent data is the clear deterioration in correlation strength between USD/JPY and its traditional macro inputs. Looking across one-month and one-quarter rolling periods, there’s been little to no sustained relationship between the pair and major variables including U.S. Treasury yields, yield differentials, and broader risk appetite proxies like the and .
This divergence suggests markets are no longer trading the pair in a textbook fashion. Despite notable moves in both and yields over Q2, the pair has largely ignored these developments. Even front-end spread changes, typically a reliable driver of JPY flows, have failed to generate a lasting directional pull. , often used as a barometer for inflation and demand dynamics, has also shown negligible influence.
Instead, what seems to be playing a larger role is a rotation out of the triggered by growing political unease. The turning point appears to have been the announcement of reciprocal tariffs on U.S. goods during U.S. ‘Liberation Day’ in early April. Since then, longer-dated U.S. Treasury yields have risen relative to short-dated yields, pointing to an increase in term premium—a concept that refers to the additional yield investors demand to hold longer-term bonds given uncertainty around inflation, growth, and fiscal stability.

Source: TradingView
Importantly, this lift in term premium hasn’t supported the dollar. If anything, it’s coincided with growing distrust from offshore buyers and rising concerns around the sustainability of the U.S. fiscal trajectory. Charts of real (inflation-adjusted) yields on 10 (blue line, 20 (red line), and (black line) show the shift clearly. With 20 and 30-year TIPS now well above levels seen for most of the past decade, it suggests investors are demanding greater compensation for long-term risk.
Given U.S. potential growth is broadly seen at around 1.8%, current real yields imply markets are not only reacting to fiscal slippage but also pricing in more structural uncertainty, likely tied to concerns about governance and trade under the Trump administration.
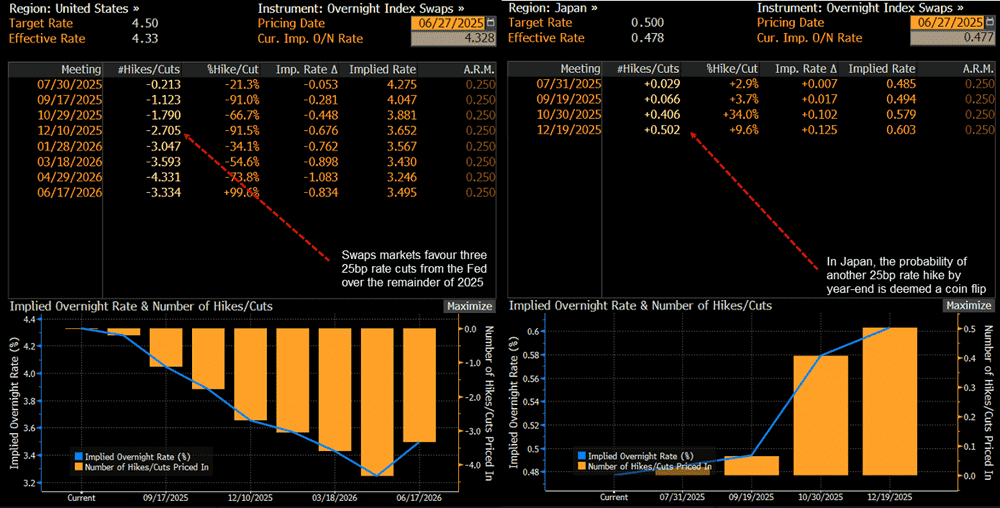
While real yields at the long end of the curve remain elevated, the front end has moved in the opposite direction. Softer inflation prints and patchy consumer data through Q2 have led to a modest dovish repricing for the Fed, with markets now assigning a decent chance to three rate cuts before the end of the year.
The bigger risk factor, though, stems from politics. Reports suggest President Trump may name a shadow Federal Reserve chair well in advance of Jerome Powell’s term expiring in May 2026.
The move could effectively undermine the independence of monetary policy in the near term, especially if the nominee signals a preference for materially lower interest rates. While Powell remains in place for now, markets are increasingly sensitive to any commentary suggesting a new policy direction is already taking shape behind the scenes.
In short, artificially low interest rates are no longer a hypothetical—they’re a growing market concern. For now, , , and remain key for the Fed outlook, but the political backdrop could start to exert more weight on rate expectations as H2 progresses.
Source: Bloomberg
The BoJ remains in a difficult position. Had it not been for growing trade-related uncertainty, there’s a strong case it would already have hiked beyond the 25bp move delivered in January. Inflation pressures remain firm, with annual core readings still sitting well above target. Domestic wage growth has also remained robust, supported by another round of sizeable increases struck earlier this year.
Despite that, markets remain hesitant to price in a meaningful tightening cycle, reflecting the cloud hanging over Japanese export prospects. With the reciprocal tariff extension set to expire on July 9, the key variable may be whether Japan can extract a deal from the U.S. that limits the damage to its auto sector.
At this stage, 25% tariffs on Japanese car imports remain in place, and without movement there, the BoJ may be reluctant to hike again. A global slowdown triggered by retaliatory trade actions would quickly reverse progress made on domestic inflation.
Still, markets remain split, with current pricing assigning roughly a 50/50 chance of a second rate hike before year-end. Should the trade overhang lift—or a deal be struck that shields Japan’s key export sectors—the BoJ may feel more confident acting again. That could reintroduce rate differentials as a driver of USD/JPY, but we’re not there yet.
Source: TradingView
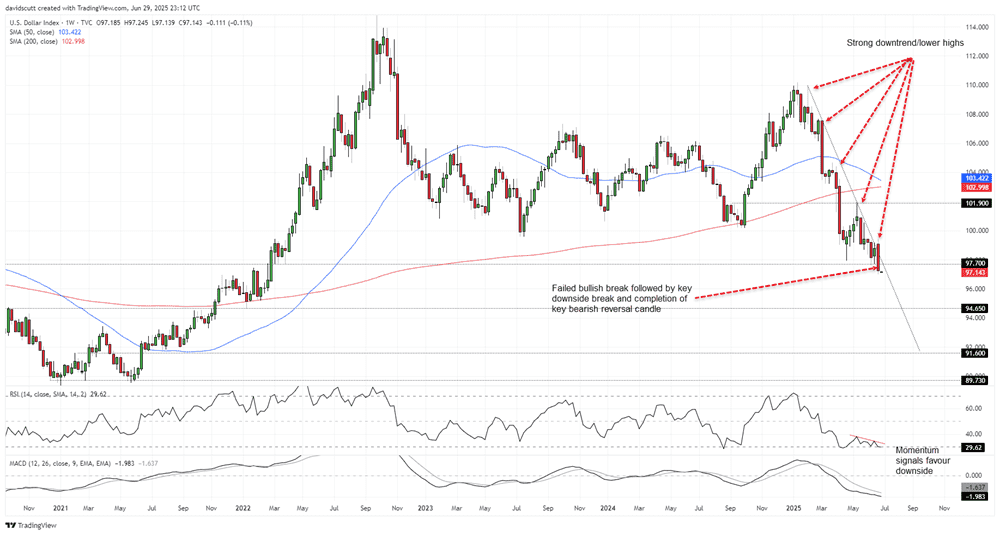
The (DXY) has been under sustained pressure since reciprocal tariff rates were announced on U.S. Liberation Day, printing a string of lower highs and lower lows within a broader downtrend on the weekly timeframe. With a bearish key reversal candle printing in the last full week of Q2—sending the DXY tumbling through support at 97.70—it signals the dollar could lose even more ground in the early stages of H2.
Momentum indicators bolster this view with RSI (14) trending lower while sitting in deeply negative territory. MACD is doing the same, confirming the overwhelming bearish signal that favours downside over upside.
With the DXY trading below 97.70, the next downside levels to watch include 94.65 and 91.60. 97.70 may now revert to acting as resistance, with 100 and 101.90 other topside levels of note.
Source: TradingView
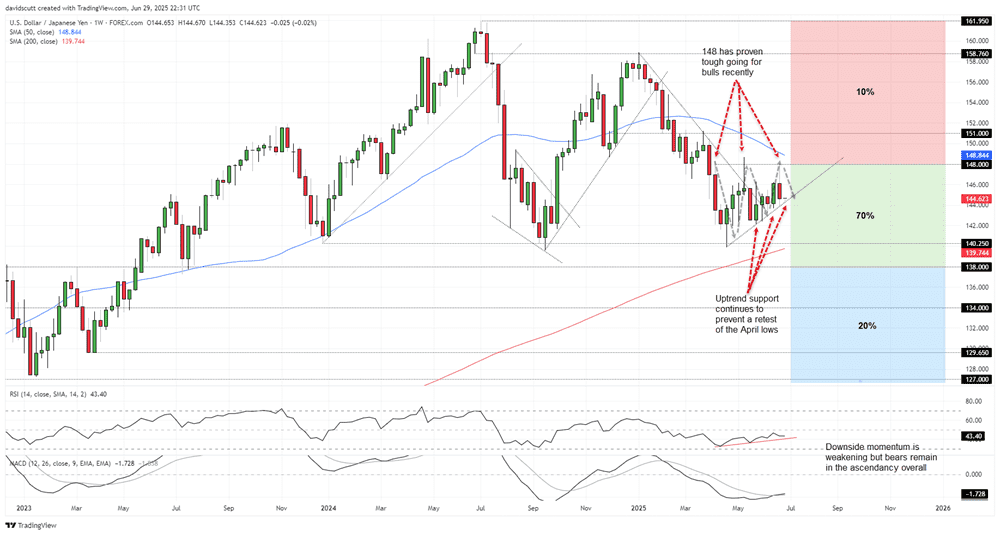
While USD/JPY trades lower than when the Q2 outlook was completed, the story over recent months has been one of modest upside with support running from the April lows continuing to repel bearish moves in May and June. On the topside, sellers have been parked above 148, resulting in violent downside moves, including in late June. That price action may be informative as to what direction USD/JPY is likely to break from the ascending triangle it trades in.
Even though momentum indicators like RSI (14) and MACD are signalling that selling pressure is ebbing—not increasing—downside risks remain tilted lower entering H2, keeping the risk of a potential retest of support starting from 140.25 on the table.
Should we see a weekly close beneath 140.25, it would increase the risk of a move towards major support at 138.00. Below, 134.00, 129.65 and 127.00 are the levels to watch. Should sellers parked between 148.00–70 be eventually overrun, resistance levels of note include 151.00 and 153.38.
The colour-coding signifies the potential ranges where USD/JPY may finish 2025, along with an assigned probability of each occurring as marked. The green zone between 148.00 on the topside and 138.00 on the downside is favoured at 70%, underpinned by the belief that while broader USD pressure is likely to persist, in the absence of a major U.S. market meltdown that sparks major carry trade unwind or significant economic downturn (both of which screen as unlikely over the medium term), a venture into the blue zone is deemed low probability at just 20%.
The implied probability of a push above 148 is even lower at just 10%, likely requiring a combination of policy inertia from the Fed, a positive resolution to trade and geopolitical risks, along with booming financial markets. Such a backdrop comes across as more akin to wishful thinking rather than plausible.
Important DisclaimersThe content provided on the website includes general news and publications, our personal analysis and opinions, and contents provided by third parties, which are intended for educational and research purposes only. It does not constitute, and should not be read as, any recommendation or advice to take any action whatsoever, including to make any investment or buy any product. When making any financial decision, you should perform your own due diligence checks, apply your own discretion and consult your competent advisors. The content of the website is not personally directed to you, and we does not take into account your financial situation or needs.The information contained in this website is not necessarily provided in real-time nor is it necessarily accurate. Prices provided herein may be provided by market makers and not by exchanges.Any trading or other financial decision you make shall be at your full responsibility, and you must not rely on any information provided through the website. FX Empire does not provide any warranty regarding any of the information contained in the website, and shall bear no responsibility for any trading losses you might incur as a result of using any information contained in the website.The website may include advertisements and other promotional contents, and FX Empire may receive compensation from third parties in connection with the content. FX Empire does not endorse any third party or recommends using any third party’s services, and does not assume responsibility for your use of any such third party’s website or services.FX Empire and its employees, officers, subsidiaries and associates, are not liable nor shall they be held liable for any loss or damage resulting from your use of the website or reliance on the information provided on this website.Risk DisclaimersThis website includes information about cryptocurrencies, contracts for difference (CFDs) and other financial instruments, and about brokers, exchanges and other entities trading in such instruments. Both cryptocurrencies and CFDs are complex instruments and come with a high risk of losing money. You should carefully consider whether you understand how these instruments work and whether you can afford to take the high risk of losing your money.FX Empire encourages you to perform your own research before making any investment decision, and to avoid investing in any financial instrument which you do not fully understand how it works and what are the risks involved.