The main category of Forex News.
You can use the search box below to find what you need.
[wd_asp id=1]
The main category of Forex News.
You can use the search box below to find what you need.
[wd_asp id=1]
Gold price is finding fresh buyers near the weekly low of $3,363 early Thursday amid renewed Middle East tensions, as markets look past the US Federal Reserve’s (Fed) hawkish hold policy decision.
Risk sentiment takes a hit in Asian trading on Thursday after several media outlets reported that US is considering an attack on Iran as early as this weekend, with US President Donald Trump particularly weighing strikes on Iran’s heavily fortified Fordow nuclear facility.
The potential involvement of the US military against Iran could deepen the Middle East conflict, translating into a wider regional war.
These reports come after Iran’s Supreme Leader Ayatollah Ali Khamenei warned on Wednesday that any military involvement by the Americans would cause “irreparable damage to them,” while refusing to surrender.
Renewed Middle East concerns sag investors’ confidence, reviving the safe-haven appeal of Gold price. However, Gold buyers seem to struggle amid resurgent demand for the US Dollar (USD) as another safety bet.
The Greenback builds on the previous day’s upswing, helped by the Fed’s patient stance and hints of higher inflation coming.
The US central bank maintained policy rates in the range of 4.25%-4.5% as widely expected while keeping the projections for two interest rate cuts this year intact.
However, it trimmed expectations for further cuts in 2026 and 2027. The Fed downgraded growth forecast while revising higher inflation outlook.
Amid persistent trade and geopolitical uncertainties, the Fed flagged upside risks to inflation, which prompted markets to perceive the decision as slightly hawkish.
The non-interest-bearing
Gold price breached the critical support at $3,377 and closed below that level on Wednesday, in the aftermath of the Fed’s decision.
Looking ahead, the Juneteenth holiday in the United States (US) could cause thin liquidity conditions, exaggerating the Gold price movement.
Traders will keep a close watch on the developments surrounding the Middle East conflict for fresh trading directives in Gold price.
Technically, the bullish bias remains intact for Gold price as the 14-day Relative Strength Index (RSI) holds above the midline, currently near 55.
Gold price needs to recapture the strong resistance now support at $3,377, the 23.6% Fibonacci Retracement (Fibo) level of the April record rally, on a sustained basis for a fresh upside.
The next relevant hurdle is aligned at the $3,400 mark, above which the static resistance at $3,440 will be tested.
Buyers will then take on the two-month highs of $3,453.
On the flip side, if Gold price fails to hold onto the rebound, sellers will likely jump back.
The immediate downside cushion is seen at the 21-day Simple Moving Average (SMA) at $3,348.
Further south, the 50-day SMA at $3,308 will be put to the test.
Gold has played a key role in human’s history as it has been widely used as a store of value and medium of exchange. Currently, apart from its shine and usage for jewelry, the precious metal is widely seen as a safe-haven asset, meaning that it is considered a good investment during turbulent times. Gold is also widely seen as a hedge against inflation and against depreciating currencies as it doesn’t rely on any specific issuer or government.
Central banks are the biggest Gold holders. In their aim to support their currencies in turbulent times, central banks tend to diversify their reserves and buy Gold to improve the perceived strength of the economy and the currency. High Gold reserves can be a source of trust for a country’s solvency. Central banks added 1,136 tonnes of Gold worth around $70 billion to their reserves in 2022, according to data from the World Gold Council. This is the highest yearly purchase since records began. Central banks from emerging economies such as China, India and Turkey are quickly increasing their Gold reserves.
Gold has an inverse correlation with the US Dollar and US Treasuries, which are both major reserve and safe-haven assets. When the Dollar depreciates, Gold tends to rise, enabling investors and central banks to diversify their assets in turbulent times. Gold is also inversely correlated with risk assets. A rally in the stock market tends to weaken Gold price, while sell-offs in riskier markets tend to favor the precious metal.
The price can move due to a wide range of factors. Geopolitical instability or fears of a deep recession can quickly make Gold price escalate due to its safe-haven status. As a yield-less asset, Gold tends to rise with lower interest rates, while higher cost of money usually weighs down on the yellow metal. Still, most moves depend on how the US Dollar (USD) behaves as the asset is priced in dollars (XAU/USD). A strong Dollar tends to keep the price of Gold controlled, whereas a weaker Dollar is likely to push Gold prices up.
The EURJPY pair recorded some extra gains by hitting 167.60 level, which forces it to form a temporary correctional rebound, affected by a stochastic attempt to exit the overbought level, providing chances for catching its breath and gathering the gains by reaching 166.70.
The price keeps providing mixed trading, but its repeated stability within the bullish channel’s levels and forming extra support at 166.00 level, so these factors make us keep the main bullish suggestion, which might target 168.00 level in the near period trading reaching the resistance level at 168.90.
The expected trading range for today is between 165.95 and 167.45
Trend forecast: Fluctuated within the bullish track
So far, bullish momentum has improved following the breakout as indicated by the long green candles the past two days. The next target zone is rapidly coming into sight, ranging from $4.08 to $4.17. It includes the completion of two rising ABCD patterns and a 61.8% Fibonacci retracement. Nonetheless, a more significant price level is up at $4.25, as it is a lower swing high that established the right shoulder of a recent head and shoulders topping pattern.
Reclaiming that price level would trigger a bullish reversal signal as the price structure of the prior downtrend would be violated. A daily close above $4.25 would increase the chance of natural gas rising above $4.90, the 2025 high. If that price level can be exceeded, then there are two measurements pointing to a price zone from $4.35 to $4.37, as the next target.
A rising parallel trend channel is shown on the chart with the low of channel established from two recent swing lows (A, C). Since natural gas has been rising from the lower channel line, there is the potential that it could eventually reach the top line before the current portion of rally is complete. That possibility increases the chance that the $4.35 price zone might be reached, as well as the 78.6% retracement at $4.46. Notice that the lower target would be hit before natural gas reached the top channel line.
It is also interesting to note that the long-term 200-Week MA, now at $3.93, was reclaimed this week. Since the bearish trigger in early-April, natural gas has traded below the 200-Week line. There was an attempt to hold a breakout above that line starting in December, but it failed and led to the recent bearish correction. Prior to December, natural gas traded below the 200-Week line since January 2023. So, another reclaim could set the stage for a successful breakout.
For a look at all of today’s economic events, check out our economic calendar.
Spot Gold hovers around $3,390 a troy ounce on Wednesday, unable to attract speculative interest ahead of the United States (US) Federal Reserve (Fed) monetary policy announcement.
Still, the bright metal remains afloat amid global tensions. Concerns revolve around trade talks and the Middle East crisis, with no progress at any front. On the one hand, US President Donald Trump “complained” about tough negotiations with the European Union and Japan. On the other hand, tit-for-tat missile attacks between Iran and Israel entered their sixth consecutive day, with no signs of de-escalation.
The Fed is widely anticipated to keep interest rates on hold, with the focus on the Summary of Economic Projections (SEP) and Chairman Jerome Powell’s press conference. Policymakers will deliver fresh growth, inflation and employment expectations, alongside their estimate on future interest rate cuts. Currently, the latest SEP indicates that Fed officials are still aiming for two cuts in 2025. Any change in such perspective could have a wild impact on the US Dollar (USD).
The daily chart for the XAU/USD pair shows it failed to attract investors for a second day in a row. Also, technical indicators remain well above their midlines, although without directional strength. Finally, XAU/USD develops above all its moving averages, with the 20 Simple Moving Average (SMA) heading marginally higher at around $3,347.10 while holding far above bullish 100 and 200 SMAs.
The near-term picture is neutral. In the 4-hour chart, technical indicators turned marginally higher yet mixed at around their midlines, unable to confirm a leg north. At the same time, XAU/USD develops below a mildly bearish 20 SMA, while the longer moving averages aim modestly higher, well below the current level.
Support levels: 3,382.85 3,366.10 3,352.40
Resistance levels: 3,406.90 3,414.60 3,437.85
Is the US dollar gearing up for a significant reversal? There are early warning signs everywhere.
Watch today’s forex mid-week analysis to see how I’m trading the DXY, EURUSD, GBPUSD, and USDJPY this week!
The US dollar could be on the verge of a significant turning point. For all of 2025, the DXY has trended lower steadily and aggressively. It’s been a relentless selloff that has wiped out several key levels.
However, no trend lasts forever, and a significant buy-side imbalance is evident near 106.00. Imbalances or inefficiencies like the one at 106.00 can often serve as magnets.
But without a technical trigger, imbalances like 106.00 don’t mean much. There also needs to be a trigger, such as a high-timeframe breakout, to confirm the reversal and open the door to those imbalances.
So far, USD bulls have cleared the 98.30 level. That was the first hurdle that I discussed in the last Weekly Forex Forecast. The next big test for buyers is the February trend line at 99.00.
That’s resistance for now, but a sustained break above would support the idea of a bullish reversal. It would also expose higher levels, such as 100.20 and 101.90.
Until then, the DXY remains range-bound and indecisive, oscillating between the 99.00 resistance level and the 98.30 support level.
The EURUSD uptrend could be in trouble as Tuesday’s session failed to hold above 1.1530. Additionally, the DXY broke above the 98.30 level I discussed in the Weekly Forex Forecast.
In that video, I shared how the DXY had been testing channel support from over a decade ago. I have also shared in recent weeks how the DXY 106.00 region could become a magnet.
The US dollar index left a significant imbalance at 106.00 during the March selloff. EURUSD shares a similar imbalance at 1.0600.
However, a couple of things need to occur to confirm these reversals.
First, EURUSD needs a sustained break below 1.1530 and 1.1440. That could confirm a significant top for the euro. So far, sellers have only dealt with 1.1530.
Second, the DXY needs to hold above 98.30, which is breaking today, and clear its February trend line at 99.00.
If that occurs, the EURUSD could target lower levels, such as 1.1275 and 1.1060. My final target on a confirmed top (if we get it) will be the 1.0600 region.
However, as mentioned above, the current price action serves as a warning sign. Both the EURUSD and DXY have work to do to confirm a full reversal pattern.

GBPUSD is also flashing warning signs of a potential top. In previous videos, I discussed the similarities with the 2024 top, including a multi-month rising wedge and RSI bearish divergence.
The pound broke its rising wedge on Tuesday, closing the session right on the 1.3430 support area.
Where Wednesday’s session closes could determine if this key support area broke down on Tuesday. If the GBPUSD closes convincingly above 1.3430/40 on Wednesday, it will keep the area intact as support for now.
As with the DXY and EURUSD, the pound left a massive imbalance in the 1.2900 region during the April rally. That could serve as a magnet for GBPUSD if the breakdown is confirmed this week.

USDJPY remains range-bound between 145.40 resistance and 142.40 support. There has been no change to recent forecasts, but the potential remains.
One idea I have discussed in recent videos is a potentially weaker yen in the coming weeks. However, the Yen Basket remains above its 2020 descending trend line, so nothing is confirmed.
The same goes for USDJPY and other yen pairs. USDJPY is selling off from 145.40 yet again, so the pair remains range-bound until proven otherwise.
I’ll continue to monitor the Yen Basket as it tests its 2020 trend line. Recent price action suggests a possible buy-side fakeout, which could be bearish for the yen; however, I need to see more evidence before taking action.

The EURJPY pair recorded some extra gains by hitting 167.60 level, which forces it to form a temporary correctional rebound, affected by a stochastic attempt to exit the overbought level, providing chances for catching its breath and gathering the gains by reaching 166.70.
The price keeps providing mixed trading, but its repeated stability within the bullish channel’s levels and forming extra support at 166.00 level, so these factors make us keep the main bullish suggestion, which might target 168.00 level in the near period trading reaching the resistance level at 168.90.
The expected trading range for today is between 165.95 and 167.45
Trend forecast: Fluctuated within the bullish track

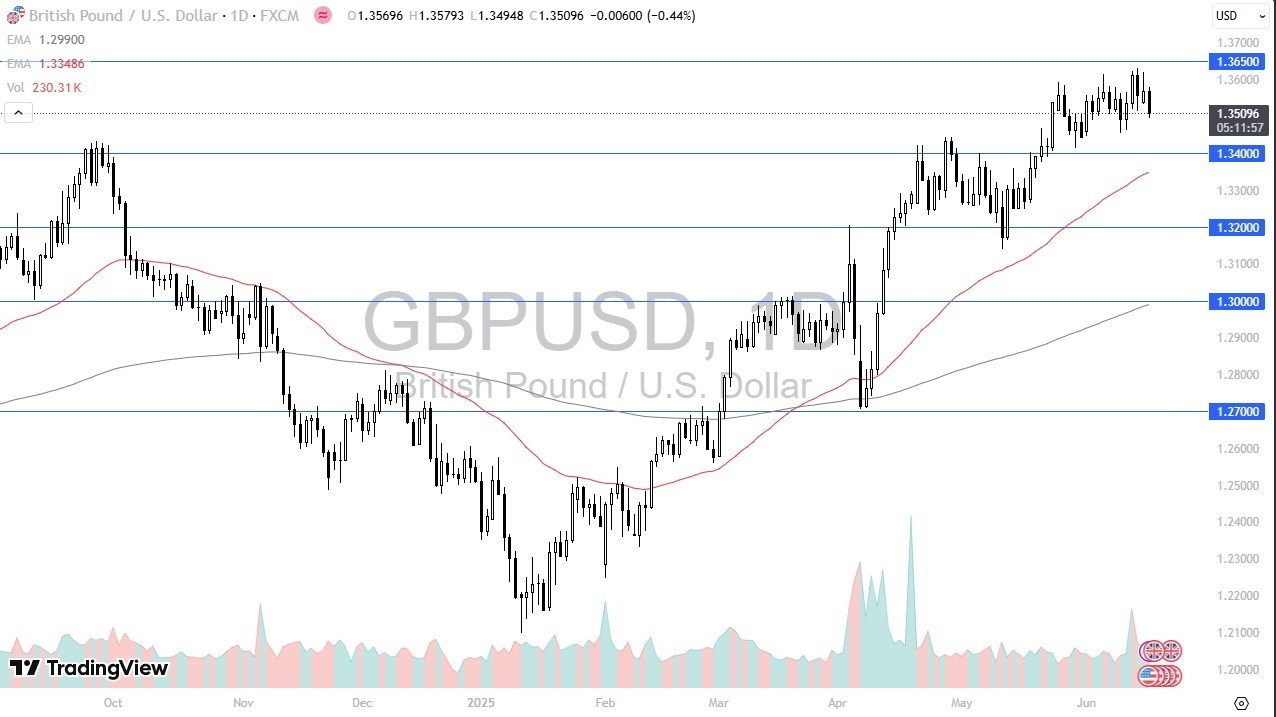
The technical analysis for this market of course is somewhat bullish over the longer term, but in the short term, it looks like we are simply going to be neutral, which does make a certain amount of sense as we are waiting for that interest rate decision, but we also have a lot of questions asked about global risk appetite, as the US dollar of course is considered to be a safety currency, and the British pound is considered to be a little bit “more risky” than the greenback. Having said that, the market continues to see a lot of chop, and I think this will be the case in the short term.
Ultimately, I think this is a scenario where people will be very cautious with their position sizing, release it should be. However, if we were to break above the 1.3650 level on a daily close, that could really start to open up the bigger move to the upside. On the other hand, if we were to break down below the 1.34 level, that would of course be an area where the 50 Day EMA is racing toward, and it will almost certainly attract buyers.
It’s a market that’s been sideways for a couple of weeks, and I do think that makes quite a bit of sense considering that we had gotten here so quickly, and trends can only last for so long. With this being the case, I think you’ve got a scenario where buyers continue to support the market, but we need to get through the interest rate decision and much more breakout.
Ready to trade our GBP/USD daily forecast? We’ve shortlisted the best regulated forex brokers UK in the industry for you.
Christopher Lewis has been trading Forex and has over 20 years experience in financial markets. Chris has been a regular contributor to Daily Forex since the early days of the site. He writes about Forex for several online publications, including FX Empire, Investing.com, and his own site, aptly named The Trader Guy. Chris favours technical analysis methods to identify his trades and likes to trade equity indices and commodities as well as Forex. He favours a longer-term trading style, and his trades often last for days or weeks.
Silver (XAG/USD) broke above the top of a descending channel from early-June highs, favoured by higher safe-haven demand on risk-off markets, and has confirmed a bullish flag.
The fundamental context remains supportive with safe assets favoured as the war between Israel and Iran extends, with the US President Trump tempted to jump in and turn it into a regional conflict of unforeseeable consequences. Precious metals are likely to remain buoyant until geopolitical tensions ease.
The focus today is on the Federal Reserve, which is highly likely to keep interest rates on hold but will release fresh economic and interest rate projections that may have a significant impact on the US Dollar.
From a technical perspective, the 4-hour chart shows that the pair ended its correction from June 9 highs on Tuesday, breaking above the $36.90 level and resuming the broader bullish trend
The next resistance level is now at the 161.8% Fibonacci extension of the June 9 to June 11 correction is at $37.85. Above here, the next target is the area between the 261.8% extension of the mentioned range, at $39.35, and the Bullish Flag’s measured target, at $39.55.
The 4-Hour RSI is reaching overbought levels, which might lead to some consolidation or a correction. The previous resistance, at $36.90, and the reverse trendline, now at $36.50, are likely to act as support.
Silver is a precious metal highly traded among investors. It has been historically used as a store of value and a medium of exchange. Although less popular than Gold, traders may turn to Silver to diversify their investment portfolio, for its intrinsic value or as a potential hedge during high-inflation periods. Investors can buy physical Silver, in coins or in bars, or trade it through vehicles such as Exchange Traded Funds, which track its price on international markets.
Silver prices can move due to a wide range of factors. Geopolitical instability or fears of a deep recession can make Silver price escalate due to its safe-haven status, although to a lesser extent than Gold’s. As a yieldless asset, Silver tends to rise with lower interest rates. Its moves also depend on how the US Dollar (USD) behaves as the asset is priced in dollars (XAG/USD). A strong Dollar tends to keep the price of Silver at bay, whereas a weaker Dollar is likely to propel prices up. Other factors such as investment demand, mining supply – Silver is much more abundant than Gold – and recycling rates can also affect prices.
Silver is widely used in industry, particularly in sectors such as electronics or solar energy, as it has one of the highest electric conductivity of all metals – more than Copper and Gold. A surge in demand can increase prices, while a decline tends to lower them. Dynamics in the US, Chinese and Indian economies can also contribute to price swings: for the US and particularly China, their big industrial sectors use Silver in various processes; in India, consumers’ demand for the precious metal for jewellery also plays a key role in setting prices.
Silver prices tend to follow Gold’s moves. When Gold prices rise, Silver typically follows suit, as their status as safe-haven assets is similar. The Gold/Silver ratio, which shows the number of ounces of Silver needed to equal the value of one ounce of Gold, may help to determine the relative valuation between both metals. Some investors may consider a high ratio as an indicator that Silver is undervalued, or Gold is overvalued. On the contrary, a low ratio might suggest that Gold is undervalued relative to Silver.
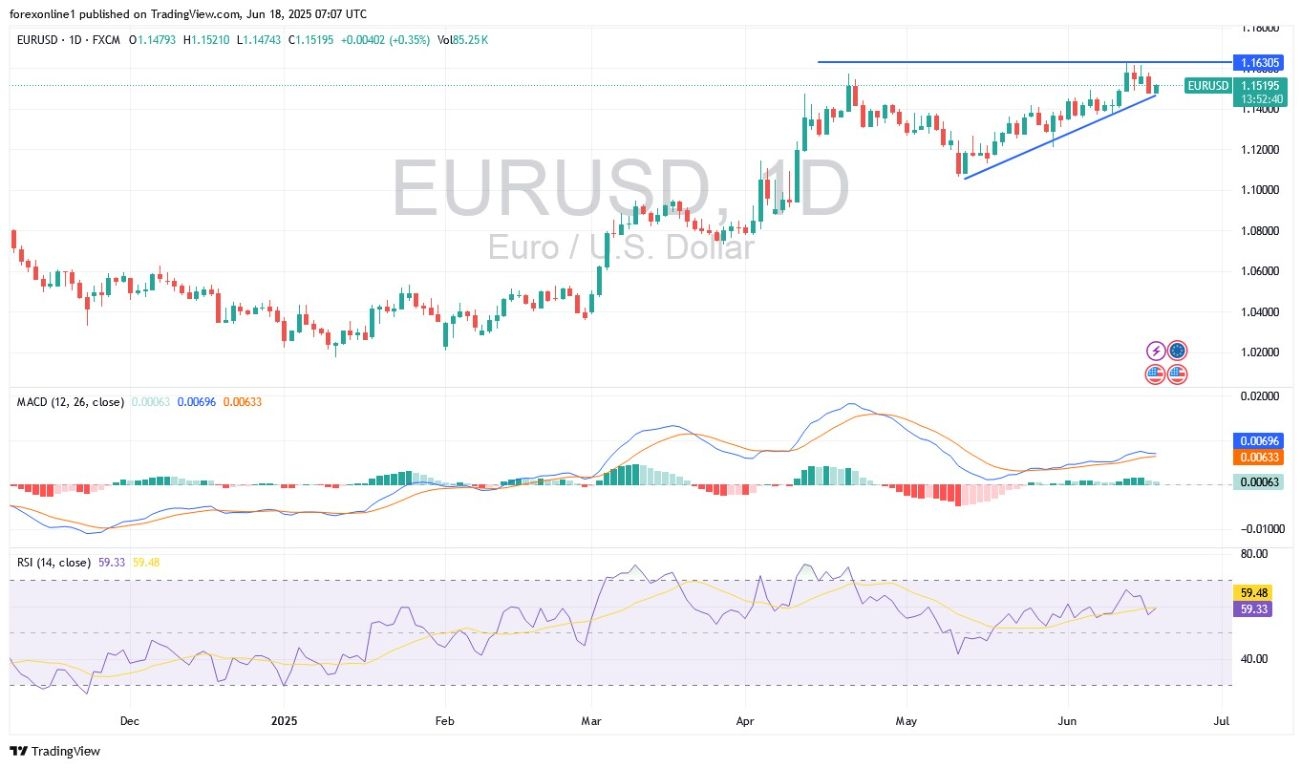
Euro bulls are attempting to find additional positive momentum to resume their upward rebound at the start of this week’s trading. The currency pair jumped towards the 1.1615 resistance level, near its 43-month high, before experiencing selling pressure that pushed it towards the 1.1474 support level, settling around 1.1520 at the time of writing this analysis. According to performance across reliable trading platforms, the US Dollar has not found sustained support in global markets, with selling occurring at price rallies despite ongoing tensions in the Middle East. At the start of this week’s trading, oil prices declined, while stock markets achieved net gains.
Given the multitude of local and global risks, trading volatility is inevitable, and any escalation in the Middle East would signal a significant move in forex markets. Commenting on currency price performance, ING Bank stated: “The US Dollar’s rebound since the start of Israeli-Iranian attacks has been relatively limited, and it is now largely in decline. This is despite no indications of de-escalation in the region and continued support for oil prices. In our opinion, this once again indicates the market’s lack of confidence in the Dollar at the moment.”
However, the bank also noted that the EUR/USD pair is significantly overvalued, limiting opportunities for further gains; the short-term fair value is slightly below 1.110 according to their model, and a move above 1.1640 would push the pair beyond the triple standard deviation upper limit.
The EUR/USD trend remains upward, but it may face some volatility from the US Federal Reserve’s policy announcement today, in addition to the extent of investor risk aversion. Exercise caution.
In general, financial markets will continue to monitor Middle East developments in the short term as Israel and Iran continue to exchange military strikes. According to experts, there are concerns about the risk of a significant escalation, such as the closure of the main oil transit route through the Strait of Hormuz. A closure of the Strait of Hormuz would disrupt up to a third of global oil supplies, which analysts estimate could lead to crude oil prices rising to between $120 and $150 per barrel. The closure of the Strait would also impede natural gas flows from Qatar to Europe, exacerbating the negative terms of trade shock suffered by the EU energy sector, while providing a strong boost to alternative suppliers, the United States and Australia.
Therefore, this development would pose significant downside risks to the Euro.
Based on the daily chart performance, the overall outlook for the EUR/USD pair remains bullish so far. The trend will not be broken without the bears successfully pushing the currency pair to the vicinity of the 1.1370 and 1.1250 support levels, respectively. Currently, the 14-day RSI (Relative Strength Index) is in neutral territory and awaits further momentum for confirmation of an upward move. Conversely, the MACD (Moving Average Convergence Divergence) indicator is strongly trending upward. On the upside, a break of the 1.1630 resistance is important for further strengthening of bullish control over the EUR/USD trend.
The US Federal Reserve will announce its latest interest rate decision today, Wednesday, at 9:00 PM Egypt time, with strong expectations of keeping rates at 4.50%. Before that, at 12:00 PM Egypt time, Eurozone inflation figures will be announced, which in turn will influence future expectations for European Central Bank policies. Overall, the Federal Reserve’s guidance and updated economic projections, including interest rate forecasts, will also be important for US Dollar sentiment. The updated projections from the Federal Reserve will inevitably be a key factor. In the previous update in March, the median forecast was for two rate cuts in 2025, with two more in 2026. According to experts, if the Federal Reserve keeps the US interest rate accommodative as expected, the US Dollar is likely to resume its decline due to deteriorating underlying conditions in the United States.
Ready to trade our Forex daily forecast? We’ve shortlisted the best forex broker list for you to check out.
Silver (XAG/USD), meanwhile, held firmer, trading at $37.24 after touching an intraday high of $37.26. The white metal continues to benefit from robust industrial demand and remains supported by persistent safe-haven flows, particularly as rate expectations soften.
Traders are focused on the Fed’s policy announcement later today, especially after a string of disappointing economic releases. U.S. retail sales dropped 0.9% month-over-month in May, while industrial production contracted 0.2%, marking its second decline in three months. Year-over-year retail sales slowed to 3.3%, down from April’s 5.0%.
According to the CME FedWatch Tool, markets are now pricing in roughly 44 basis points of rate cuts by the end of 2025. The 10-year U.S. Treasury yield fell to 4.403%, while real yields dropped five basis points to 2.103%, reflecting growing expectations of monetary easing.
In the longer term, gold remains supported by structural demand. The World Gold Council’s latest survey revealed that 95% of central banks plan to increase their gold reserves within the next 12 months. This trend reinforces a stable demand floor for bullion, especially as global interest in de-dollarization grows.
Additionally, despite the short-term headwinds, analysts at Goldman Sachs reaffirmed their forecast for gold to reach $3,700/oz by year-end and $4,000 by mid-2026, driven by central bank buying and lower real interest rates.
As the Federal Reserve prepares to signal its outlook, investors are bracing for volatility. But for now, gold and silver continue to walk the fine line between policy signals and geopolitical noise.