The main category of Forex News.
You can use the search box below to find what you need.
[wd_asp id=1]
The main category of Forex News.
You can use the search box below to find what you need.
[wd_asp id=1]
Despite Platinum price attempts to provide some positive trading, but its repeated stability below the barrier at $1275.00 level assists to motivate providing new bearish trading, attempting to decline below $1225.00, then targeting $1184.00 level, which represents the initial extra target for the near trading.
By the above image, we notice stochastic reach below 50 level, to increase the chances for gathering the required negative momentum to reach the mentioned negative stations.
The expected trading range for today is between $1185.00 and $1260.00
Trend forecast: Bearish
AirBNB’s stock price (ABNB) rose in latest intraday trading and attacked the current resistance of $139.85, while trading alongside the upward correctional trend line in the short term, with ongoing positive pressure due to trading above the 50-day SMA, countered with negative signals from the Stochastic after reaching overbought levels, hindering upcoming gains.
Therefore we expect more gains for the price, especially if the aforementioned resistance of $139.85 is breached, targeting the next one at $148.65.
Today’s price forecast: Bullish
The GBPJPY pair continued forming bullish trading since yesterday, taking advantage of the main stability within the bullish channel’s levels, besides surpassing the extra barrier at 195.80, approaching from the initial target level at 196.85 level.
We expect gathering the positive momentum by stochastic attempt to reach the overbought level, to reinforce the chances for targeting new bullish stations that might extend to 197.45 reaching 198.80 in the medium period trading.
The expected trading range for today is between 195.85 and 197.45
Trend forecast: Bullish
Spot Gold set a weekly low of $3,366.25 on Tuesday, bouncing from the level yet in the American session. The US Dollar (USD) spent the first half of the day on the back foot, but remained within familiar levels as market players awaited United States (US) macroeconomic figures, while being cautious amid the Middle East crisis.
The US published May Retail Sales, which fell by 0.9% on a monthly basis, worse than the -0.1% posted in April and the -0,7% expected. Additionally, Industrial Production in the same period was down by 0.2% against the 0.1% advance anticipated. Finally, Capacity Utilization stood at 77.4%, down from the 77.7% posted in April and missing the 77.7% expected.
Additionally, trade-war-related headlines kept coming. On the one hand, European Commission President Ursula von der Leyen noted trade talks with the US are “advancing” despite being complex, while adding the EU has a trade surplus with the US, and that could last.”
Finally, it is worth adding comments from the US President about the Middle East conflict, which fueled risk-off, helping XAU/USD trim intraday losses. Trump claimed the US military has full control of the Iranian airspace, adding that US patience “is wearing thin.”
Discouraging US data and renewed Middle-East-related concerns fuel demand for safety.
In the meantime, the US Federal Reserve (Fed) is expected to keep interest rates on hold when it announces its monetary policy decision on Wednesday. US officials will also present a fresh Summary of Economic Projections (SEP), with fresh inflation, growth and employment perspectives.
The XAU/USD pair trades in the $3,380 region, and the daily chart shows it has spent the journey confined to a tight range. The pair has lost its positive momentum, but the overall risk skews to the upside, given that technical indicators have turned flat well above their midlines. Additionally, XAU/USD develops above all its moving averages, with the 20 Simple Moving Average (SMA) partially losing its bullish strength, yet holding far above bullish 100 and 200 SMAs.
In the near term, and according to the 4-hour chart, Gold price has room to ease further. The pair trades below its 20 SMA, which caps advances at around $3,406.90. The 100 and 200 SMAs remain directionless below the current level, while technical indicators grind lower within negative levels. Still, the risk-averse environment will likely prevent the pair from falling further.
Support levels: 3,366.10 3,352.40 3,339.75
Resistance levels: 3,406.90 3,414.60 3,437.85
GBP/USD stays on the back foot and trades near 1.3550 in the European session on Tuesday after posting small gains on Monday. The pair could extend its decline if the support level at 1.3530 fails.
The table below shows the percentage change of British Pound (GBP) against listed major currencies this week. British Pound was the weakest against the New Zealand Dollar.
| USD | EUR | GBP | JPY | CAD | AUD | NZD | CHF | |
|---|---|---|---|---|---|---|---|---|
| USD | -0.17% | 0.15% | 0.20% | -0.17% | -0.67% | -0.75% | 0.09% | |
| EUR | 0.17% | 0.18% | 0.35% | -0.01% | -0.40% | -0.59% | 0.27% | |
| GBP | -0.15% | -0.18% | 0.20% | -0.19% | -0.58% | -0.77% | 0.09% | |
| JPY | -0.20% | -0.35% | -0.20% | -0.37% | -1.18% | -1.28% | -0.50% | |
| CAD | 0.17% | 0.00% | 0.19% | 0.37% | -0.43% | -0.58% | 0.28% | |
| AUD | 0.67% | 0.40% | 0.58% | 1.18% | 0.43% | -0.19% | 0.68% | |
| NZD | 0.75% | 0.59% | 0.77% | 1.28% | 0.58% | 0.19% | 0.86% | |
| CHF | -0.09% | -0.27% | -0.09% | 0.50% | -0.28% | -0.68% | -0.86% |
The heat map shows percentage changes of major currencies against each other. The base currency is picked from the left column, while the quote currency is picked from the top row. For example, if you pick the British Pound from the left column and move along the horizontal line to the US Dollar, the percentage change displayed in the box will represent GBP (base)/USD (quote).
The improving risk mood made it difficult for the US Dollar (USD) to stay resilient against its peers on Monday and helped GBP/USD push higher. The Wall Street Journal reported that Iran was looking to end hostilities with Israel and resume talks about its nuclear program. Major equity indexes ended the day decisively higher, reflecting a risk-positive market atmosphere.
Early Tuesday, investors turn cautious and allow the USD to hold its ground as the Israel-Iran conflicts enters its fifth day. Citing Iran’s IRNA news agency, Reuters reported that Iran has recently launched a “more powerful” new wave of missiles toward Israel. Additionally, a senior commander for the Iranian army noted that a new wave of hundred of drones will soon hit Israel.
In the second half of the day, the US economic calendar will offer Retail Sales and Industrial Production data for May. A significant negative surprise in the Retail Sales data could hurt the USD with the immediate reaction. Nonetheless, unless Wall Street stages a bullish opening, the USD could continue to benefit from safe-haven flows.
Early Wednesday, the UK’s Office for National Statistics will publish the Consumer Price Index (CPI) data for May. Later in the day, the Federal Reserve (Fed) will announce monetary policy decisions and publish the revised Summary of Economic Projections. On Thursday, the Bank of England is expected to leave the bank rate unchanged at 4.25%.
The Relative Strength Index (RSI) indicator on the 4-hour chart stays slightly below 50 and GBP/USD trades below the 20-period and the 50-period Simple Moving Averages (SMA), hinting at a bearish tilt on the short-term outlook.
On the downside, the 100-period SMA forms the first support level at 1.3530 ahead of 1.3500 (round level, static level) and 1.3430 (200-period SMA). Looking north, resistance levels could be spotted at 1.3570 (20-period SMA), 1.3600 (static level, support level) and 1.3630 (mid-point of the ascending channel).
The Pound Sterling (GBP) is the oldest currency in the world (886 AD) and the official currency of the United Kingdom. It is the fourth most traded unit for foreign exchange (FX) in the world, accounting for 12% of all transactions, averaging $630 billion a day, according to 2022 data.
Its key trading pairs are GBP/USD, also known as ‘Cable’, which accounts for 11% of FX, GBP/JPY, or the ‘Dragon’ as it is known by traders (3%), and EUR/GBP (2%). The Pound Sterling is issued by the Bank of England (BoE).
The single most important factor influencing the value of the Pound Sterling is monetary policy decided by the Bank of England. The BoE bases its decisions on whether it has achieved its primary goal of “price stability” – a steady inflation rate of around 2%. Its primary tool for achieving this is the adjustment of interest rates.
When inflation is too high, the BoE will try to rein it in by raising interest rates, making it more expensive for people and businesses to access credit. This is generally positive for GBP, as higher interest rates make the UK a more attractive place for global investors to park their money.
When inflation falls too low it is a sign economic growth is slowing. In this scenario, the BoE will consider lowering interest rates to cheapen credit so businesses will borrow more to invest in growth-generating projects.
Data releases gauge the health of the economy and can impact the value of the Pound Sterling. Indicators such as GDP, Manufacturing and Services PMIs, and employment can all influence the direction of the GBP.
A strong economy is good for Sterling. Not only does it attract more foreign investment but it may encourage the BoE to put up interest rates, which will directly strengthen GBP. Otherwise, if economic data is weak, the Pound Sterling is likely to fall.
Another significant data release for the Pound Sterling is the Trade Balance. This indicator measures the difference between what a country earns from its exports and what it spends on imports over a given period.
If a country produces highly sought-after exports, its currency will benefit purely from the extra demand created from foreign buyers seeking to purchase these goods. Therefore, a positive net Trade Balance strengthens a currency and vice versa for a negative balance.
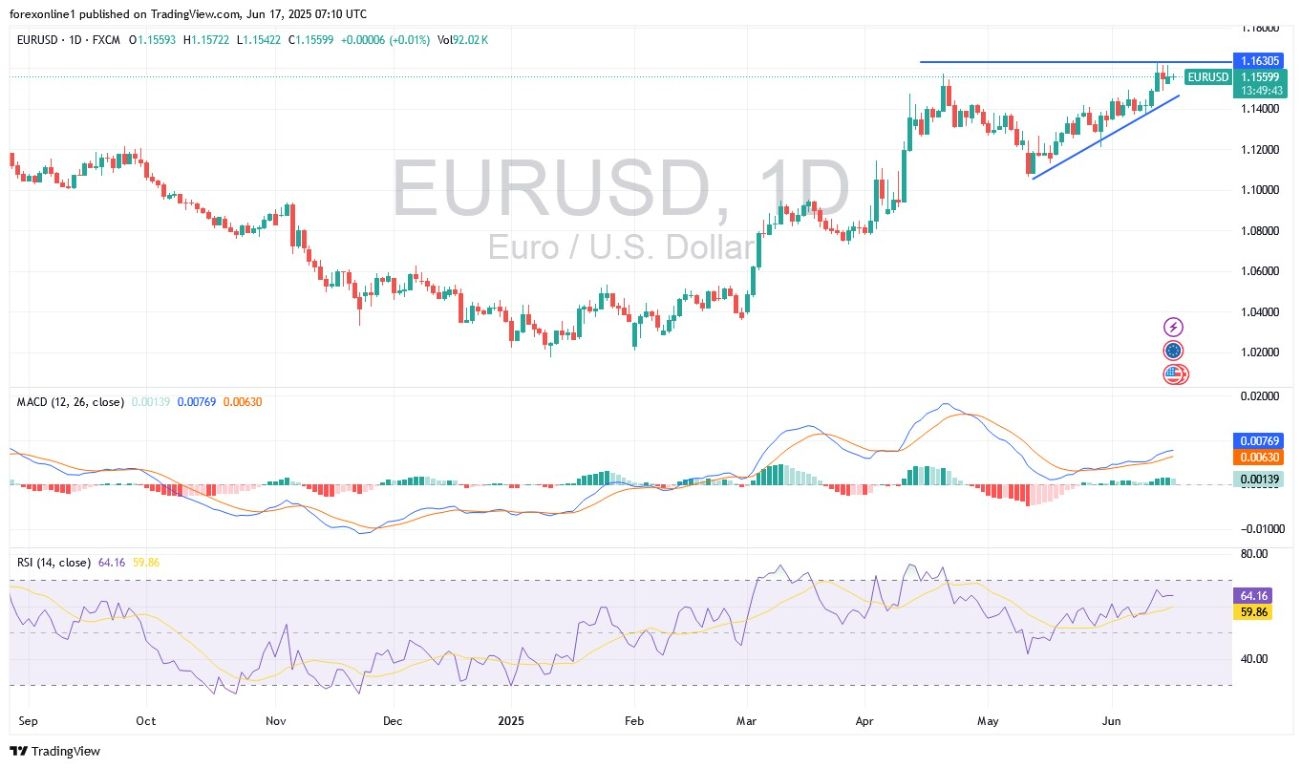
Based on recent trades, the EUR/USD pair continues to trade within a well-defined ascending channel, which has guided price action over the past few weeks. The EUR/USD pair is currently testing a resistance level near the upper boundary at 1.1540. The currency pair has demonstrated resilience by maintaining its upward trajectory along the lower trendline support of the channel.
Overall, technical analysis reveals that the EUR/USD pair recently approached the top of the channel after bouncing off support levels, indicating sustained upward momentum. However, approaching the resistance level might lead to some profit-taking or consolidation before the next directional movement begins. Fibonacci retracement levels provide key reference points for potential pullback scenarios. Should the EUR/USD pair retrace from its current levels, initial support might appear around the 38.2% retracement level at 1.1532, followed by the more significant 50% level at 1.1502.
A deeper correction could extend towards the 61.8% Fibonacci level at 1.1473, which closely coincides with dynamic support levels.

The EUR/USD trend remains upward, but it may face some volatility from the announcement of US inflation figures and the US Federal Reserve’s policy announcements this week, in addition to the extent of investor risk aversion.
At the same time, the moving average formation supports positive expectations, with shorter-term averages positioned above longer-term averages, confirming that the stronger path remains upward. These dynamic levels are trending higher and may provide support for any short-term weakness, reinforcing the lower boundary of the ascending channel. From a momentum perspective, the Stochastic indicator appears to be approaching the overbought region, suggesting that upward pressure might reach exhaustion levels. This situation indicates the possibility of sellers emerging soon, which could lead to a pullback within the channel’s framework.
The RSI (Relative Strength Index) readings show the oscillator fluctuating between neutral and slightly bullish, allowing for further upside before reaching overbought territory. However, any decline from current levels suggests the potential for a corrective phase to begin. Overall, the technical outlook for EUR/USD remains positive within the ascending channel structure, though some consolidation or a slight pullback would not be surprising given its proximity to resistance and momentum indicators.
Today’s EUR/USD trading will be influenced by important economic data, led by the ZEW German Economic Sentiment Index reading, with expectations for a recovery to 34.8 from the previous reading of 25.2. This release is due at 12:00 PM Egypt time. Later the same day, the EUR/USD will react to the announcement of US retail sales figures, due at 3:30 PM Egypt time. These figures confirm consumer confidence and, consequently, spending.
During yesterday’s trading session, European stocks closed significantly higher across stock trading platforms, ending five consecutive sessions of losses. Recently, the easing of concerns that hostilities between Israel and Iran would impede the global economy contributed to higher global stock prices. Recent reports indicated that Tehran is prepared to resume nuclear talks with the United States, signalling its readiness to de-escalate exchanges with Israel, which bolstered hopes that the conflict would not negatively impact global economic activity and energy prices. Financial markets are also preparing for key monetary policy decisions this week, led by the Bank of England, the Swiss National Bank, the Swedish Central Bank, and the Norwegian Central Bank, in addition to the US Federal Reserve and the Bank of Japan outside of Europe.
According to trading activity, bank stocks led the gains as bond yields fell, with shares of Santander, BNP Paribas, Intesa Sanpaolo, and UniCredit rising between 2.5% and 3%. Technology stocks also saw increases, with Adyen and Nokia shares jumping between 2% and 3%. Finally, Kering’s stock rose by 12% on expectations that Luca de Meo, CEO of Renault, would join the luxury goods giant.
Ready to trade our daily Forex analysis? We’ve made a list of the best forex trading platforms for beginners worth trading with.
Despite Platinum price attempts to provide some positive trading, but its repeated stability below the barrier at $1275.00 level assists to motivate providing new bearish trading, attempting to decline below $1225.00, then targeting $1184.00 level, which represents the initial extra target for the near trading.
By the above image, we notice stochastic reach below 50 level, to increase the chances for gathering the required negative momentum to reach the mentioned negative stations.
The expected trading range for today is between $1185.00 and $1260.00
Trend forecast: Bearish
Despite Platinum price attempts to provide some positive trading, but its repeated stability below the barrier at $1275.00 level assists to motivate providing new bearish trading, attempting to decline below $1225.00, then targeting $1184.00 level, which represents the initial extra target for the near trading.
By the above image, we notice stochastic reach below 50 level, to increase the chances for gathering the required negative momentum to reach the mentioned negative stations.
The expected trading range for today is between $1185.00 and $1260.00
Trend forecast: Bearish
The Federal Open Market Committee (FOMC) begins its two-day policy meeting today, with a decision expected Wednesday. While no immediate policy changes are anticipated, traders are keenly focused on Chair Jerome Powell’s forward guidance, especially in light of tariff-related inflation risks.
Increased tensions in the Middle East, particularly following strikes near the Strait of Hormuz and concerns over energy infrastructure, have revived safe-haven flows into gold and silver. Though the situation remains fluid, the proximity of these developments to vital shipping lanes has stoked investor caution.
On Monday, three oil tankers reportedly caught fire in the Gulf of Oman. While investigations are ongoing, the incident drew parallels to the 2019 tanker attacks and triggered risk aversion across Asian equity markets. Gold, long considered a geopolitical hedge, responded accordingly.
Silver (XAG/USD), meanwhile, mirrored gold’s strength, rising toward $36.50. The metal briefly touched $36.4955 before stabilizing.
Gold holds above $3,373 trendline support as bulls eye $3,404. Silver consolidates near $36.64, with breakout potential toward $36.88 if $36.12 support holds. Momentum remains neutral.
Important DisclaimersThe content provided on the website includes general news and publications, our personal analysis and opinions, and contents provided by third parties, which are intended for educational and research purposes only. It does not constitute, and should not be read as, any recommendation or advice to take any action whatsoever, including to make any investment or buy any product. When making any financial decision, you should perform your own due diligence checks, apply your own discretion and consult your competent advisors. The content of the website is not personally directed to you, and we does not take into account your financial situation or needs.The information contained in this website is not necessarily provided in real-time nor is it necessarily accurate. Prices provided herein may be provided by market makers and not by exchanges.Any trading or other financial decision you make shall be at your full responsibility, and you must not rely on any information provided through the website. FX Empire does not provide any warranty regarding any of the information contained in the website, and shall bear no responsibility for any trading losses you might incur as a result of using any information contained in the website.The website may include advertisements and other promotional contents, and FX Empire may receive compensation from third parties in connection with the content. FX Empire does not endorse any third party or recommends using any third party’s services, and does not assume responsibility for your use of any such third party’s website or services.FX Empire and its employees, officers, subsidiaries and associates, are not liable nor shall they be held liable for any loss or damage resulting from your use of the website or reliance on the information provided on this website.Risk DisclaimersThis website includes information about cryptocurrencies, contracts for difference (CFDs) and other financial instruments, and about brokers, exchanges and other entities trading in such instruments. Both cryptocurrencies and CFDs are complex instruments and come with a high risk of losing money. You should carefully consider whether you understand how these instruments work and whether you can afford to take the high risk of losing your money.FX Empire encourages you to perform your own research before making any investment decision, and to avoid investing in any financial instrument which you do not fully understand how it works and what are the risks involved.