The main category of Forex News.
You can use the search box below to find what you need.
[wd_asp id=1]
The main category of Forex News.
You can use the search box below to find what you need.
[wd_asp id=1]
The Federal Open Market Committee (FOMC) begins its two-day policy meeting today, with a decision expected Wednesday. While no immediate policy changes are anticipated, traders are keenly focused on Chair Jerome Powell’s forward guidance, especially in light of tariff-related inflation risks.
Increased tensions in the Middle East, particularly following strikes near the Strait of Hormuz and concerns over energy infrastructure, have revived safe-haven flows into gold and silver. Though the situation remains fluid, the proximity of these developments to vital shipping lanes has stoked investor caution.
On Monday, three oil tankers reportedly caught fire in the Gulf of Oman. While investigations are ongoing, the incident drew parallels to the 2019 tanker attacks and triggered risk aversion across Asian equity markets. Gold, long considered a geopolitical hedge, responded accordingly.
Silver (XAG/USD), meanwhile, mirrored gold’s strength, rising toward $36.50. The metal briefly touched $36.4955 before stabilizing.
Gold holds above $3,373 trendline support as bulls eye $3,404. Silver consolidates near $36.64, with breakout potential toward $36.88 if $36.12 support holds. Momentum remains neutral.
Important DisclaimersThe content provided on the website includes general news and publications, our personal analysis and opinions, and contents provided by third parties, which are intended for educational and research purposes only. It does not constitute, and should not be read as, any recommendation or advice to take any action whatsoever, including to make any investment or buy any product. When making any financial decision, you should perform your own due diligence checks, apply your own discretion and consult your competent advisors. The content of the website is not personally directed to you, and we does not take into account your financial situation or needs.The information contained in this website is not necessarily provided in real-time nor is it necessarily accurate. Prices provided herein may be provided by market makers and not by exchanges.Any trading or other financial decision you make shall be at your full responsibility, and you must not rely on any information provided through the website. FX Empire does not provide any warranty regarding any of the information contained in the website, and shall bear no responsibility for any trading losses you might incur as a result of using any information contained in the website.The website may include advertisements and other promotional contents, and FX Empire may receive compensation from third parties in connection with the content. FX Empire does not endorse any third party or recommends using any third party’s services, and does not assume responsibility for your use of any such third party’s website or services.FX Empire and its employees, officers, subsidiaries and associates, are not liable nor shall they be held liable for any loss or damage resulting from your use of the website or reliance on the information provided on this website.Risk DisclaimersThis website includes information about cryptocurrencies, contracts for difference (CFDs) and other financial instruments, and about brokers, exchanges and other entities trading in such instruments. Both cryptocurrencies and CFDs are complex instruments and come with a high risk of losing money. You should carefully consider whether you understand how these instruments work and whether you can afford to take the high risk of losing your money.FX Empire encourages you to perform your own research before making any investment decision, and to avoid investing in any financial instrument which you do not fully understand how it works and what are the risks involved.
Despite Platinum price attempts to provide some positive trading, but its repeated stability below the barrier at $1275.00 level assists to motivate providing new bearish trading, attempting to decline below $1225.00, then targeting $1184.00 level, which represents the initial extra target for the near trading.
By the above image, we notice stochastic reach below 50 level, to increase the chances for gathering the required negative momentum to reach the mentioned negative stations.
The expected trading range for today is between $1185.00 and $1260.00
Trend forecast: Bearish
The USD/JPY outlook remains slightly supported as the pair snapped a two-day winning streak after the Bank of Japan left the policy rate unchanged at 0.50%. Earlier this week, the pair saw a rise amid safe-haven flows triggered by the Middle East crisis.
-If you are interested in forex day trading then have a read of our guide to getting started-
However, the yen bulls may struggle to find a meaningful trend as the Bank of Japan could postpone the rate hikes to the first quarter of 2026 due to tariff uncertainty. In the G7 meeting, the US and Japan could not reach an agreement on the tariffs. Japan’s Finance Minister Kato also stated that they have no plan to meet US Treasury Secretary Bessent. This is another factor that could cap yen’s gains. The US plans to impose 25% tariffs on Japanese vehicles and 24% tariffs on other imports.
According to the UOB analysts, the USD/JPY price may remain within a familiar range of 143.50 to 145.50 with the least probability of breaking the level.
On the other hand, the US dollar remains significantly weak amid last week’s dismal inflation figures. Moreover, the tariff uncertainty continues to linger, giving no room to recover. The currency is gradually losing its safe-haven status as well. Given the recent geopolitics, gold, and yen tend to perform way better than the dollar.
On the geopolitical front, the Iran-Israel conflict enters the fifth day with both sides aggressively attack. President Trump warned Iranians through Truth Social post to evacuate Tehran. A White House official clarified that the purpose of the post was to show urgency to bring Iran to the table for talks.
Investors are cautious as we head towards the FOMC meeting due tomorrow. The Federal Reserve is widely expected to keep rates on hold. However, the monetary policy statement is important to watch as market participants are keen about the policy path and number of cuts in 2025.
The core retail sales are expected to grow, while the retail sales may show a contraction.
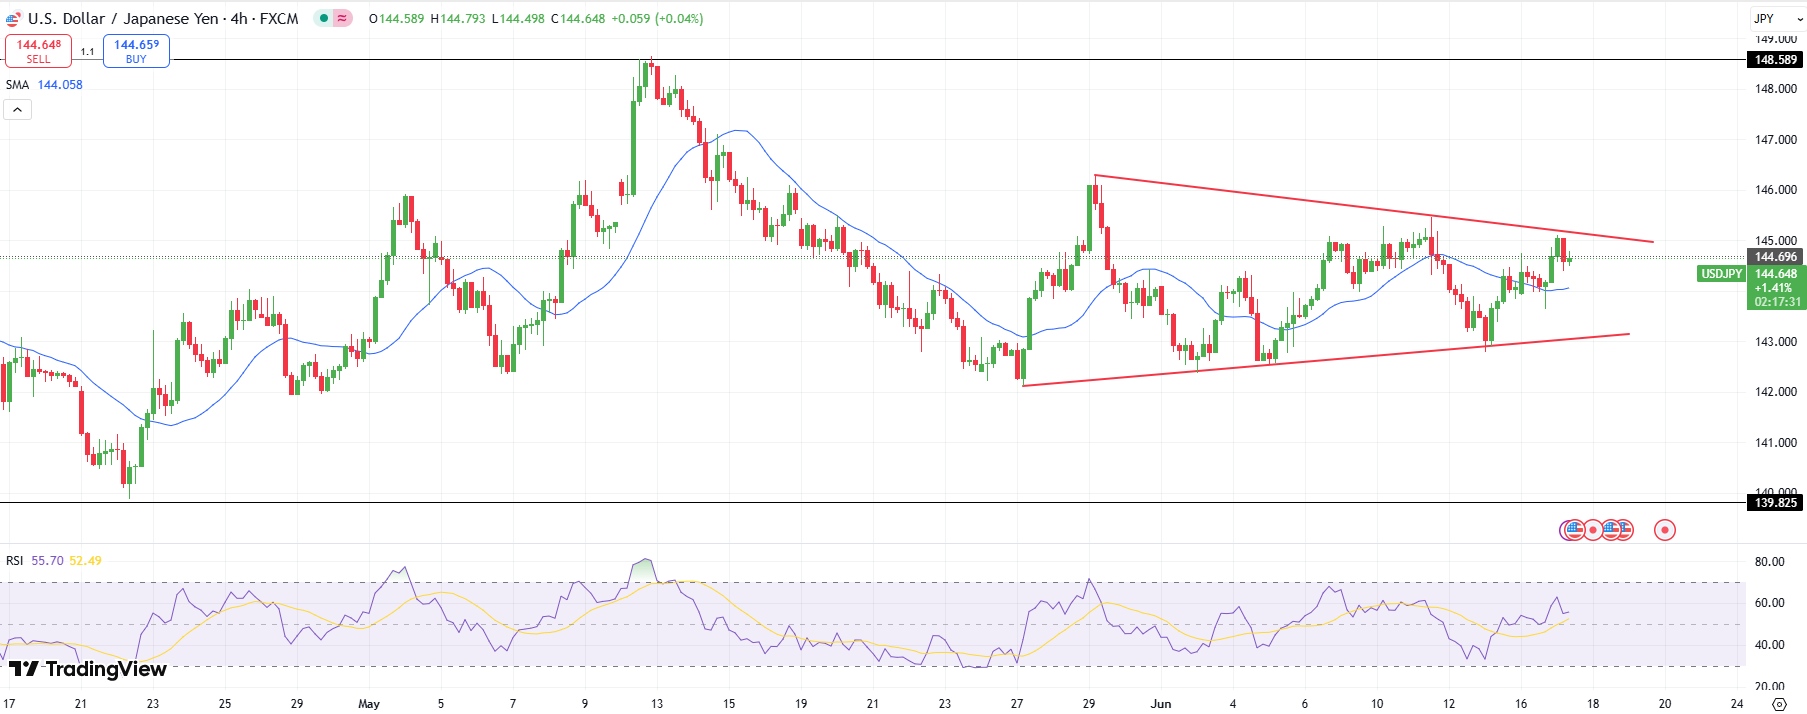
The 4-hour chart shows a bullish pinbar and a rising trendline, lending enough support to the pair. Moreover, the price stays well above the 20-period SMA, which is another bullish sign. The RSI is at 56.0, heading north. These factors reveal that the buyers are mildly dominating. The immediate resistance comes at 145.00 ahead of 145.50.
-Are you looking for the best AI Trading Brokers? Check our detailed guide-
On the flip side, the close below the 20-period SMA could ignite the selling pressure leading towards a support at 144.00 ahead of 143.50.
Looking to trade forex now? Invest at eToro!
67% of retail investor accounts lose money when trading CFDs with this provider. You should consider whether you can afford to take the high risk of losing your money.
Today’s advance shows the likely completion of a bottom with a slightly higher swing low established at $3.45. Support was confirmed around the price level by the confluence of the 50-Day MA, the 20-Day MA, a 50% retracement level, and a significant anchored volume weighted average price (AVWAP) support level calculated from the swing low in April. Recently, the 20-Day MA began to rise again and moved away from the 50-Day MA. That dynamic between the two moving averages is a sign of improving underlying demand.
There were essentially three attempts following the April swing low to reclaim the $3.84 price level. Resistance was seen at $3.84, which established a swing high. Two subsequent rallies stopped short at $3.83 and $3.82, respectively. Monday’s advance shows another likely attempt will be made. Notice that the 50-Day MA (orange) was last reclaimed on June 2. Therefore, the recent pullback was a successful test of prior dynamic resistance as support. Since it was followed by a bullish reversal, the bearish correction should be complete, with a new attempt to rise above $3.84 likely to be seen next.
A rally above today’s high of $3.76 will provide the next sign of strength but an advance above the most recent lower swing high of $3.82 will give a more reliable indication. If the $3.84 level is broken a continuation of the rising ABCD pattern will be triggered and increase the chance of eventually reaching the initial target from the pattern at $4.08. That price level can be considered as potential resistance along with the 61.85% Fibonacci retracement level at $4.12.
For a look at all of today’s economic events, check out our economic calendar.
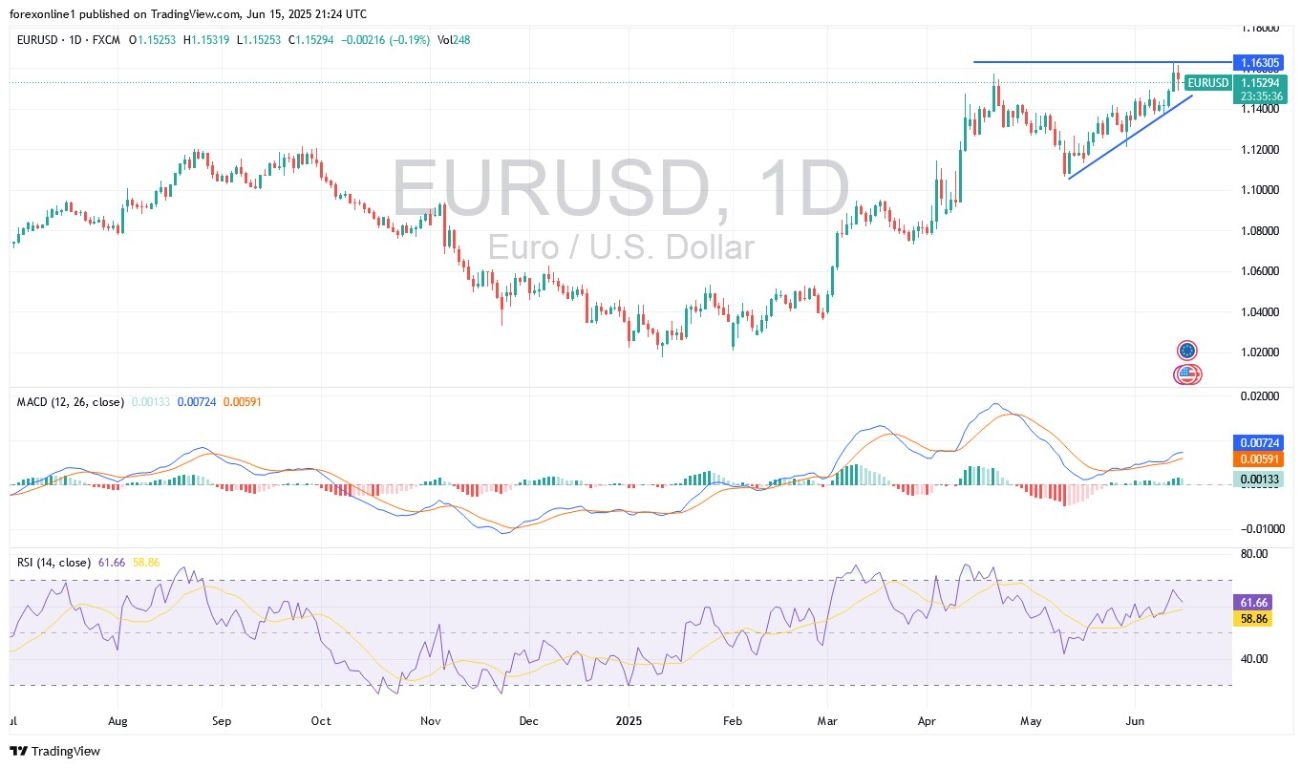
Ahead of significant economic events this week and the escalation of global tensions over the past weekend, we anticipate strong and exciting volatility in forex markets this week. According to licensed trading platforms, the EUR/USD pair jumped to the 1.1632 resistance level, its highest in three and a half years, before experiencing a swift sell-off last Friday. This moved the pair towards the 1.1488 support level before it closed the week settling around 1.1550. This bullish movement in the EUR/USD pair may react to geopolitical tensions in the Middle East in the new trading week, following the Israeli attack on Iranian nuclear facilities, raising fears of a broader regional conflict.
Also, financial markets will closely monitor any progress in trade negotiations between the United States and its major partners. Meanwhile, attention turns to the G7 summit in Canada, where leaders of the world’s largest economies will meet to discuss major global challenges. It’s also a busy week for monetary policy decisions from global central banks. The US Federal Reserve, the People’s Bank of China, the Bank of Japan, and the Bank of England are all expected to keep interest rates unchanged.

The Euro’s gains may be vulnerable to collapse if investor risk aversion increases amid successive global tensions.
Technically, the overall outlook for the EUR/USD price remains bullish so far. Its recent gains and the breach of the 1.1600 resistance have pushed some technical indicators, led by the 14-day RSI (Relative Strength Index) and MACD (Moving Average Convergence Divergence) lines, to the brink of overbought readings. I anticipate that the EUR/USD will be a target for selling from above the 1.1600 resistance, especially if forex investors turn to buying the US Dollar as a safe haven amid global trade and geopolitical tensions. The nearest targets for the bulls are currently 1.1660, 1.1720, and 1.1800, respectively. These levels are sufficient to push all technical indicator readings into overbought territory.
Renewed selling of the Euro against the US Dollar is the more likely forecast given events in the Middle East and concerns about the military conflicts expanding to other countries. This threatens crude oil sources, leading to a setback for the future of global economic recovery, which would significantly harm the Euro. Based on the daily timeframe chart, the 1.1370 support level will remain a technical threat to the EUR/USD’s upward movement, as it could increase selling pressure towards the psychological support of 1.1200. At the start of this trading week, the EUR/USD is not anticipating any significant economic releases from either the Eurozone or the United States.
According to forex market experts, Israel’s strikes on Iran are stimulating a US Dollar rebound, causing the Euro to retreat against the US Dollar from its 43-month high. However, the EUR/USD pair saw a sharp decline to below 1.1520 on Friday, following the Israeli strike on Iranian nuclear facilities, amid escalating geopolitical tensions, a sharp rise in oil prices, and a decline in stock markets. According to trading experts at ING Bank, “We believe the starting point was already quite extended for this EUR/USD pair, and a return to the 1.14-1.15 range seems perfectly appropriate.”
Danske Bank noted that “the attack adds significant uncertainty to diplomacy, as US officials deny direct involvement and warn that it could hinder, or unexpectedly force, Iran into discussions.”
Overall, the Israeli strikes have added to the underlying trade and economic uncertainty. There is inevitably concern about any escalation as markets remain closed and safe-haven assets are increasingly sought. According to currency trading experts, “The geopolitical turmoil could temporarily distort the US dollar’s downward trend and weigh on risk indicators.” They also point out that “the main difference from previous confrontations between Israel and Iran is the targeting of nuclear facilities, and while crude oil production does not appear to have been affected so far, markets must add a higher risk premium given Iran’s pivotal role in global oil supplies.”
Ready to trade our Forex daily forecast? We’ve shortlisted the best forex broker list for you to check out.
“The break above $3,400 marks a clear shift in sentiment,” said Kelvin Wong, senior market analyst at OANDA. “But the market is pausing here, waiting for signals from the Fed. If we break above $3,500, it opens room for a more extended move.”
Geopolitical tensions, particularly in the Middle East, have contributed to safe-haven demand, though equity markets in Asia remained broadly resilient. This relative calm has capped gold’s upside for now. Meanwhile, the U.S. Dollar Index recovered modestly from recent lows, limiting further gains in non-yielding assets, such as gold.
Silver (XAG/USD) is trading at $36.29, just below its intraday high of $36.39, supported by similar safe-haven flows and dovish expectations from the Fed.
However, mild U.S. dollar strength and risk-on appetite in equity markets have weighed on momentum. Technical resistance at $36.52 remains a key barrier for bulls.
With the Federal Open Market Committee (FOMC) widely expected to leave interest rates unchanged, attention now turns to the language in the statement and updated economic projections.
The CME FedWatch Tool shows a 62% chance of a rate cut by September, a shift that could support gold and silver through the third quarter.
Silver prices (XAG/USD) remain close to the multi-year highs near $37.00 hit last week, despite a moderate decline in demand for safe-haven assets, like precious metals, as fears that the Israel-Iran war might turn into a regional conflict have eased.
Israel and Iran have kept exchanging missile attacks over the weekend in a war that entered its fourth day, but the conflict did not extend to other countries in the area, at least for now. Apart from that, several countries have offered their efforts to mediate between the contenders, and US President Dolanld Trump is pushing them to sit and try to reach a peace deal. All this has translated into a slightly brighter market mood, which is weighing on demand for precious metals
The technical picture remains bullish. The pair has been posting higher highs and higher lows since early June, and the correction from last week’s highs has been contained at $35.50.
The doji candles on the daily chart reflect a hesitant market at current levels, but the 4-Hour RSI remains steady above 50, highlighting the bullish trend.
On the downside, immediate support is at the $36.00 level (June 11 and 13 lows) above $35.50 (June 12 low). A bearish reaction below here would put the bullish trend into question and bring the June 4 low, at $34.20, back into play.
On the upside, the $37.00 area is the 261.8% retracement of the April-May trade range, often a target for bullish and bearish cycles. So far, however, there is no clear sign of a trend shift. Above here, the next target is the 361.8% Fibonacci extension of the same trend, at $39.10.
Silver is a precious metal highly traded among investors. It has been historically used as a store of value and a medium of exchange. Although less popular than Gold, traders may turn to Silver to diversify their investment portfolio, for its intrinsic value or as a potential hedge during high-inflation periods. Investors can buy physical Silver, in coins or in bars, or trade it through vehicles such as Exchange Traded Funds, which track its price on international markets.
Silver prices can move due to a wide range of factors. Geopolitical instability or fears of a deep recession can make Silver price escalate due to its safe-haven status, although to a lesser extent than Gold’s. As a yieldless asset, Silver tends to rise with lower interest rates. Its moves also depend on how the US Dollar (USD) behaves as the asset is priced in dollars (XAG/USD). A strong Dollar tends to keep the price of Silver at bay, whereas a weaker Dollar is likely to propel prices up. Other factors such as investment demand, mining supply – Silver is much more abundant than Gold – and recycling rates can also affect prices.
Silver is widely used in industry, particularly in sectors such as electronics or solar energy, as it has one of the highest electric conductivity of all metals – more than Copper and Gold. A surge in demand can increase prices, while a decline tends to lower them. Dynamics in the US, Chinese and Indian economies can also contribute to price swings: for the US and particularly China, their big industrial sectors use Silver in various processes; in India, consumers’ demand for the precious metal for jewellery also plays a key role in setting prices.
Silver prices tend to follow Gold’s moves. When Gold prices rise, Silver typically follows suit, as their status as safe-haven assets is similar. The Gold/Silver ratio, which shows the number of ounces of Silver needed to equal the value of one ounce of Gold, may help to determine the relative valuation between both metals. Some investors may consider a high ratio as an indicator that Silver is undervalued, or Gold is overvalued. On the contrary, a low ratio might suggest that Gold is undervalued relative to Silver.
Oracle’s stock price extended its gains in latest intraday trading, piercing the pivotal resistance of 198.30, accompanied by a surge in trading volumes, with the dominance of the main upward trend as the price trades alongside the secondary upward trend line, while boosted by trading above the 50-candle SMA, but countered with negative signals streaming out of the Stochastic after reaching overbought levels, hindering upcoming gains.
Therefore we expect more gains for the price as long as it settles above $198.30, targeting the next resistance at $246.70.
Today’s trading range: Bullish
Gold (XAU/USD) is correcting lower after rejection at the $3,440 resistance area on Friday. The pair maintains the upside structure in place, but easing fears that the Iran-Israel conflict might escalate into a regional war have undermined demand for safe havens, like Gold, in favour of riskier-perceived assets.
The war between Israel and Iran entered its fourth day with no signs of an end in sight. The worst fears, however, have not crystallized, the conflict remains limited, and US interests have not been targeted. This led to a risk rally on Monday, retracing most of Friday’s moves, and pushing Gold prices lower.
The pair is on a corrective reversal from a key resistance level at $3,440, where the top of the ascending wedge channel from mid-May lows meets the May 6 high. This is a potentially bearish figure, but technical indicators are still in positive territory.
now
The precious metal is now in a bearish correction from the mentioned $3,440, aiming to a key support level at $3,400 (June 5 high). A bearish continuation below here would bring the wedge bottom into focus, now at $3,350 and June 11 lows at $3,340.
On the upside, a confirmation above $3,440 would clear the path towards the all-time high at $3,500.
Gold has played a key role in human’s history as it has been widely used as a store of value and medium of exchange. Currently, apart from its shine and usage for jewelry, the precious metal is widely seen as a safe-haven asset, meaning that it is considered a good investment during turbulent times. Gold is also widely seen as a hedge against inflation and against depreciating currencies as it doesn’t rely on any specific issuer or government.
Central banks are the biggest Gold holders. In their aim to support their currencies in turbulent times, central banks tend to diversify their reserves and buy Gold to improve the perceived strength of the economy and the currency. High Gold reserves can be a source of trust for a country’s solvency. Central banks added 1,136 tonnes of Gold worth around $70 billion to their reserves in 2022, according to data from the World Gold Council. This is the highest yearly purchase since records began. Central banks from emerging economies such as China, India and Turkey are quickly increasing their Gold reserves.
Gold has an inverse correlation with the US Dollar and US Treasuries, which are both major reserve and safe-haven assets. When the Dollar depreciates, Gold tends to rise, enabling investors and central banks to diversify their assets in turbulent times. Gold is also inversely correlated with risk assets. A rally in the stock market tends to weaken Gold price, while sell-offs in riskier markets tend to favor the precious metal.
The price can move due to a wide range of factors. Geopolitical instability or fears of a deep recession can quickly make Gold price escalate due to its safe-haven status. As a yield-less asset, Gold tends to rise with lower interest rates, while higher cost of money usually weighs down on the yellow metal. Still, most moves depend on how the US Dollar (USD) behaves as the asset is priced in dollars (XAU/USD). A strong Dollar tends to keep the price of Gold controlled, whereas a weaker Dollar is likely to push Gold prices up.