The main category of Forex News.
You can use the search box below to find what you need.
[wd_asp id=1]
The main category of Forex News.
You can use the search box below to find what you need.
[wd_asp id=1]
GBP/USD declines sharply and trades below 1.3550 in the European session on Friday after posting its highest daily close since February 2022 on Thursday. The risk-averse market environment could make it difficult for the pair to regain its traction heading into the weekend.
The table below shows the percentage change of British Pound (GBP) against listed major currencies today. British Pound was the weakest against the US Dollar.
| USD | EUR | GBP | JPY | CAD | AUD | NZD | CHF | |
|---|---|---|---|---|---|---|---|---|
| USD | 0.57% | 0.43% | 0.42% | 0.14% | 0.81% | 1.06% | 0.41% | |
| EUR | -0.57% | -0.10% | -0.10% | -0.37% | 0.33% | 0.46% | -0.16% | |
| GBP | -0.43% | 0.10% | -0.06% | -0.35% | 0.34% | 0.55% | -0.04% | |
| JPY | -0.42% | 0.10% | 0.06% | -0.27% | 0.39% | 0.62% | -0.01% | |
| CAD | -0.14% | 0.37% | 0.35% | 0.27% | 0.65% | 0.94% | 0.31% | |
| AUD | -0.81% | -0.33% | -0.34% | -0.39% | -0.65% | 0.23% | -0.38% | |
| NZD | -1.06% | -0.46% | -0.55% | -0.62% | -0.94% | -0.23% | -0.60% | |
| CHF | -0.41% | 0.16% | 0.04% | 0.00% | -0.31% | 0.38% | 0.60% |
The heat map shows percentage changes of major currencies against each other. The base currency is picked from the left column, while the quote currency is picked from the top row. For example, if you pick the British Pound from the left column and move along the horizontal line to the US Dollar, the percentage change displayed in the box will represent GBP (base)/USD (quote).
The broad-based selling pressure surrounding the US Dollar (USD) allowed GBP/USD to gather bullish momentum on Thursday. After suffering large losses against its major rivals on weaker-than-expected Consumer Price Index (CPI) figures on Wednesday, the USD continued to weaken on Thursday as the data published by the Department of Labor showed that there were 248,000 Initial Jobless Claims in the week ending June 7, compared to the market forecast of 240,000.
Early Friday, safe-haven flows started to dominate the action in financial markets after Israel’s Prime Minister Benjamin Netanyahu announced that they have launched “Operation Rising Lion,” targeting Iran’s nuclear infrastructure, ballistic missile factories and its military capabilities. In response, Iran’s Armed Forces General staff said that Israel and the US will “pay a very heavy price.”
The USD seems to be benefiting from the flight to safety, causing GBP/USD to push lower. The US economic calendar will feature the University of Michigan’s preliminary Consumer Sentiment Index for June. Investors are likely to pay little to no attention to this data and remain focused on the developments surrounding the Israel-Iran conflict. Unless there is a de-escalation, market participants could stay away from risk-sensitive assets.
The Relative Strength Index (RSI) indicator on the 4-hour chart stays slightly below 50 and GBP/USD trades near the 20-period and the 50-period Simple Moving Averages (SMA), reflecting the loss of bullish momentum.
On the downside, the 100-period SMA forms the immediate support level at 1.3520 before 1.3460 (static level) and 1.3420 (200-period SMA). Looking north, resistance levels could be spotted at 1.3600 (mid-point of the ascending channel), 1.3630 (static level) and 1.3700 (static level, round level).
The Pound Sterling (GBP) is the oldest currency in the world (886 AD) and the official currency of the United Kingdom. It is the fourth most traded unit for foreign exchange (FX) in the world, accounting for 12% of all transactions, averaging $630 billion a day, according to 2022 data.
Its key trading pairs are GBP/USD, also known as ‘Cable’, which accounts for 11% of FX, GBP/JPY, or the ‘Dragon’ as it is known by traders (3%), and EUR/GBP (2%). The Pound Sterling is issued by the Bank of England (BoE).
The single most important factor influencing the value of the Pound Sterling is monetary policy decided by the Bank of England. The BoE bases its decisions on whether it has achieved its primary goal of “price stability” – a steady inflation rate of around 2%. Its primary tool for achieving this is the adjustment of interest rates.
When inflation is too high, the BoE will try to rein it in by raising interest rates, making it more expensive for people and businesses to access credit. This is generally positive for GBP, as higher interest rates make the UK a more attractive place for global investors to park their money.
When inflation falls too low it is a sign economic growth is slowing. In this scenario, the BoE will consider lowering interest rates to cheapen credit so businesses will borrow more to invest in growth-generating projects.
Data releases gauge the health of the economy and can impact the value of the Pound Sterling. Indicators such as GDP, Manufacturing and Services PMIs, and employment can all influence the direction of the GBP.
A strong economy is good for Sterling. Not only does it attract more foreign investment but it may encourage the BoE to put up interest rates, which will directly strengthen GBP. Otherwise, if economic data is weak, the Pound Sterling is likely to fall.
Another significant data release for the Pound Sterling is the Trade Balance. This indicator measures the difference between what a country earns from its exports and what it spends on imports over a given period.
If a country produces highly sought-after exports, its currency will benefit purely from the extra demand created from foreign buyers seeking to purchase these goods. Therefore, a positive net Trade Balance strengthens a currency and vice versa for a negative balance.
Gold (XAU/USD) appreciates for the third consecutive day on Friday, and is on track for a weekly rally beyond 3%. Israel’s attack on Iran has crushed an already fragile market sentiment on Friday, triggering a rush for safety that has boosted Gold and all the traditional safe assets.
Israel attacked Iran with unprecedented strength earlier on Friday, pounding nuclear sites and killing high-ranking Revolutionary Guard Officials. Iran retaliated with a drone attack and leaving the nuclear negotiations with the US. Fears of a full-blown war in the region have fuelled an intense risk-off mood.
Technical indicators are pointing higher again. RSI studies in the 4-hour chart are high but still below overbought territory. The fundamental background is supportive, despite generalised USD strength, and bearish attempts remain limited so far.
The precious metal is trading at the top of a wedge pattern with trendline resistance at $3,425 is holding bears ahead of the May 6 high, at $3,440. Bulls need to clear these levels before shifting their focus to the $3,495 all-time high hit in late April.
On the downside, bears are being held above the $3,400 previous resistance (Jun 5 high). A pullback below here would bring the June 12 low and the bottom of the wedge pattern, both around $3,345, into focus.
Gold has played a key role in human’s history as it has been widely used as a store of value and medium of exchange. Currently, apart from its shine and usage for jewelry, the precious metal is widely seen as a safe-haven asset, meaning that it is considered a good investment during turbulent times. Gold is also widely seen as a hedge against inflation and against depreciating currencies as it doesn’t rely on any specific issuer or government.
Central banks are the biggest Gold holders. In their aim to support their currencies in turbulent times, central banks tend to diversify their reserves and buy Gold to improve the perceived strength of the economy and the currency. High Gold reserves can be a source of trust for a country’s solvency. Central banks added 1,136 tonnes of Gold worth around $70 billion to their reserves in 2022, according to data from the World Gold Council. This is the highest yearly purchase since records began. Central banks from emerging economies such as China, India and Turkey are quickly increasing their Gold reserves.
Gold has an inverse correlation with the US Dollar and US Treasuries, which are both major reserve and safe-haven assets. When the Dollar depreciates, Gold tends to rise, enabling investors and central banks to diversify their assets in turbulent times. Gold is also inversely correlated with risk assets. A rally in the stock market tends to weaken Gold price, while sell-offs in riskier markets tend to favor the precious metal.
The price can move due to a wide range of factors. Geopolitical instability or fears of a deep recession can quickly make Gold price escalate due to its safe-haven status. As a yield-less asset, Gold tends to rise with lower interest rates, while higher cost of money usually weighs down on the yellow metal. Still, most moves depend on how the US Dollar (USD) behaves as the asset is priced in dollars (XAU/USD). A strong Dollar tends to keep the price of Gold controlled, whereas a weaker Dollar is likely to push Gold prices up.
Copper price neediness to the momentum in the last trading led to delay the bullish attempts, to notice its fluctuations below the barrier near $4.8100, and providing an intraday negative rebound at $4.7100.
Note that the price success to settle above 50% Fibonacci correction level at $4.6600 will assist to reinforce the chances for activating the bullish track until breaching the mentioned barrier, while breaking this support will increase the negative pressure on the current trading, which force it to suffer extra losses by reaching $4.6000 and $4.5300.
The expected trading range for today is between $4.6600 and $4.8100
Trend forecast: Fluctuated within the bullish track
Copper price neediness to the momentum in the last trading led to delay the bullish attempts, to notice its fluctuations below the barrier near $4.8100, and providing an intraday negative rebound at $4.7100.
Note that the price success to settle above 50% Fibonacci correction level at $4.6600 will assist to reinforce the chances for activating the bullish track until breaching the mentioned barrier, while breaking this support will increase the negative pressure on the current trading, which force it to suffer extra losses by reaching $4.6000 and $4.5300.
The expected trading range for today is between $4.6600 and $4.8100
Trend forecast: Fluctuated within the bullish track
Copper price neediness to the momentum in the last trading led to delay the bullish attempts, to notice its fluctuations below the barrier near $4.8100, and providing an intraday negative rebound at $4.7100.
Note that the price success to settle above 50% Fibonacci correction level at $4.6600 will assist to reinforce the chances for activating the bullish track until breaching the mentioned barrier, while breaking this support will increase the negative pressure on the current trading, which force it to suffer extra losses by reaching $4.6000 and $4.5300.
The expected trading range for today is between $4.6600 and $4.8100
Trend forecast: Fluctuated within the bullish track
He noted that the demand for gold is being bolstered by “a blend of risk aversion and a recalibration of monetary policy expectations.”
The Producer Price Index (PPI) rose just 0.1% in May, down from a 0.2% decline in April, signaling persistent disinflationary trends.
Combined with soft consumer price data, markets are now pricing in a 55-basis-point rate cut by the Federal Reserve in 2025, likely starting in September.
U.S. Treasury yields retreated, and the Dollar Index (DXY) hovered near a three-month low, supporting non-yielding gold.
Silver (XAG/USD) is trading at $36.30, having slipped to an intraday low of $35.98. The metal is consolidating within a symmetrical triangle pattern, suggesting price compression as traders await a directional breakout.
While gold has surged on haven flows, silver’s upside remains capped by lingering concerns around industrial demand and global manufacturing trends.
Gold price is gaining roughly 1.50% in Asian trading on Friday, underpinned by intense flight to safety amid escalating geopolitical tensions between Israel and Iran.
Israel said earlier on that it attacked Iranian nuclear targets to block Tehran from developing atomic weapons.
Several Iranian media outlets now claim that Iran will declare a war on Israel and retaliate “soon.”
Iran’s Armed Forces General staff responded on Friday, warning that Israel and the US will “pay a very heavy price”.
Against this backdrop, US President Donald Trump has convened a meeting of the National Security Council in the White House situation room later in the day at 15 GMT.
Investors run for cover in the traditional safe-haven assets such as Gold price, the US Treasury bonds and the Japanese Yen (JPY) in times of market panic and uncertainty.
Therefore, the ultimate store of value, Gold price, is seeing unabated demand as it extends its winning streak into a third consecutive day on Friday, sitting at the highest level in seven weeks.
Gold buyers now aim for the record high of $3,500 if the Mid East conflict intensifies, with Iran initiating a harsh response to the Israeli pre-emptive strikes on Iran’s main enrichment facility in Natanz.
However, the strengthening haven demand for the US Dollar (USD) could impede Gold price rally.
Markets shrug off the latest trade headlines as geopolitics dominate alongside risk-off flows.
Reuters reported that tariffs on a range of imported household appliances, which are currently at 50% for most countries, would take effect on an additional range of “steel derivative products” on June 23.
Looking ahead, all eyes will remain on Iran’s probable retaliation to the Israeli strikes and the US’ response to the Middle East conflict.
The University of Michigan (UoM) Consumer Sentiment and Inflation Expectations could play second fiddle to the geopolitical headlines.
Markets ramp up odds for a US Federal Reserve (Fed) interest rate cut in September following softer-than-expected US Consumer Price Index (CPI) and Producer Price Index (PPI) data released earlier in the week.
Having closed Thursday above the critical resistance at $3,377, the 23.6% Fibonacci Retracement (Fibo) level of the April record rally, Gold price solidified its bullish momentum on Friday.
The 14-day Relative Strength Index (RSI) holds firm above the midline, currently near 62, suggesting that there is more room for the upside.
The next stiff resistance is spotted at the $3,450 psychological level, above which the lifetime high of $3,500 will be threatened.
On the downside, the immediate support is aligned at the $3,400 threshold, below which the resistance-turned-support of the 23.6% Fibo level at $3,377 will come into play.
Deeper declines will likely challenge the 21-day Simple Moving Average (SMA) of $3,325.

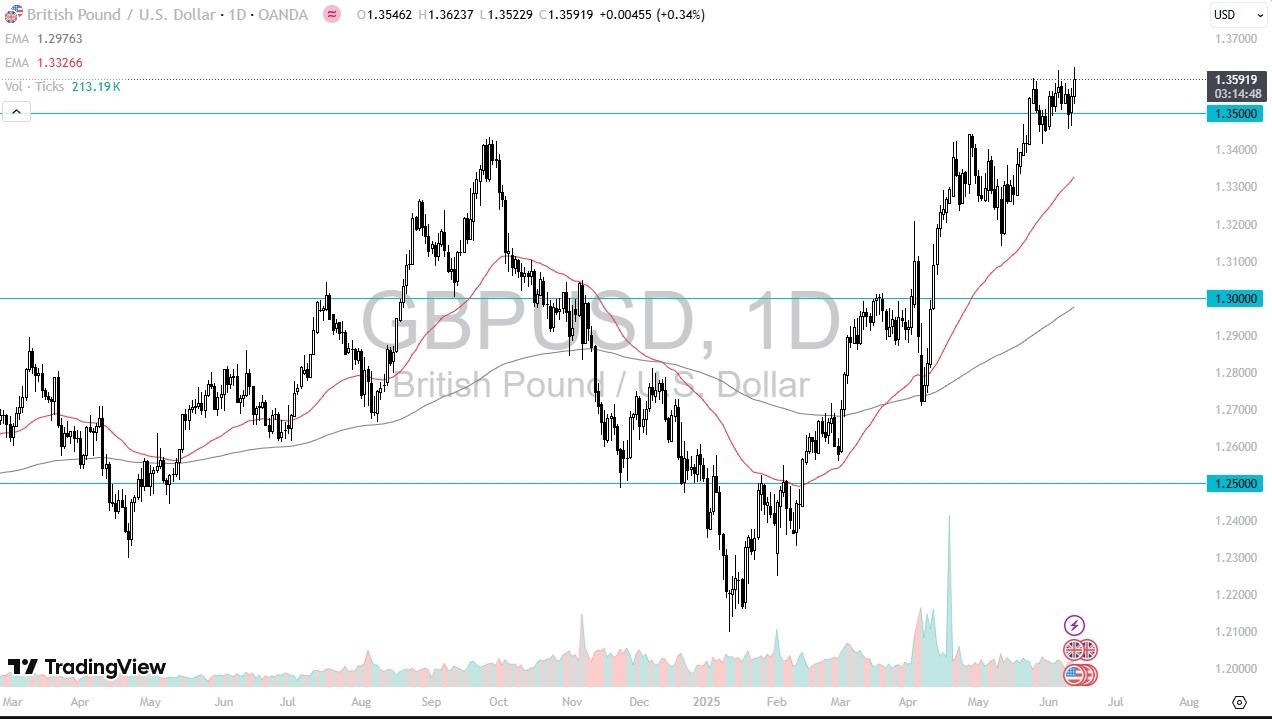
So, the question now is, can we continue to go higher? We are right here at an area that previously had been a bit of a headache. So, I think short-term pullbacks probably attract attention that people are willing to pay to the British pound. It’s been a fairly decent mover against the US dollar for some time now, even though it was falling, it was falling less than other currencies.
So, I would anticipate that the British pound probably continues to be a currency that should outperform the US dollar and outperform other currencies against the US dollar. That being said, we are a little stretched and it does look like we are going a little bit sideways more than anything else. So do keep that in mind. In this environment, I think the 1.35 level offers support down to the 1.34 level.
Underneath there you have the 50 day EMA. I don’t really have any interest in shorting this market, although I’m the first one to say that we are oversold in the US dollar. But the reality here is that we definitely see a bullish market, so drops have to be thought of as potential value.
Ready to trade the GBP/USD Forex analysis? Check out the best forex trading company in UK worth using.
Christopher Lewis has been trading Forex and has over 20 years experience in financial markets. Chris has been a regular contributor to Daily Forex since the early days of the site. He writes about Forex for several online publications, including FX Empire, Investing.com, and his own site, aptly named The Trader Guy. Chris favours technical analysis methods to identify his trades and likes to trade equity indices and commodities as well as Forex. He favours a longer-term trading style, and his trades often last for days or weeks.
Fears pushed Gold towards the $3,400 level on Thursday, its highest for the week. Demand for the bright metal surged amid US Dollar’s (USD) sell-off, which dominated financial boards for most of the day.
The Greenback declined on Wednesday after the United States (US) President, Donald Trump, anticipated a trade deal with China was “done,” clarifying it was still subject to Chinese President Xi Jinping’s approval. Additionally, the country released the May Consumer Price Index (CPI), which resulted in softer than anticipated, fueling optimism about the state of the US economy.
The USD kept falling on Thursday amid rising Middle East tensions between Israel and Iran. Israel is preparing an operation against Iran, with the US expecting retaliatory measures, according to sources familiar with the matter. Additionally, nuclear talks between the US and Iran appeared to have halted. Trump used Truth Social to report that an Israeli strike could “very well happen,” adding that he would love to avoid conflict, but also that Iran has to negotiate toughly. He ended his post saying that there’s a chance of a massive conflict in the region.
Trade-war-related headlines added fuel to the fire: Trump said that he was willing to extend the July 8 deadline for completing trade talks, but also added that he is ready to impose unilateral tariffs within two weeks, to multiple trading counterparts.
On Friday, the focus will be on the preliminary estimate of the June University of Michigan’s (UoM) Consumer Sentiment Index. Market players will pay special attention to the one-year and five-year inflation expectations.
Technically speaking, the XAU/USD pair has room to extend its advance beyond the $3,400 mark, which should lead to a rest of record highs in the near term. The daily chart shows the pair advanced at a moderate pace, with technical indicators aiming marginally higher within positive levels. At the same time, the 20 Simple Moving Average (SMA) gains upward traction above also bullish 100 and 200 SMAs, while providing dynamic support at around $3,318.
In the near term, and according to the 4-hour chart, the XAU/USD pair is losing its bullish momentum. Technical indicators turned lower, easing within positive levels, as a result of the ongoing retracement. Additional losses, however, seem unlikely, given that moving averages extend their upward slopes below the current level, and with the 20 SMA accelerating north above the longer ones.
Support levels: 3,362.40 3,348.35 3,310.00
Resistance levels: 3,402.50 3,414.60 3,437.85
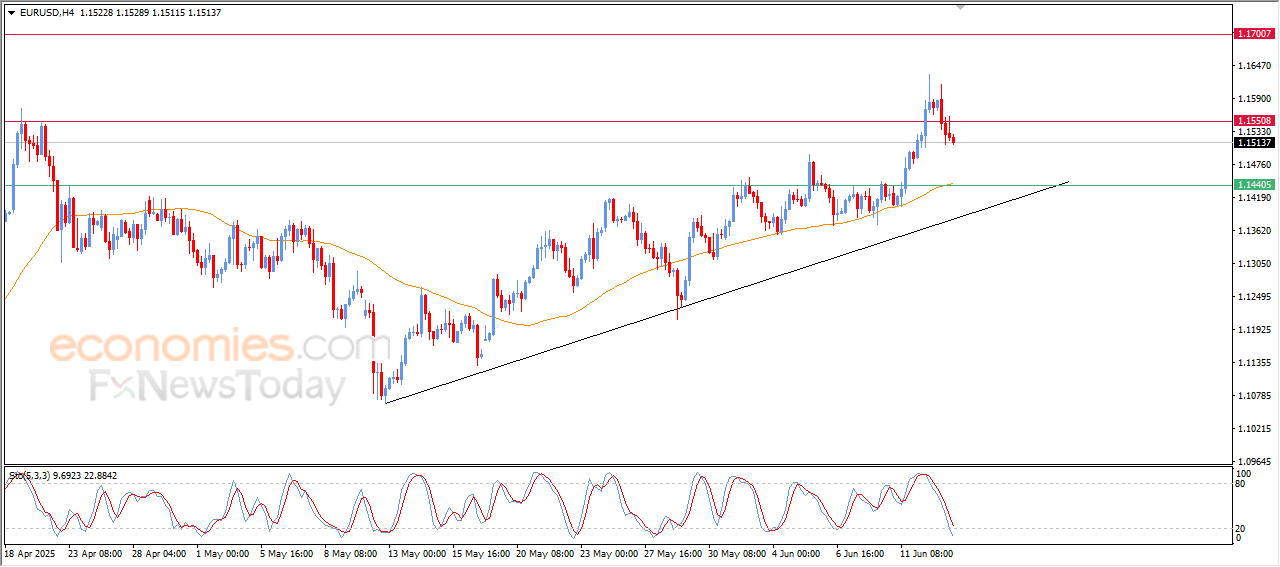
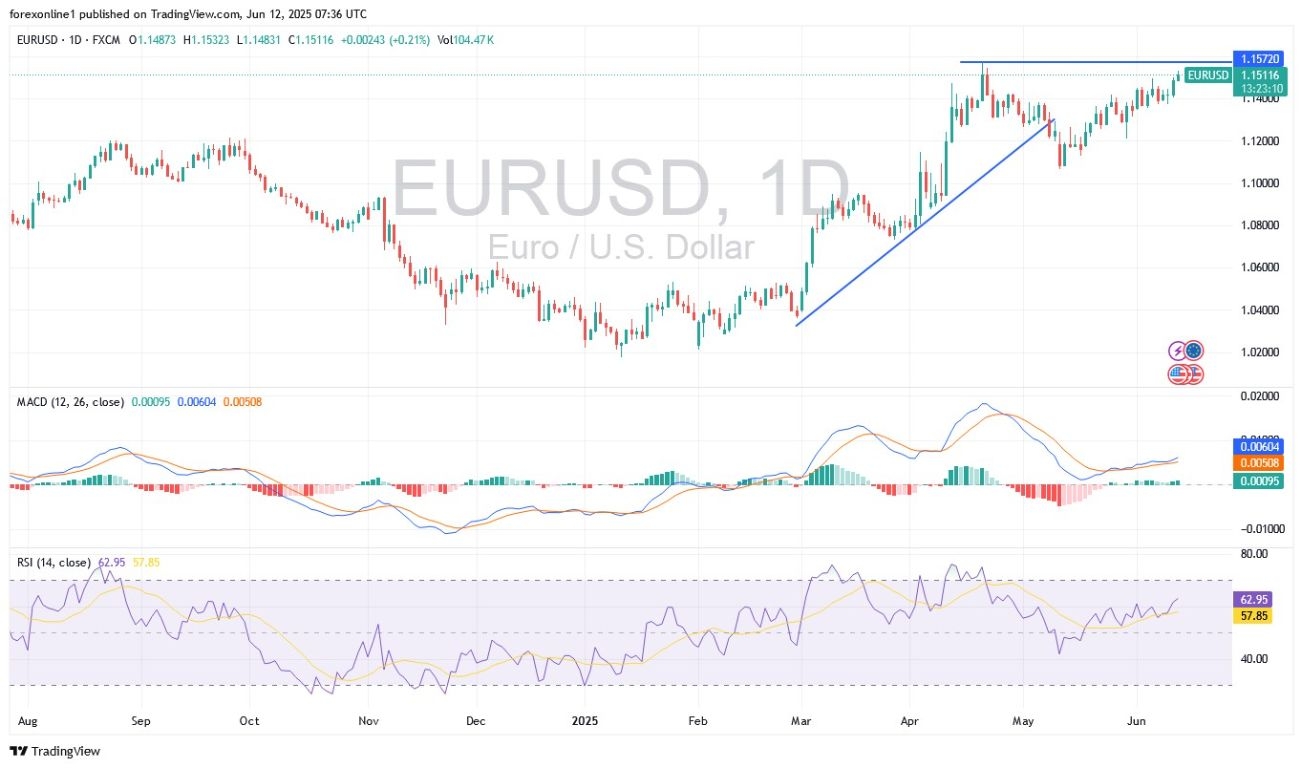
Following the release of US inflation figures, the EUR/USD currency pair surged to the doorstep of the 1.1500 resistance, nearing its highest levels since June 2021. The Euro’s gains against the US Dollar intensified as investors assessed the growing divergence in monetary policy expectations between the European Central Bank (ECB) and the US Federal Reserve. Recent statements from ECB officials have reinforced expectations that the central bank may soon pause its monetary easing cycle, adopting a wait-and-see approach to evaluate the economic impact of new US tariffs. In May, Eurozone inflation fell to 1.9%, while the ECB cut its interest rate for the eighth consecutive time, bringing the deposit facility rate down to 2%.
Meanwhile, the European bloc’s economy has shown resilience, growing by 0.6% in the first quarter, the strongest pace since the third quarter of 2022.
Conversely, weaker-than-expected US inflation data weighed on the dollar, reinforcing speculation that the Federal Reserve could begin cutting interest rates as early as September. However, uncertainty remains, as inflation and the labour market remain relatively resilient, while headwinds to growth from tariffs continue to mount.
Dear reader, according to forex market experts, overall market volatility has decreased with narrower trading ranges, but financial markets remain highly cautious that underlying tensions could quickly ignite a new round of turmoil. On another note, trade negotiations will continue, and another important US Treasury bond auction is scheduled for later today following the latest inflation data. Markets are also monitoring political developments, including the US administration’s reaction to the Los Angeles protests and potential threats to the Federal Reserve’s independence.
We still recommend selling the Euro against the US Dollar on every upward rebound, while continuously monitoring market influencing factors and avoiding risk, regardless of how strong the trading opportunities may seem.
Amidst these factors, the EUR/USD pair appears to have entered a trading range, likely between 1.1330 and 1.1495. Generally, the US Dollar will largely determine the EUR/USD’s direction today, with some potential support near 1.1400. There’s a possibility for it to rise above 1.1500 if pressure on the US Dollar continues. The next key resistance will be 1.1575, which would push technical indicators towards strong overbought levels, particularly the 14-day RSI (Relative Strength Index) and the MACD (Moving Average Convergence Divergence) indicator. The EUR/USD pair will be influenced by remaining US inflation figures, weekly US jobless claims data (all due at 3:30 PM Egypt time), and the future of US-China trade negotiations.
According to the insights and forecasts of global currency market experts, the Euro is expected to rise to its highest level against the US Dollar since 2021 this year. This conclusion comes from analysts at two major investment banks who have revised their mid-year currency market forecasts. Looking ahead to the second half of 2025, Nomura anticipates that the Euro will benefit from shifts in asset allocation and divergences in fiscal, monetary, and foreign exchange policies. This call comes amid a significant re-evaluation of US economic prospects by international investors, who have become more cautious under a potential second Trump presidency.
At the same time, questions regarding the Federal Reserve’s independence have been raised following repeated attacks from Trump. Meanwhile, his new spending and tax bill – the “Big, Beautiful Bill” – promises to increase the US debt burden, including a provision for special taxes on foreign investors. And of course, there is significant uncertainty on the trade front, with a sharp increase in tariffs. Accordingly, Morgan Stanley predicts that US trade and increasing fiscal policy uncertainty will keep the US Dollar risk premium elevated, and the steepening or flattening of the US yield curve contributes to the weakening of the US Dollar against its counterparts like the Euro.
On another note, Relative stability in Europe, coupled with Germany’s commitment to infrastructure and defence investments, is making the euro an alternative destination for foreign investors. Accordingly, Morgan Stanley added, “We maintain our bullish recommendation on the EUR/USD pair.”
Ready to trade our Forex daily forecast? We’ve shortlisted the best forex broker list for you to check out.