The main category of Forex News.
You can use the search box below to find what you need.
[wd_asp id=1]
The main category of Forex News.
You can use the search box below to find what you need.
[wd_asp id=1]
June 15, 2025 – Written by Frank Davies
STORY LINK Euro to Dollar Forecast: 1.16 by 2026, 1.20 by 2027 say Investment Bank
Commerzbank forecasts that the Euro to Dollar exchange rate (EUR/USD) will advance to 1.16 at the end of this year and 1.20 by the end of 2026.
Morgan Stanley expects stronger EUR/USD gains to 1.25 by the second quarter of 2026.
The dollar was subjected to renewed selling during the week with the currency index sliding to the lowest level since February 2022. In this environment, EUR/USD surged to 43-month highs above 1.16.
The US currency did secure a reprieve late in the week as risk appetite dipped and oil prices surged after Israel attacked Iran’s nuclear facilities. EUR/USD retreated to near 1.15, but with strong buying on dips.
ING expects caution will prevail initially; “The key difference from previous Israel-Iran standoffs is that nuclear facilities have now been targeted, and while oil production does not seem to be affected just yet, markets have to add in a bigger risk premium given the crucial role of Iran in global oil supply.”
The latest US inflation data was weaker than expected with core consumer prices increasing 0.1% in May with the year-on-year increase held at 2.8%.
Markets remain confident that the Federal Reserve will not cut interest rates at this week’s meeting, but with greater confidence in significant cuts later in the year.

According to Commerzbank; “While it is unlikely that Trump will dismiss Fed Chair Powell before the end of his term, he may nominate a Fed chairman more in line with his views next year.”
Markets are still fretting over the impact of tariffs and tensions will increase during the reminder of June.
Aviva Investors senior economist Vasileios Gkionakis noted the structural concerns as investors fret about persistent fiscal deficits, weakening foreign demand for government debt, and institutional uncertainty.
He added; “The US has been enjoying a significant privilege for decades. This is now shifting, with the US likely to run large fiscal deficits for years and against a backdrop of an extended net international investment position.”
ABN looked at multiple risks contained in the proposed Budget Bill.
According to the bank; “The overall impact on the economy would not be favorable, and the repercussions for financial markets could be significantly worse. This reputational damage has arguably been a major factor driving the dollar’s devaluation in recent months.”
Morgan Stanley commented; “We think that this weakening trend continues, and we now forecast the DXY to fall an additional 9% over the next 12 months to 91, with USD weakness most pronounced against its safe-haven peers – EUR, JPY, and CHF.”

Investment banks also see scope for further inflows into the Euro area.
BNP Paribas has calculated that if Dutch and Danish pension funds reduce dollar exposure to 2015 levels as a share of total assets under management, they have a further $217 billion to sell.
HSBC added; “Dutch pension funds are the largest in the EU and their investment behaviour often indicates broader European investment flows. If European investors continue to increase FX hedge ratios, it will likely provide further support to EUR-USD.”
BNP also agrees that ECB policy is close to turning and is positive on the Euro; “Our analysis suggests there is much more still to come.” It maintains a EUR/USD target of $1.20.
Commerzbank noted; “our economists expect the German fiscal package to provide a significant boost in the coming year. After many years of struggling, this should encourage investors to take a closer look at the euro area again, which should benefit the euro.”
International Money Transfer? Ask our resident FX expert a money transfer question or try John’s new, free, no-obligation personal service! ,where he helps every step of the way,
ensuring you get the best exchange rates on your currency requirements.
I wrote on 8th June that the best trades for the week would be:
The overall win of 0.78% equals a loss of 0.26% per asset.
Last week was basically mildly risk-on, with stock markets rising and the US Dollar falling on more positive than expected US inflation, PPI and consumer sentiment data. However, all that changed in the early hours of Friday in the Middle East as news broke of a very strong Israeli strike on Iran’s key military figures and its nuclear materials and scientists. This sent markets into a risk-off direction.
The Israeli strike has led to what could be described as all-out war between Israel and Iran, with Iran firing powerful ballistic missiles at Israeli population centers, and Israel in turn hitting hard at the military, the nuclear program, and increasingly at Iranian oil facilities.
This war has been long awaited, and it seems clear that the Israeli attack was acquiesced in by the Americans, who so far at least are not helping with offensive actions, although they are likely assisting in Israel’s strong antimissile defense, which is continuing to intercept over 90% of projectiles. However, the missiles which get through cause serious damage and fatalities, although at a level the Israeli public can probably accept, at least for a few more days or weeks.
It seems clear that the Iranian regime and nuclear program is in serious jeopardy, the nuclear program more so, and Iran has a limited supply of perhaps 2,000 ballistic missiles that it may not be able to replenish. The big question is whether the Americans will join in the drive to destroy Iran’s nuclear program, or whether Iran might sue for a negotiated settlement that would be acceptable to the USA.
The progress of the resolution of these questions is likely to be the major factor influencing markets over the coming week, but there are also major central bank meetings that could impact several G7 currencies.
Last week’s most important data releases were:

The coming week has some very high-impact data releases, including policy meetings at four major central banks, which can significantly affect the Forex market.
This week’s important data points, in order of likely importance, are:
The most impactful events on the Forex market will likely be the top five items.
The comments from the central banks will be closely watched, and the only rate change that is widely expected to happen will be at the SNB, which is likely to be cut by 0.25%.
Thursday is a public holiday in the USA and New Zealand.
For the month of June 2025, I forecasted that the EUR/USD currency pair would increase in value. The performance of this forecast so far is:

As there were no unusually large price movements in Forex currency crosses over the past week, I make no weekly forecast.
The Euro was the strongest major currency last week, while the US Dollar was the weakest. Volatility increased last week, with 26% of the most important Forex currency pairs and crosses changing in value by more than 1%. Next week’s volatility is likely to be higher as we will get several major central bank policy releases.
You can trade these forecasts in a real or demo Forex brokerage account.

Last week, the US Dollar Index printed a bearish candlestick which made the lowest weekly close since February 2022. There is clearly a long-term bearish trend in the US Dollar. Bulls have two reasons to hope for higher prices though:
I think it makes sense to be trading in line with the long-term trend which will be short of the greenback, but only after the price has either got established below the support level at 97.67, or alternatively if the price is rejecting a key resistance level above, but the latter scenario is extremely unlikely to play out this week.

The EUR/USD currency pair reached a new 3.5 year high last week, well above the big round number at $1.1500, before giving back some gains on Friday as news emerged of the outbreak of war between Israel and Iran. The Euro was the strongest major currency last week while the US Dollar was the weakest.
A minor factor against bulls is that the resistance level at $1.1569 has continued to hold.
It seems unlikely that even if the war escalates, that the US Dollar will gain strongly, so I have faith in the long-term bullish trend here. This currency pair has an excellent record of respecting the long-term trend, so I am happy to be long here over the coming week.

Gold in US Dollar terms made its highest ever daily close last Friday, but only by a very small amount. This is basically bullish, but looking at the daily chart below, you could say that the price action is only testing a triple top.
The primary precious metal got a boost Friday from the outbreak of war between Israel and Iran, which triggered a flight into safe havens, although not an especially strong one.
It seems unlikely that the war will end any time soon, and there has been a strongly bullish long-term trend for a long time, so being long of Gold over this week will probably be a good bet.
More cautious traders might want to wait for another bullish breakout, maybe even above the record high just below $3,500.

Silver in US Dollar terms again reached a new thirteen-year high last week, above $36 per ounce, but a look at the weekly candlestick shows that it is a doji, which typically signifies indecision. Nevertheless, there is a clearly strong bullish trend in precious metals generally, although silver was rising even before Gold made its major upwards movement.
I am not strongly optimistic that Silver will rise further this week, but it seems more likely to rise than fall.
More cautious traders might want to wait for a new long-term high to be reached, or at least a strong daily close, before entering a new long trade here.

Looking at the daily price chart for WTI Crude Oil below, a lot of interesting and bullish things can be seen:
Of course, crude oil got a major boost Friday as news emerged of what is frankly the outbreak of all-out war between Israel and Iran. This long-anticipated hot conflict outbreak has dramatically pushed up the price of crude oil, as can be seen in Friday’s candlestick. However, bulls might want to beware the large upper wick as crude oil gave up some of its gains later in the day.
There is despite the potential blow-off top another reason to be even more bullish: since markets closed Friday, Israel has begun hitting Iranian energy targets, trying to establish an equation between deliberate Iranian fire on Israeli population centers and the destruction of Iran’s oil production capability.
I think Crude Oil is likely to rise over the coming week, although if a diplomatic solution to the war is found soon – which seems very unlikely – the price would drop dramatically.
I prefer to wait for a new 6-month high close before going long of WTI Crude Oil, so I will only enter a new long trade after a daily close above $80.43.

I see the best trades this week as:
Ready to trade our weekly Forex forecast? Check out our list of the top 10 Forex brokers in the world.
WTI crude oil is surging amid escalating geopolitical tensions, with Israel’s recent strikes on Iran fueling a rally that pushed prices above the $74.00 handle on Friday. At the time of writing, WTI is trading just below $72.00 after Iran responded with its own missile barrage, marking a near 20% gain for June and reversing much of the weakness observed earlier this year.
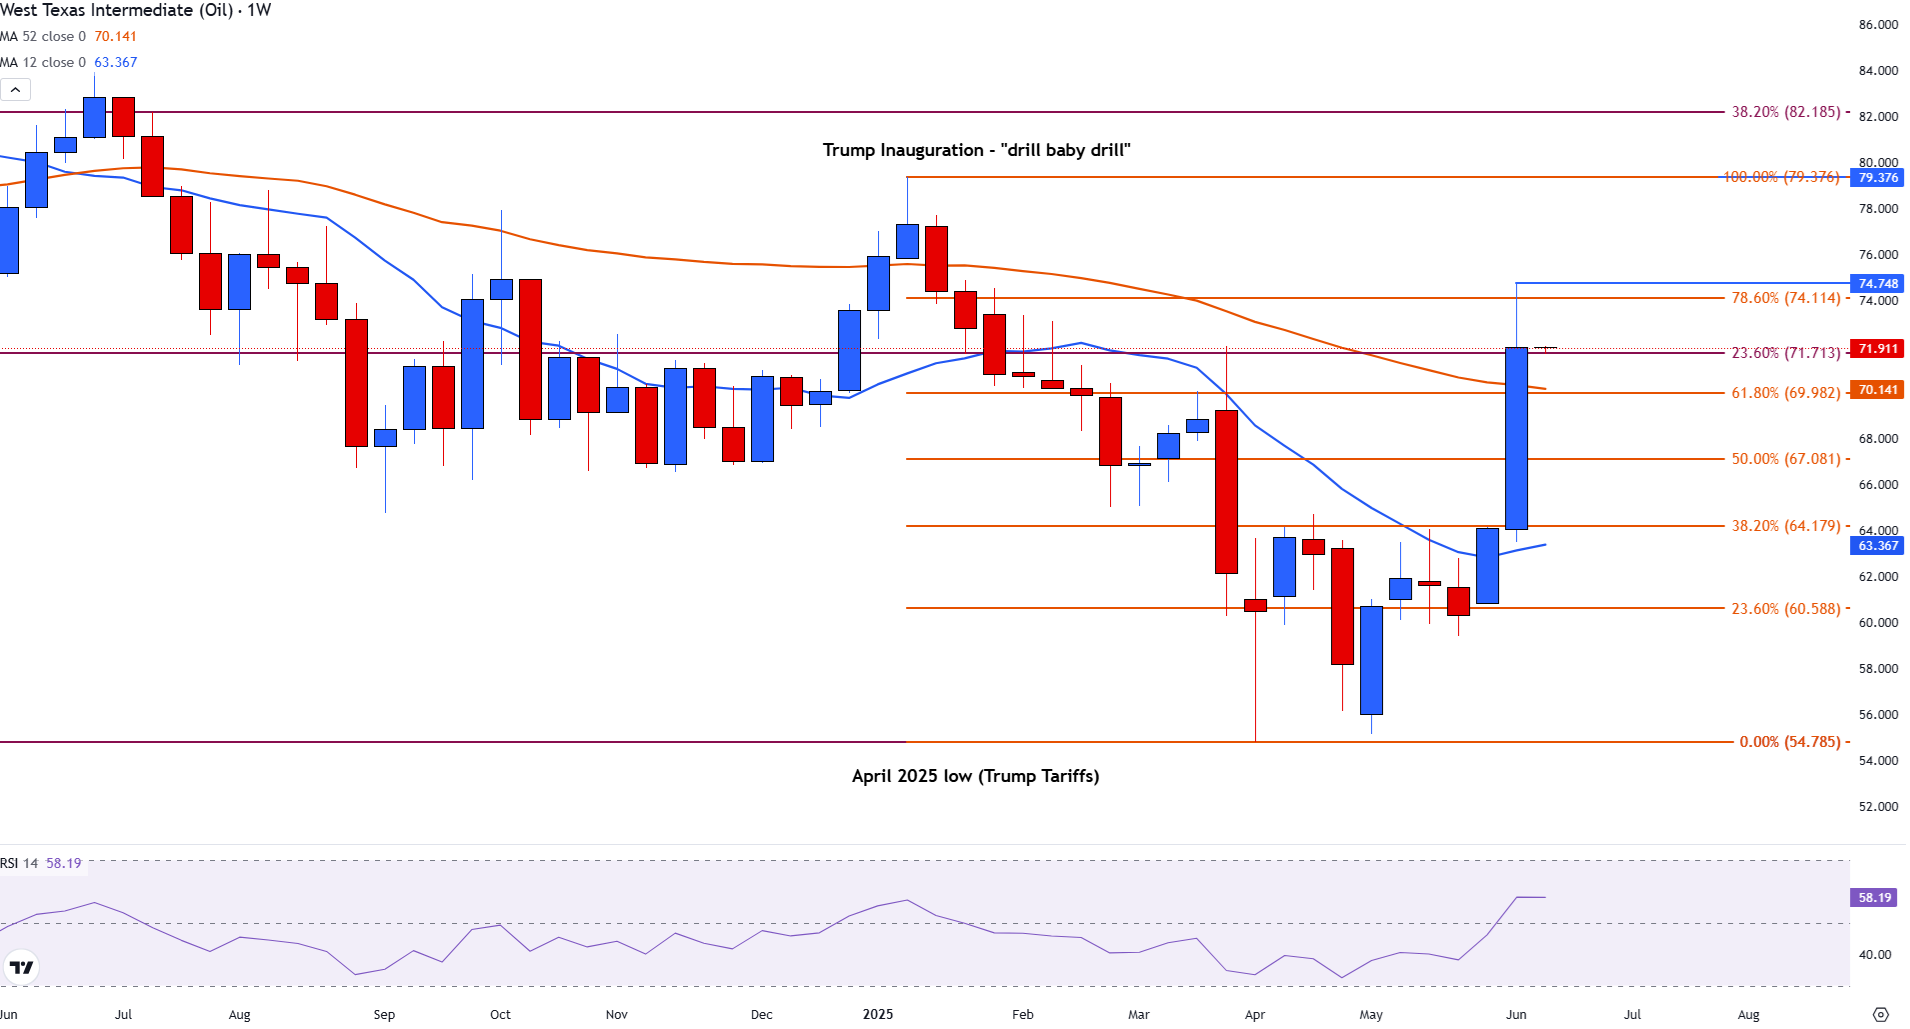
Despite broad-based pressure in the first half of 2025, the recent price surge has lifted WTI back above several key technical levels, with bullish momentum building across multiple timeframes.
From a longer-term perspective, WTI has reclaimed the 12-month Simple Moving Average (SMA), currently sitting at $69.46. This level now serves as dynamic support. Above, resistance is forming at the 23.6% Fibonacci retracement of the March 2022 high to the April 2025 low, located at $71.71.
WTI Oil Monthly Chart
On the weekly chart, WTI broke above the 12-week SMA at $63.29 following the Iran-Israel escalation, marking a pivotal shift in sentiment. This surge has brought prices up to the 78.6% Fibonacci retracement of the January–April decline at $74.11. The 12-week SMA continues to offer support near $63.31, underlining a strong base for bulls.
WTI Oil Weekly Chart
Zooming into the daily chart, Friday’s bullish momentum drove a decisive move above both the 100-day and 200-day SMAs, strengthening the case for further upside. Technical confluence with long-term Fibonacci levels adds credibility to the breakout.
The Relative Strength Index (RSI) on the daily timeframe currently sits at 76, signaling overbought conditions. However, with the geopolitical backdrop intensifying, fundamental support may ultimately prevail over short-term exhaustion.
WTI Oil Daily Chart
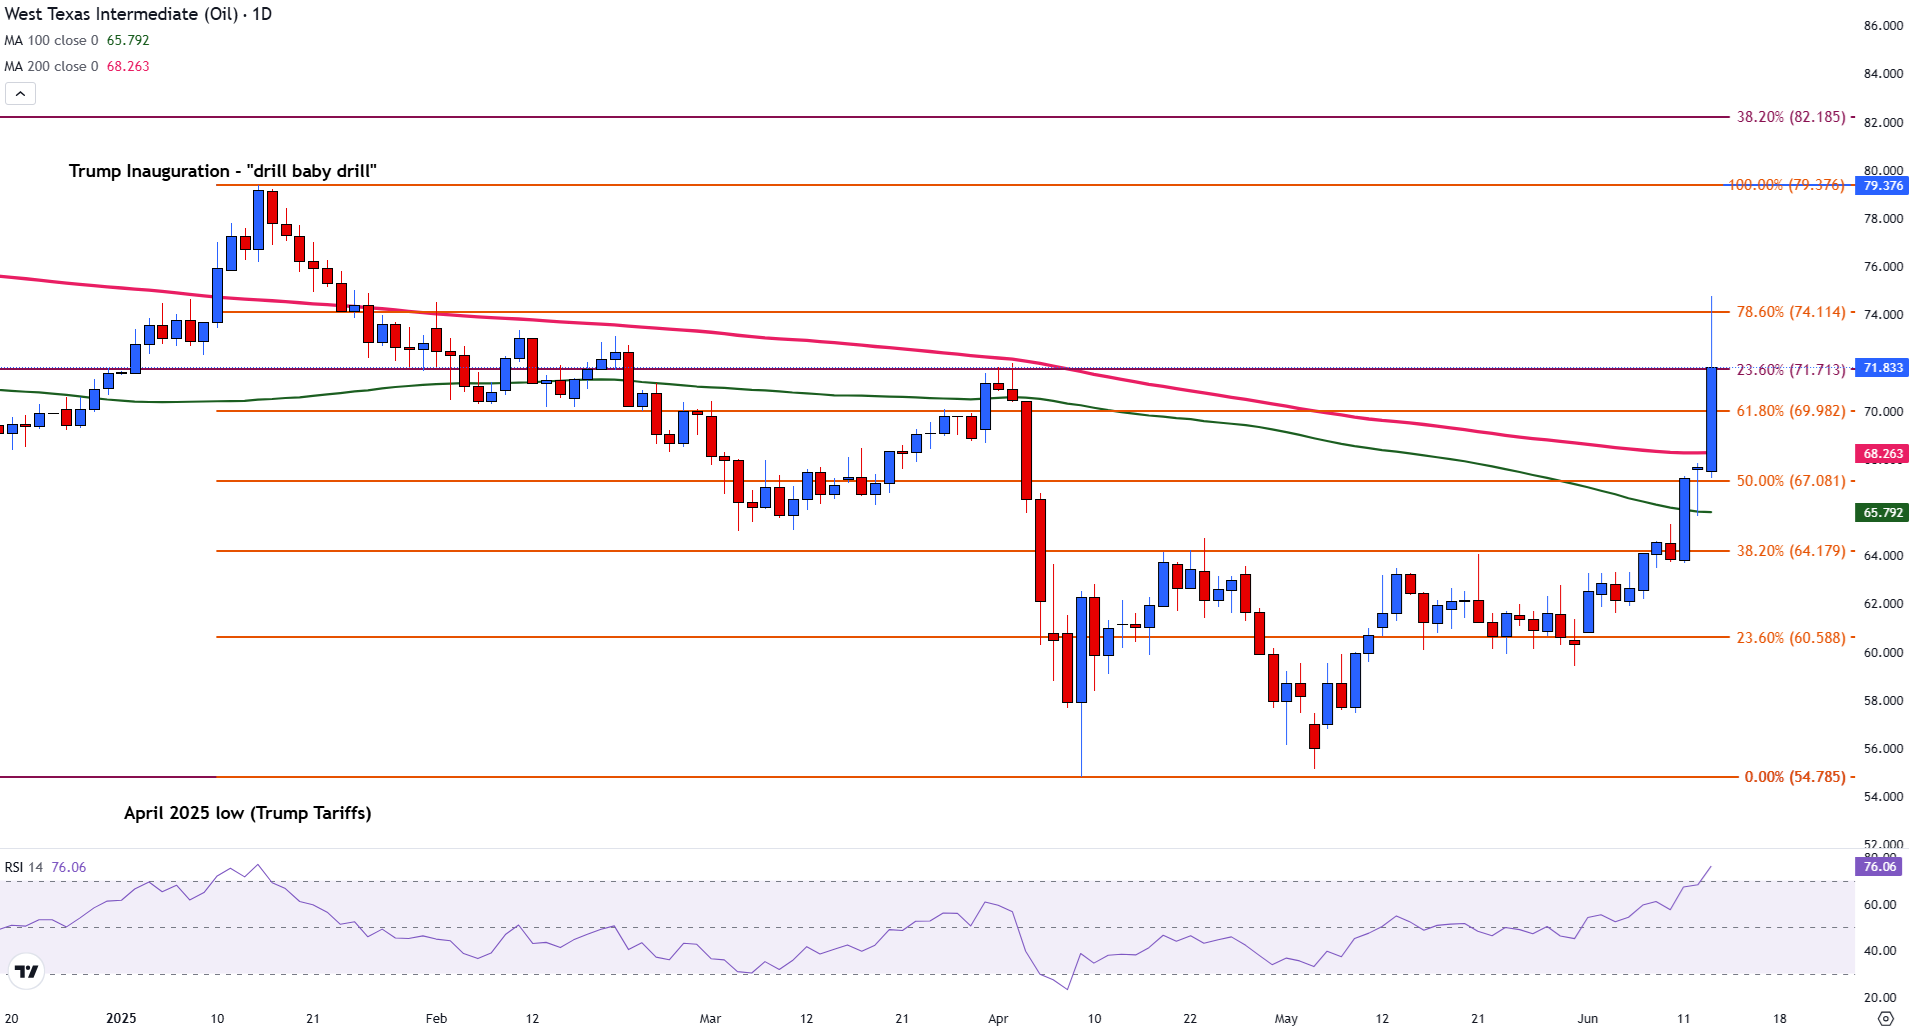
If WTI breaks and holds above $74.11 early next week, momentum could carry it toward $76.00 and eventually $78.00. Conversely, failure to maintain levels above $71.71 may trigger a retracement, especially if geopolitical tensions ease or if market focus returns to demand-side concerns.
The US dollar is sitting on a confluence of support that extends over a decade. It’s a must-see level that could affect the entire forex market in the weeks ahead.
Watch today’s video for all of the details, including how I’m trading the DXY, EURUSD, GBPUSD, USDJPY, and XAUUSD.
The DXY broke down last week, finally offering a thorough retest of 97.70. In previous videos, I’ve discussed how the index didn’t quite test the level in April, which left it open as a potential target.
Buyers stepped in on Friday to close the intraweek gap at 98.58. The DXY retreated after the gap closed but remains above 97.70 as we enter next week.
Another critical factor for the US dollar is the ascending channel from 2011. Although it’s difficult to pinpoint the exact placement on the daily time frame, the 14-year channel support is near 97.70.
That makes the next few weeks critical for the DXY. We either get a significant macro bottom developing in the 97.70 region, or the USD is heading much lower this year.
As always, it’s essential not to get ahead of ourselves. Until the DXY can break its 2025 trend line resistance or break below its 97.70 support, the US dollar will remain range-bound.
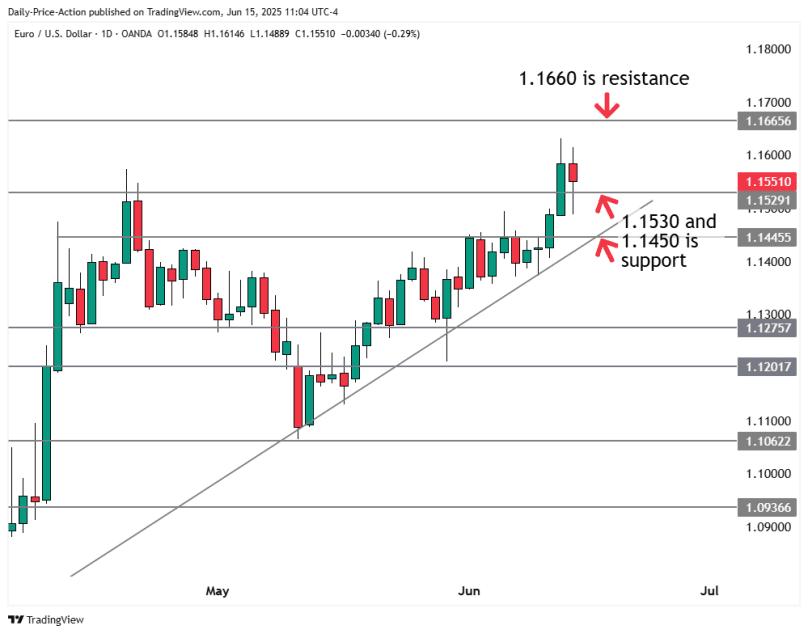
EURUSD broke above key resistance at 1.1530 on Thursday, flipping the level to new support during Friday’s session.
As we’d expect, bulls stepped in to defend the area before the weekend. However, EURUSD faces its most significant test in weeks as the DXY bounces from the 97.70 region.
With that said, a EURUSD bearish reversal can only take place if the pair closes back below the 1.1530 region. It will also need to occur on higher time frames, such as the daily and weekly charts.
Keep in mind that the March trend line at 1.1440 is also incredibly significant. The euro bounced from this level several times in May and June, so it’s one to watch.
Key resistance is 1.1660, with 1.1530 as support. As mentioned above, if EURUSD loses the 1.1530 support level, it will open up downside targets, including 1.1440, and potentially lower.
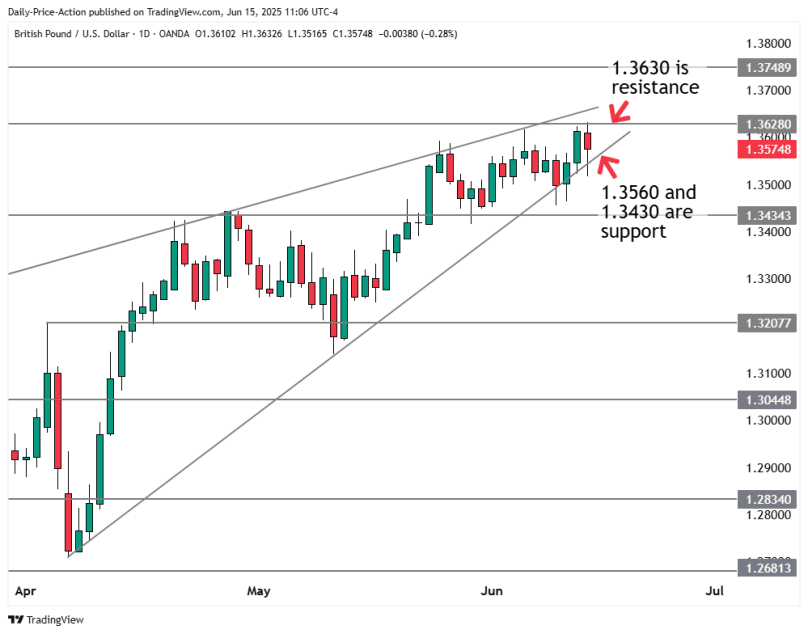
GBPUSD refuses to back down from 1.3630 despite showing a nearly identical pattern to the 2024 top.
As discussed in recent videos, the current (potential) rising wedge resembles the 2024 price action before GBPUSD topped out. The RSI is also showing early signs of bearish divergence.
Simultaneously, the DXY is testing the confluence of support I shared above.
But despite these bearish factors, GBPUSD hasn’t confirmed a breakdown. For that to occur, areas like 1.3530 will need to break, along with the more significant 1.3430 support level.
Until then, GBPUSD is range-bound between 1.3430 support and 1.3630 resistance.
I touched on USDJPY in last week’s forecast. And although the pair hasn’t done much to confirm my ideal setup, it also hasn’t invalidated it.
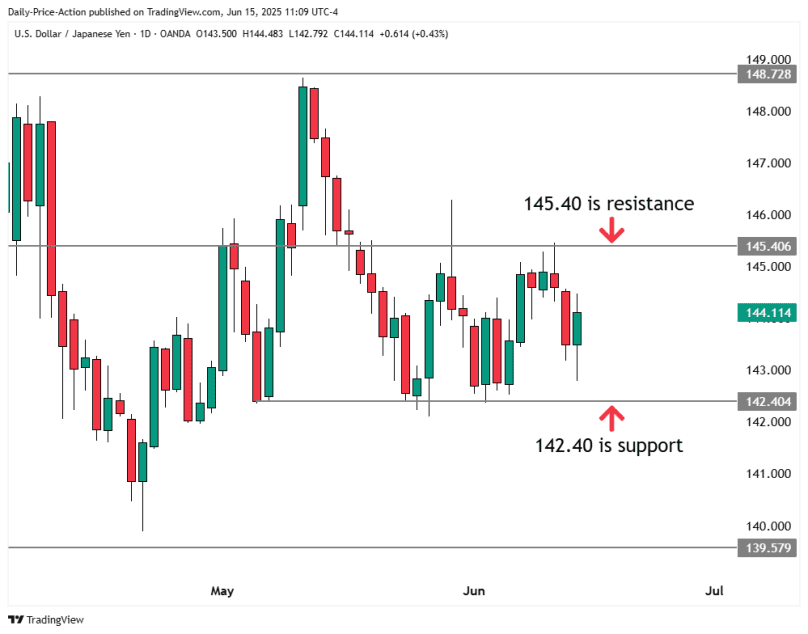
My ideal scenario for USDJPY starts with the Yen Basket we discussed last time. Currently, the chart is holding above its 2020 trend line support, but a weekly close below could introduce significant yen weakness.
At the same time, USDJPY has to claw its way back above 145.40 on the high time frames. If the two charts satisfy these requirements simultaneously, we should have a highly probable USDJPY long to work with.
Until then, I’m not interested in USDJPY, given the choppiness since May.
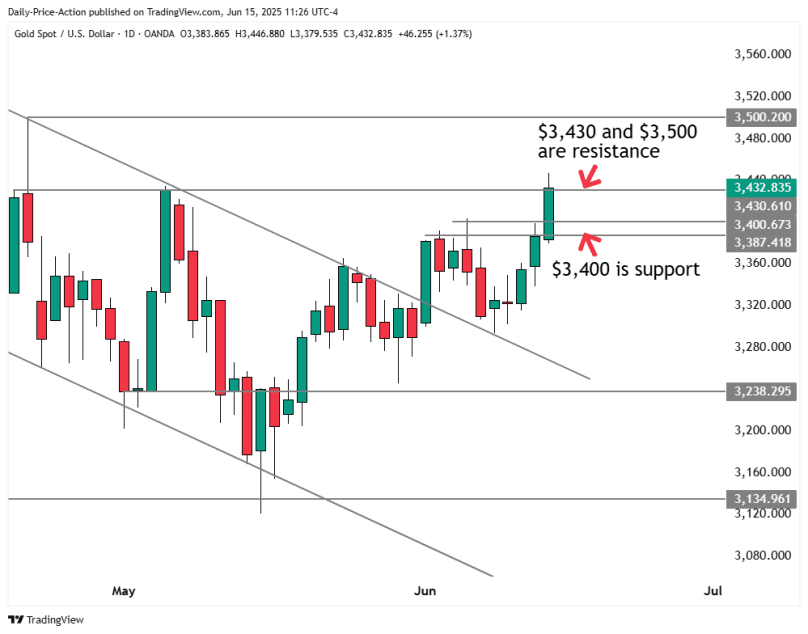
Gold broke out from a bull flag on June 2nd and tested prior resistance as new support on the 9th. That retest triggered last week’s rally, which fell just short of breaking the $3,430 resistance area.
If gold bulls can break $3,430 next week, the next stop could be an all-time high above $3,500. XAUUSD is clearly benefiting from the multitude of global risks and uncertainties.
Above $3,500 it’s anyone’s guess, as gold will once again enter price discovery. However, as $3,500 became a factor, I’d be willing to bet that $4,000 would become a target and potential resistance if visited.
Silver price bounced off five-day lows of $35.46 and is climbing past the $36.00 mark on Thursday as the Greenback gets battered, falling to nearly three-year lows. At the time of writing, XAG/USD trades at $36.30, registering modest gains of 0.25% on Thursday, late in the North American session.
As Thursday’s session finishes, Silver’s uptrend appears likely to continue, with a single candlestick pattern –known as a ‘hammer’– forming in the chart. This suggests that XAG/USD could re-test the June 9 swing high at $36.88 before buyers set their sights on higher prices.
The Relative Strength Index (RSI) exited from overbought territory but, instead of aiming lower, remains flat. Therefore, the path of least resistance is tilted to the upside.
The first key resistance is the year-to-date (YTD) high, followed by the $37.00 figure. Once cleared, the next stop would be $37.49, a 13-year high set on February 29.
Conversely, if XAG/USD drops below $36.00, the first support level would be $35.40, a high from October 2012 that has since become a support level. Once surpassed, the next stop is $35.00, followed by the $34.00 and $33.00 figures,
Silver is a precious metal highly traded among investors. It has been historically used as a store of value and a medium of exchange. Although less popular than Gold, traders may turn to Silver to diversify their investment portfolio, for its intrinsic value or as a potential hedge during high-inflation periods. Investors can buy physical Silver, in coins or in bars, or trade it through vehicles such as Exchange Traded Funds, which track its price on international markets.
Silver prices can move due to a wide range of factors. Geopolitical instability or fears of a deep recession can make Silver price escalate due to its safe-haven status, although to a lesser extent than Gold’s. As a yieldless asset, Silver tends to rise with lower interest rates. Its moves also depend on how the US Dollar (USD) behaves as the asset is priced in dollars (XAG/USD). A strong Dollar tends to keep the price of Silver at bay, whereas a weaker Dollar is likely to propel prices up. Other factors such as investment demand, mining supply – Silver is much more abundant than Gold – and recycling rates can also affect prices.
Silver is widely used in industry, particularly in sectors such as electronics or solar energy, as it has one of the highest electric conductivity of all metals – more than Copper and Gold. A surge in demand can increase prices, while a decline tends to lower them. Dynamics in the US, Chinese and Indian economies can also contribute to price swings: for the US and particularly China, their big industrial sectors use Silver in various processes; in India, consumers’ demand for the precious metal for jewellery also plays a key role in setting prices.
Silver prices tend to follow Gold’s moves. When Gold prices rise, Silver typically follows suit, as their status as safe-haven assets is similar. The Gold/Silver ratio, which shows the number of ounces of Silver needed to equal the value of one ounce of Gold, may help to determine the relative valuation between both metals. Some investors may consider a high ratio as an indicator that Silver is undervalued, or Gold is overvalued. On the contrary, a low ratio might suggest that Gold is undervalued relative to Silver.
The latest developments come as Israel reportedly targeted Iran’s nuclear sites and senior military commanders, prompting retaliatory drone attacks from Iran. According to Israel’s military, over 100 drones were launched by Iran in response. The rising instability has rattled global markets, increased investor anxiety, and sent gold prices to their highest level in nearly two months, signaling a classic flight to safety.
The benchmark Brent crude price surged over 10% shortly after Israel confirmed the attack, climbing to levels not seen since January. As European markets opened, prices cooled slightly but still held a 5% gain compared to Thursday, trading around $72.80 per barrel. U.S. West Texas Intermediate (WTI) also rose, trading at $73.20.
Although prices remain well below the $100-plus highs seen during Russia’s 2022 invasion of Ukraine, traders are now pricing in potential threats to vital supply routes and oil facilities across the region. The Middle East is home to a significant share of global oil production, and any conflict that puts that at risk sends shockwaves through the market.
Yes, energy analysts are warning that this conflict, if it escalates, could disrupt oil flows—especially if Iran targets infrastructure or shipping routes like the Strait of Hormuz. This narrow waterway is one of the most critical chokepoints for global energy supplies, with nearly one-fifth of the world’s oil passing through it daily. According to Saul Kavonic, head of energy research at MST Financial, “What we see now is a very initial risk-on reaction. But over the next day or two, the market will need to factor in where this could escalate to.” Capital Economics analysts say if Iranian production or export facilities are hit, Brent crude could rise to $80–$100 per barrel, depending on the scale of the disruption. However, they also suggest that higher prices could trigger increased output from other oil-producing nations, which might limit the long-term impact.
The rising oil prices triggered widespread uncertainty across financial markets. Stock markets across Asia and Europe declined, with Japan’s Nikkei closing down 0.9% and the UK’s FTSE 100 index falling 0.4% by mid-morning.
At the same time, “safe-haven assets” like gold and the Swiss franc gained sharply. The gold price jumped 1.2% to hit $3,423.30 an ounce, marking its highest level in nearly two months.
These moves reflect growing investor concern that this latest round of violence could spiral into a wider regional conflict, with unpredictable effects on global inflation and energy supply.
It’s still unclear whether this spike in crude prices will immediately impact prices at the pump. According to Rod Dennis from the UK’s RAC motoring group, it’s “too soon” to say.
He added that “there are two key factors at play: whether higher wholesale fuel prices are sustained over the coming days and, crucially, the sort of margin retailers decide to take.”
If the conflict continues or worsens, consumers could feel the pinch in the form of higher petrol and diesel prices, especially if disruptions reach the Strait of Hormuz. Rising fuel costs also feed into higher transportation and food prices, which could affect inflation worldwide.
Analysts are warning that the current situation could either calm quickly—or spiral into a broader war. Vandana Hari of Vanda Insights told the BBC, “It’s an explosive situation, albeit one that could be defused quickly, as we saw in April and October last year.”
However, she also warned, “It could also spiral out into a bigger war that disrupts Mideast oil supply.”
If Iran’s oil infrastructure or shipping routes come under serious threat, the global energy market could face a major crisis. With multiple countries relying heavily on oil shipped from the Gulf, any major conflict could send shockwaves far beyond the region.
Oil traders and analysts will now be closely watching political and military developments. Key questions include whether Iran escalates its response, if other regional powers become involved, and how the U.S. and allies react. At the same time, OPEC and major producers may be forced to consider output changes to stabilize markets.
As the situation unfolds, the global economy faces rising uncertainty—not just over oil, but over inflation, market stability, and energy security.
Q1: Why did global oil prices surge after Israel’s strike on Iran?
Oil prices jumped due to fears that the Israel-Iran conflict could disrupt key Middle East oil supplies.
Q2: Could the Strait of Hormuz be affected by this conflict?
Yes, if tensions rise, Iran might block or disrupt oil flow through the crucial Strait of Hormuz.
The GBP/USD weekly forecast remains strongly bullish as the pair hits its third consecutive week in gains. The price marked a 39-month top at 1.3635 before pulling back ahead of the weekend.
-If you are interested in forex day trading then have a read of our guide to getting started-
The bullish momentum gained traction after a period of consolidation earlier in the week. The weaker dollar and improved risk sentiment helped the buyers. However, the key catalyst was progress in the US-China trade negotiation, concluded in London with an agreement to ease restrictions on exports, including rare earth metals. Though the announcement had no details, it boosted risk appetite and weighed on the safe-haven Greenback.
The US inflation data surprised the market to the downside, with a 0.1% rise on a monthly basis, which dragged annual inflation to 2.4%, missing the estimate of 2.5%. The core inflation also remained downbeat, increasing odds for a dovish Fed. This was further fueled by softer US PPI data and rising weekly jobless claims that deepened the USD losses and provided additional strength to the pound.
However, the rally proved to be short-lived. Geopolitical tensions ignited later in the week due to Israel’s attack on Iran, killing Iranian military officials and scientists. Iran responded in retaliation, which escalated the fear of broader conflict.
The safe-haven demand for the US dollar soared on the news that triggered a significant pullback of more than a hundred pips in the GBP/USD pair. The downward pressure was further intensified by the UoM Consumer Sentiment Index that rose to 60.5, well above the expected 53.5.
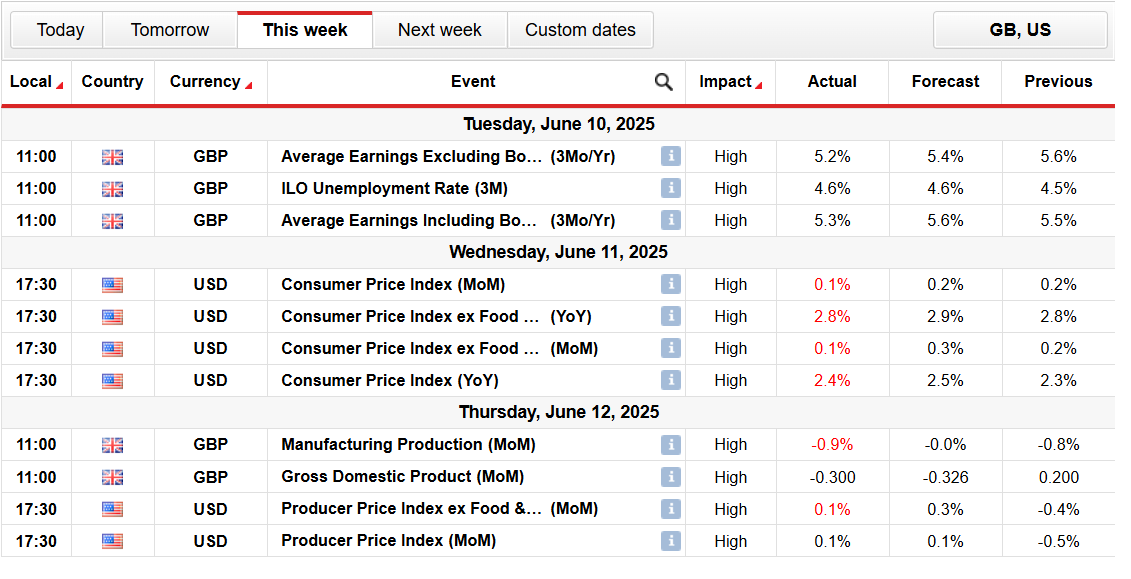
Looking ahead, next week, the market participants will focus on the upcoming central bank meetings. Both the US Federal Reserve and the Bank of England are set to announce their key policy decisions midweek. Consensus suggests no change from either the Fed, which is expected to hold rates at 4.25%-4.50%, or the BoE, which is also expected to hold rates at 4.25%.
Moreover, the US and UK retail sales data, along with UK CPI and US jobless claims, will be important to watch. Meanwhile, geopolitics and the Fed’s further commentary will also shape the outlook.
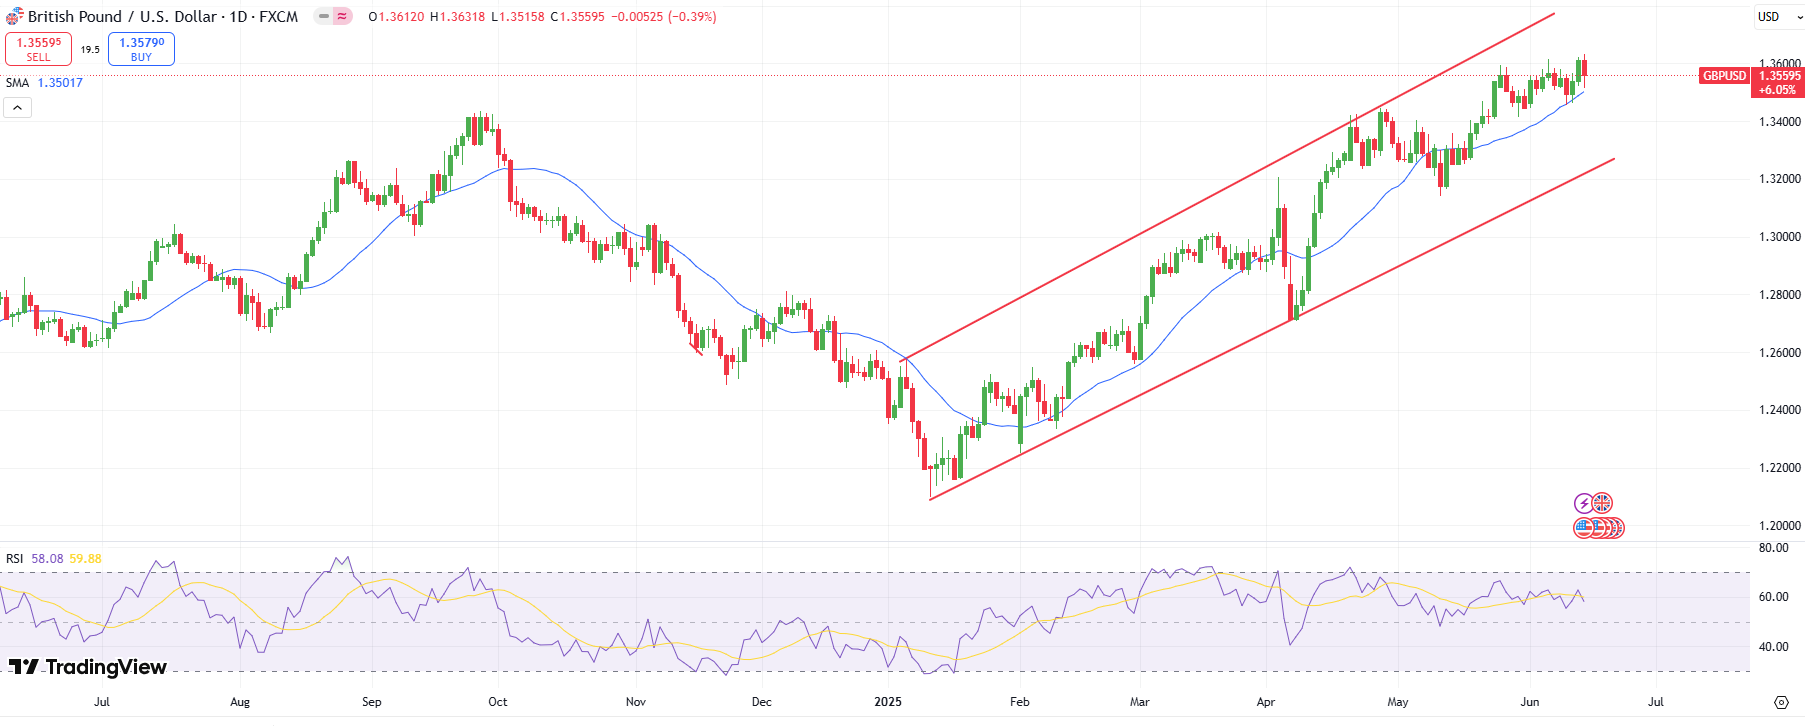
The daily chart of the GBP/USD suggests a consolidation within a broad uptrend. The Friday pullback remained strongly supported by the 20-day SMA. Meanwhile, a strong support zone also emerges in the 1.3420-60 area. The daily RSI is at 58.00 with a tilt to the downside, which suggests further consolidation.
-Are you looking for the best AI Trading Brokers? Check our detailed guide-
On the upside, the resistance lies at 1.3600, which is a round number ahead of 1.3635, which is a fresh 39-month top. Breaking the level may gather enough traction to test 1.3700.
Looking to trade forex now? Invest at eToro!
67% of retail investor accounts lose money when trading CFDs with this provider. You should consider whether you can afford to take the high risk of losing your money.
Weekly support from last week was at $3.50 and it was broken on Wednesday. However, it was not confirmed with a daily close below that price level. Therefore, a weekly closing price above that level could be the sign of a false breakdown. Currently, today’s closing price will be above that price level and at a four-day closing high, another sign of strength.
Nonetheless, key support is at a minor higher swing low of $3.44, while this week’s low was at $3.45. If the slightly lower $3.44 level fails, the 61.8% Fibonacci retracement at $3.38 is the next lower target where support may be seen. Then, a little lower is the 200-Day MA, now at $3.32.
A decisive breakout above today’s high of $3.62 could be the next sign of strength that has the potential to lead to higher prices. But the four-day high of $3.66 would need to be exceeded before there are clearer signs of a bottom. A recovery of the $3.66 level would establish a slightly higher swing low from this week. Solid potential resistance lies above and up to the $3.84 swing high from May. If natural gas can get above the May swing high, it has a chance to complete a rising ABCD pattern at $4.08. That price level is joined by the 61.8% Fibonacci retracement level at $4.12.
Given the two recent bounces off the area around the 200-Day MA since April, the uptrend begun from the April swing low is expected to continue. That could change if there is a decisive decline below the 200-Day line.
For a look at all of today’s economic events, check out our economic calendar.
June 13, 2025 – Written by Frank Davies
STORY LINK Euro to Dollar Forecast: EUR Tumbles After Israel Strike on Iran
The Euro to Dollar exchange rate (EUR/USD) surged to 43-month highs just above 1.1630 on Thursday as the dollar came under renewed pressure.
There was, however, a sharp retreat to lows below 1.1520 on Friday following Israel’s strike on Iran’s nuclear facilities with a surge in geo-political tensions and a spike in oil prices while equity markets retreated.
According to ING; “we think the starting point was already quite rich for the pair, and a return to the 1.14-1.15 seems entirely appropriate.”
Danske Bank noted; “The attack adds significant uncertainty to diplomacy, with US officials denying direct involvement while cautioning that it could either hinder or, unexpectedly, pressure Iran towards discussions.”
The Israeli strikes have added to underlying trade and economic uncertainty. There will inevitably be unease over any escalation while markets are closed with demand for safe-haven assets.
OCBC currency strategist Christopher Wong commented; “Geopolitical noise may temporarily distort the dollar downtrend and temporarily weigh on risk proxies especially heading into the weekend.”
According to ING; “The key difference from previous Israel-Iran standoffs is that nuclear facilities have now been targeted, and while oil production does not seem to be affected just yet, markets have to add in a bigger risk premium given the crucial role of Iran in global oil supply.”
Nordea commented; “Geopolitical worries added to the list of potential headwinds for risk appetite, with Israel attacking Iran’s nuclear facilities and Iran retaliating. Oil prices shot up as a result, though from rather low levels.”
It added; “It is worth remembering that geopolitical tensions like these seldom remain the main market driver for a longer time, though as noted, this time they are by far not the only factor causing worries.”
According to ING; “The risks now point more definitively towards a prolonged period of tension, in contrast to recent episodes. And we think this could continue to take some pressure off the dollar.”
There are still doubts whether the dollar can secure sustained support given fundamental concerns and risk of capital outflows.
The Euro has also gained net support from increased speculation that the ECB will decide against further interest rate cuts.
MUFG commented; “The developments could provide a timely test of the US dollar’s traditional safe haven appeal after it hit fresh year to date lows yesterday prior to Israel’s military strikes.”
In this context, the dollar was subjected to further selling pressure on Thursday with further evidence of a softer labour market reinforcing expectations that the Federal Reserve would move close to interest rate cuts.
Continuing jobless claims rose to their highest level since November 2021.
MUFG commented; “we still expect the Fed to be reluctant to cut rates at upcoming policy meetings in June or July until they have more clarity over US trade policy and impact on inflation and labour market.”
It added; “At the same time, the release yesterday of the latest weekly initial and continuing claims have added to concerns that the US labour market is continuing to soften in response to trade disruption and heightened policy uncertainty.”
ING, however, also considers that the dollar is over-sold; “We had felt the USD negative reaction to the soft CPI print was exaggerated, and new geopolitical tensions give the Fed another argument to stay cautious, arguing for that CPI move to be scaled back.”
International Money Transfer? Ask our resident FX expert a money transfer question or try John’s new, free, no-obligation personal service! ,where he helps every step of the way,
ensuring you get the best exchange rates on your currency requirements.
TAGS: Euro Dollar Forecasts
The investment bank said current prices already reflect a 7% chance of a worst-case geopolitical scenario, one in which Iranian oil supplies are severely disrupted and the price reaction becomes “exponential rather than linear.”
As of early Friday, Brent futures surged nearly 9% to $75.36 per barrel, while WTI rose $6.16 to $74.20, following the news of Israeli strikes on Iran’s uranium enrichment facilities and military leadership. Iranian media reported explosions at the Natanz nuclear site and confirmed the death of Hossein Salami, commander of the Revolutionary Guards.
Also Read | Rs 1 lakh gold, $78 oil, 1,300 point Sensex crash: Israel’s Friday the 13th bombshellHere are the six key takeaways from J.P. Morgan’s latest oil market outlook, now playing out against an increasingly combustible geopolitical backdrop:
1. A 7% chance of a nightmare scenario already priced in
According to the J.P. Morgan, oil prices reflect a “7% probability of a worst-case scenario,” in which the impact on supply goes beyond reduced Iranian exports. In such a case, the bank said, price surge would not be gradual but “exponential,” driven by panic reactions and wider regional contagion.
2. Oil could jump to $120, pushing U.S. inflation to 5%
“An attack on Iran could spike oil prices to $120, driving U.S. CPI to 5%,” the investment bank warned.Such a move would reverse recent progress on inflation and complicate monetary policy for the Federal Reserve, which has been preparing for a potential rate-cut cycle later this year.
3. Base case oil forecast held at $60–$65
Despite the heightened tensions, J.P. Morgan said it was “downplaying geopolitical concerns” and maintaining its base case for Brent crude in the “low-to-mid $60s oil for the rest of 2025, and $60 in 2026.”
The investment bank expects oil to average $60 per barrel in 2026. This forecast assumes that regional powers will act to prevent a full-scale conflict.
4. Strait of Hormuz closure seen as unlikely
The bank downplayed fears of Iran closing the Strait of Hormuz, a key global shipping chokepoint, stating: “The closure of Hormuz is a low-risk event as Iran would be damaging its own position, both economically and politically, by irritating its main customer.”
Roughly a fifth of global oil passes through this strait, and any disruption there would have dramatic effects on energy markets.
5. Gulf nations have a stake in stability
J.P. Morgan argued that major Middle Eastern producers have strong incentives to keep hostilities from spiraling.
“Main players in the Middle East have strong incentives to keep the conflict contained given the economic transformation currently planned and implemented in the Gulf region requires a sustained absence of conflict,” the bank said, citing the sweeping economic diversification plans underway in the Gulf, which depend on prolonged regional calm.
This includes massive infrastructure and diversification efforts in Saudi Arabia and the UAE.
6. Oil surged, markets sank as tensions boiled over
Oil prices spiked while global markets sold off on Friday after Israel’s offensive on Iranian military and nuclear sites. Brent crude gained $6 to hit $75.36 a barrel, while WTI futures rose $6.16 to $74.20. Gold, another haven asset, climbed 1.5% to $3,434 per ounce.
Meanwhile, Israel said it was preparing for retaliatory missile and drone attacks, declaring a state of emergency nationwide. Iran has vowed a response after losing top military officials, including Salami, and seeing key installations in Tehran and Natanz come under fire.
U.S. Secretary of State Marco Rubio said that Washington had no role in the Israeli operation, calling it a “unilateral action.”
The sudden escalation comes amid stalled nuclear talks between Washington and Tehran and ahead of a critical vote by the International Atomic Energy Agency on June 12 in Vienna, which could trigger a snapback of United Nations sanctions on Iran.
With oil supply risks now sharply elevated and diplomatic off-ramps narrowing, J.P. Morgan’s warning looks increasingly prescient.
Also read | Oil jumps more than 12% as Israel strikes Iran, rattling investors
(Disclaimer: Recommendations, suggestions, views and opinions given by the experts are their own. These do not represent the views of The Economic Times)