The main category of Forex News.
You can use the search box below to find what you need.
[wd_asp id=1]
The main category of Forex News.
You can use the search box below to find what you need.
[wd_asp id=1]
Traders are closely monitoring today’s U.S. consumer price index (CPI) report, scheduled for release at 1230 GMT. The data could clarify the Federal Reserve’s stance on interest rates. A softer CPI would increase the likelihood of rate cuts, which would typically support gold prices. Conversely, a hotter-than-expected reading could dampen gold’s appeal by reinforcing expectations for prolonged high interest rates.
U.S. and Chinese officials announced on Tuesday they had agreed on a framework to restore trade cooperation, including the rollback of China’s export restrictions on rare earths. However, markets showed little enthusiasm, reflecting skepticism over the durability of any agreement. April’s tit-for-tat tariffs and only partial progress since underscore lingering distrust. “Gold should remain supported as long as global trade tensions risk escalating further, or even just staying elevated for longer,” said Han Tan, chief market analyst at Exinity Group.
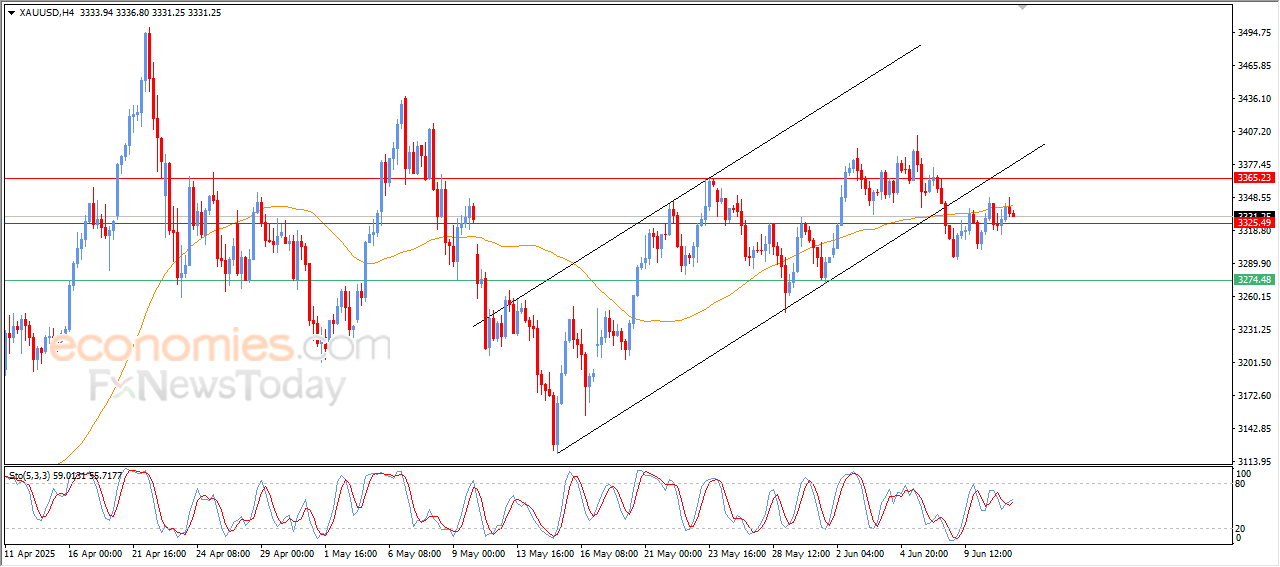
Gold is trading in a tight range, supported by geopolitical risk but held back by technical resistance. The support zone between $3310.48 and $3274.00 will be key—failure to hold above this area could open the door to extended downside. Unless the $3403.63 top is breached, sentiment remains mixed with a neutral-to-bearish near-term bias. Traders should watch both CPI outcomes and trade headlines for confirmation of the next directional move.
More Information in our Economic Calendar.
The USD/JPY forecast shows an increasing likelihood that the Bank of Japan will delay rate hikes to next year. Meanwhile, talks between the US and China ended with few details. At the same time, market participants are awaiting the US CPI report for clues on the future of Fed rate cuts.
–Are you interested to learn more about crypto signals? Check our detailed guide-
A Reuters poll on Wednesday revealed that a slim majority of economists believe the BoJ will hike in Q1. According to them, the impacts of Trump’s tariffs will force policymakers to delay hikes. Meanwhile, top officials at the bank have reiterated that they will continue to hike rates when inflation and growth re-accelerate.
Elsewhere, talks between China and the US ended, easing trade war fears. However, there were few details on the outcome of the talks. Still, just the fact that they met and discussed trade was enough to show progress in negotiations.
Meanwhile, traders are paying close attention to the upcoming US CPI report. The data might show a 0.2% increase in price pressures in May. Meanwhile, the annual figure might increase from the previous 2.3% to 2.5%. If inflation is hot, it will confirm fears that Trump’s tariffs have hiked price pressures. Such an outcome would mean more delays on Fed rate cuts.
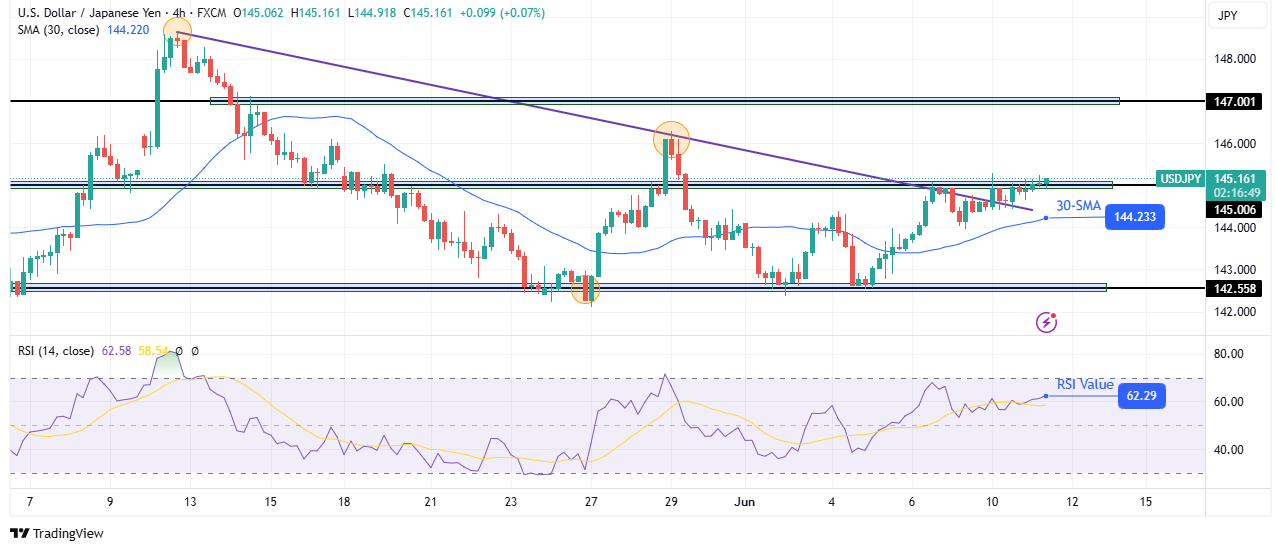
On the technical side, the USD/JPY price has broken above a solid resistance trendline, a sign that bulls might be ready to take charge. The price trades above the 30-SMA, with the RSI over 50, showing bulls are in the lead. However, they are facing a solid hurdle at the 145.00 key level.
–Are you interested to learn more about forex robots? Check our detailed guide-
For some time, the price has been making lower highs. However, it has failed to make lower lows as the 142.55 held firm as support. If bears cannot make lower lows, bulls will likely get stronger and start making higher highs and lows.
A break above the 145.00 key resistance level will clear the path for USD/JPY to retest the 147.00 key level. On the other hand, if the level holds firm, the price will likely drop back below the trendline to retest the 142.55 support.
Looking to trade forex now? Invest at eToro!
67% of retail investor accounts lose money when trading CFDs with this provider. You should consider whether you can afford to take the high risk of losing your money.
The EURNZD failed to record any new positive target, due to the continuation of the contradiction between the main indicators, to notice its approach from the moving average 55 at 1.8810, reinforcing the stability of the bullish channel’s support at 1.8785.
Depending on the stability of the previously mentioned main support, we will keep waiting for positive momentum in the near period, to ease the mission of recording positive stations by its rally to 1.8960 initially, then attempt to press on the intraday obstacle at 1.9050.
The expected trading range for today is between 1.8860 and 1.8960
Trend forecast: Bullish
As anticipated, the EUR/USD pair remains within its current range, showing bullish momentum as markets and investors await the release of US inflation figures later today. These figures, due at 3:30 PM Egypt time, will significantly impact market expectations for the future monetary policies of the US Federal Reserve. Yesterday, the EUR/USD price jumped to the 1.1447 resistance level, close to its three-year high of 1.1572 recorded in April, as traders closely monitored developments in ongoing US-China trade talks.
We still recommend selling the EUR/USD on any upward bounce and avoiding risk, regardless of the strength of the trading opportunities.
Meanwhile, investors are assessing comments from European Central Bank (ECB) officials for clues on the bank’s next policy moves. Governing Council member François Villeroy de Galhau indicated that the ECB can still act quickly to adjust interest rates, even after its eighth consecutive cut, which he stated “returned to normal” in monetary policy. Last week, the ECB cut interest rates as expected, but Governor Christine Lagarde suggested that the monetary easing cycle might be nearing its end. The deposit facility rate is now 2%, while Eurozone inflation fell to 1.9% in May 2025. Concurrently, the bloc’s economy grew by 0.6% in the first quarter of 2025, its fastest growth rate since Q3 2022.

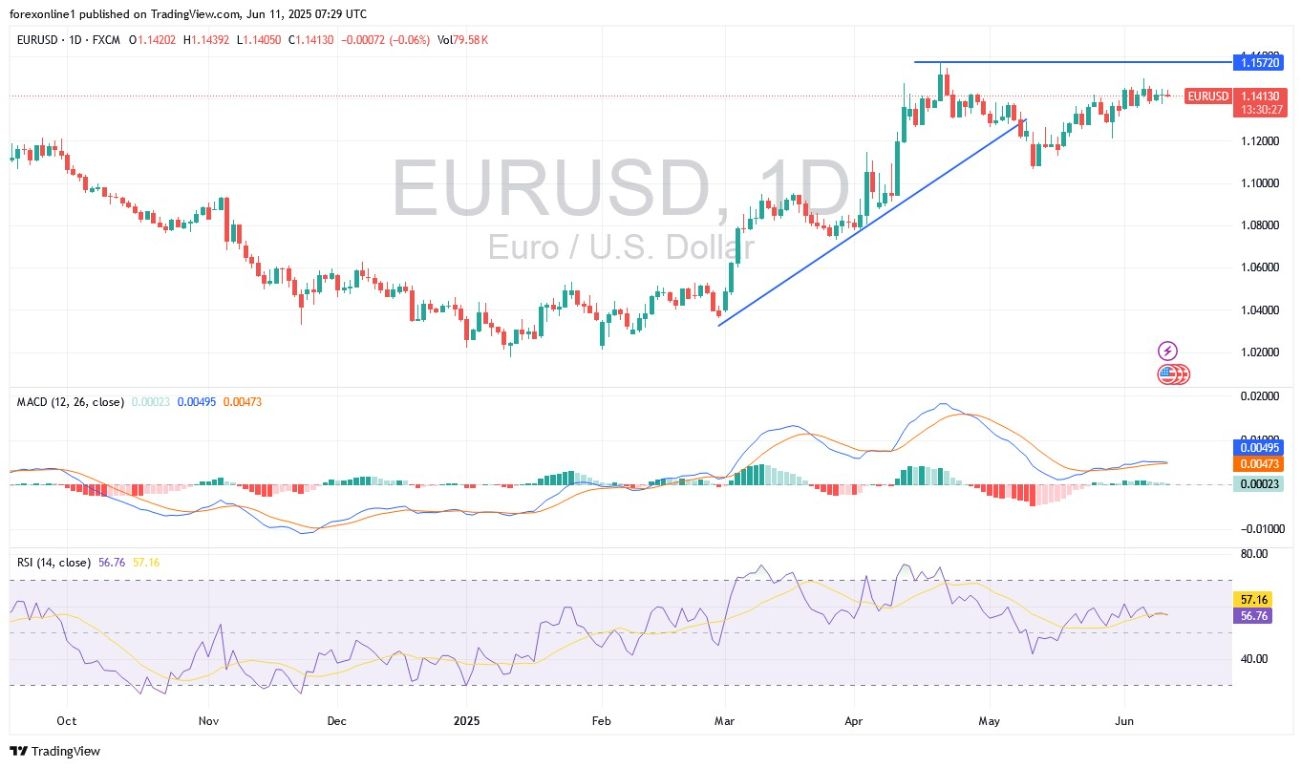
Based on the daily timeframe chart, the EUR/USD currency pair remains on a bullish trajectory, supported by the stability of currency bulls around and above the 1.1400 resistance. This stability is pushing the 14-day RSI (Relative Strength Index) near the 60 reading, which reinforces bull dominance and anticipates stronger gains before the indicator reaches overbought territory. Simultaneously, the MACD (Moving Average Convergence Divergence) indicator confirms the upward path. The bulls’ next key targets are the resistance levels of 1.1520 and 1.1600, with signs of overbought conditions likely to begin around the latter level. Conversely, over the same period, the support levels of 1.1220 and 1.1165 remain crucial for bears to break the current bullish trend of the currency pair.
Goldman Sachs has raised its forecasts for the EUR/USD pair, citing relatively weaker equity performance for Euro-based investors, declining foreign appetite for US assets, and a confirmed slowdown in US economic activity. On another note, according to performance across stock trading platforms, US equities may appear stable in USD value, but they have fallen by 8% year-to-date for Euro investors, making EU stocks relatively more attractive. Overall, the less appealing US investment climate is prompting global investors to diversify their investments away from the US dollar and USD-denominated assets.
Recently, recent macroeconomic indicators support the narrative of slowing US economic activity, reinforcing the argument for continued USD depreciation.
Consequently, Goldman Sachs has raised its EUR/USD targets to:1.17 over 3 months
1.20 over 6 months
1.25 over 12 months
These targets are higher than the previous 1.12, 1.15, and 1.20 set after the “Liberation Day” policy announcement. In general, Goldman Sachs maintains its structurally bearish outlook on the US dollar, driven by macroeconomic divergence and global capital reallocation. From their perspective, the EUR/USD trend remains bullish, with 1.25 now being the 12-month target.
Ready to trade our EUR/USD analysis and predictions? Here are the best European brokers to choose from.
Copper price remains stable until this moment below $4.8900 level, which decelerates the chances for renewing the bullish attempts, to keep preferring the sideways bias domination in the near trading, and there is a possibility to form some correctional waves that target $4.7500 reaching $4.6600 level.
While the price success to breach the mentioned barrier and hold above it will reinforce the chances for renewing the bullish attempts, to expect reaching $5.0300 followed by the next barrier at $5.1000.
The expected trading range for today is between $4.7500 and $4.8900
Trend forecast: Fluctuated within the bullish track
The GBP/USD price analysis suggests increasing expectations for Bank of England rate cuts this year after downbeat UK employment data. Meanwhile, market participants remain cautious ahead of crucial US inflation figures.
–Are you interested to learn more about crypto signals? Check our detailed guide-
Data on Tuesday revealed that the UK labor market was weaker in the three months to April. The unemployment rate reached an almost four-year high, rising from 4.5% to 4.6%. At the same time, wage growth slowed sharply from 5.5% to 5.2%.
The downbeat figures increased BoE rate cut expectations and weighed on the pound. Before the report, traders were 39-bps of rate cuts this year. This figure increased to 48-bps after the data.
Meanwhile, market participants are awaiting the US consumer inflation report, scheduled for release on Wednesday. According to estimates, inflation increased by 0.2% in May. Meanwhile, the annual figure increased by 2.5%, above the previous reading of 2.3%.
A hotter-than-expected reading would confirm the Fed’s fears that Trump’s tariffs have increased price pressure. Moreover, it would lower Fed rate cut expectations, boosting the dollar. On the other hand, if inflation is softer, it will weigh on the dollar by increasing bets for a Fed rate cut.
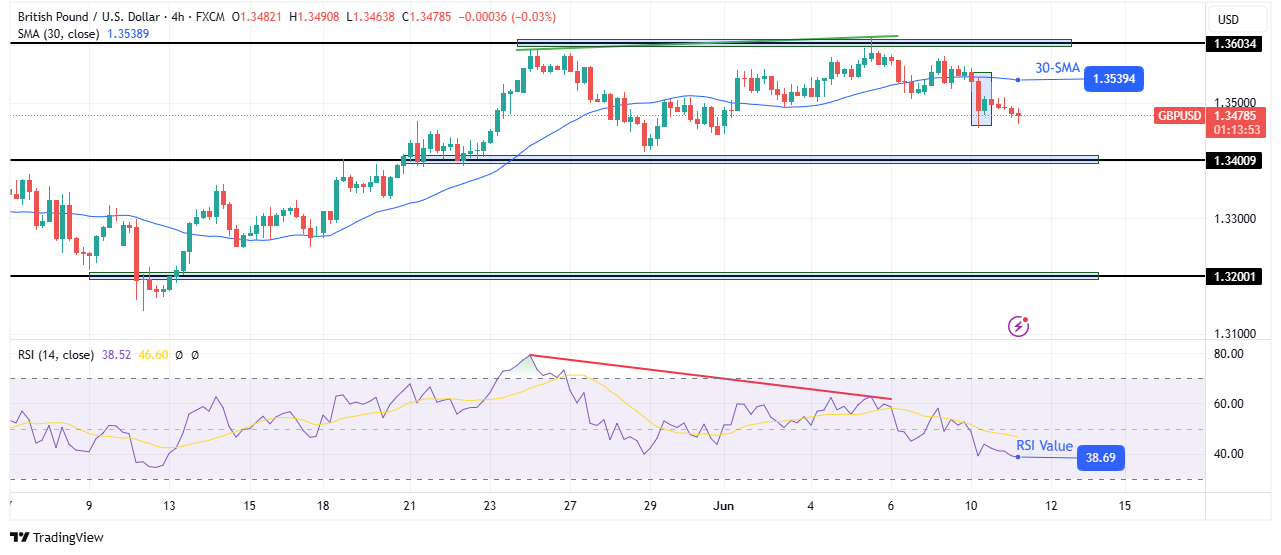
On the technical side, the pound is finding its feet below the 30-SMA after a recent shift in sentiment. Meanwhile, the RSI trades nearer the oversold region, indicating solid bearish momentum. However, after a strong break below the SMA, momentum has eased, and price action shows hesitation to continue lower. The price is now making small-bodied candles.
–Are you interested to learn more about forex robots? Check our detailed guide-
Nevertheless, the bearish bias has strengthened, and the path is clear for GBP/USD to reach the 1.3400 support level. A break below this level will strengthen the bearish bias and allow the price to target the 1.3200 support.
However, if the level holds firm, bulls might return for a pullback. However, the bearish bias will remain strong as long as the price stays below the 30-SMA.
Looking to trade forex now? Invest at eToro!
67% of retail investor accounts lose money when trading CFDs with this provider. You should consider whether you can afford to take the high risk of losing your money.
The GBPJPY pair kept its stability within the bullish channel’s levels, taking advantage of forming extra support at 194.50 level, to notice forming some bullish waves and its stability near 195.50, to confirm the continuation of the previously suggested bullish scenario.
The price needs a new positive momentum that allows it to settle above the obstacle at 195.65 level, to begin forming strong bullish waves, targeting 196.30 level reaching 61.8%Fibonacci correction level at 197.35, forming the next main target for the bullish track.
The expected trading range for today is between 194.80 and 196.30
Trend forecast: Bullish
Copper price remains stable until this moment below $4.8900 level, which decelerates the chances for renewing the bullish attempts, to keep preferring the sideways bias domination in the near trading, and there is a possibility to form some correctional waves that target $4.7500 reaching $4.6600 level.
While the price success to breach the mentioned barrier and hold above it will reinforce the chances for renewing the bullish attempts, to expect reaching $5.0300 followed by the next barrier at $5.1000.
The expected trading range for today is between $4.7500 and $4.8900
Trend forecast: Fluctuated within the bullish track
Gold price is gathering strength in Wednesday’s Asian trading, having defended the critical support near $3,300 so far this week. However, the further upside hinges on the US Consumer Price Index (CPI) data due later in the day.
Following the second day of US-China trade talks in London on Tuesday, Bloomberg reported that both sides agreed on a framework for a trade deal that could potentially help resolve a trade war between the world’s two largest economies.
The US-China optimism helped the US Dollar (USD) recover some ground across its major currency rivals. However, the recovery lacks conviction amid the US Appeals court ruling that allows US President Donald Trump’s reciprocal tariffs to stay in place.
This uncertainty over Trump’s trade policies fails to lift risk sentiment, allowing the traditional safe-haven Gold price to gather upside traction.
Traders also remain wary ahead of the all-important US CPI data, which could alter markets’ expectations of a September Federal Reserve (Fed) interest rate cut.
Markets are currently pricing in about 52% odds of the Fed lowering rates by 25 basis points (bps) in September.
The US monthly CPI is forecast to increase by 0.2% and core inflation is expected to tick up to 0.3% in May. The data will likely show the first signs of Trump’s tariffs feeding through into prices.
Hotter-than-expected US monthly CPI reading could push back against markets’ expectations of a Fed rate cut in September, sending the US Dollar higher at the expense of the non-yielding Gold price
On the other hand, a surprise cooldown in the inflation data could reinforce the buying interest around non-yielding Gold price, as the data would reaffirm expectations of two rate cuts by the Fed this year.
However, the Gold price reaction to the US inflation report could be impacted by the trade headlines. Markets also keep a close eye on the US 10-year Treasury bond auction on Wednesday and Thursday.
There are no changes to the short-term technical outlook so long as Gold price holds above the critical $3,297 level.
That level is the confluence of the 21-day Simple Moving Average (SMA) and the 38.2% Fibonacci Retracement (Fibo) level of the April record rally.
Further, the 14-day Relative Strength Index (RSI) has managed to hold its ground above the midline, currently near 54, supporting the bullish potential.
Gold sellers need a daily candlestick closing below the abovementioned strong support at $3,297 to challenge the 50-day SMA cap at $3,262.
The last line of defense for buyers is aligned at $3,232, the 50% Fibo level of the same ascent.
On the flip side, Gold buyers will likely find strong offers at the $3,350 psychological level if the rebound gathers strength.
The next resistance is spotted at the 23.6% Fibo resistance at $3,377, above which the May high of $3,439 could be threatened.
Inflationary or deflationary tendencies are measured by periodically summing the prices of a basket of representative goods and services and presenting the data as The Consumer Price Index (CPI). CPI data is compiled on a monthly basis and released by the US Department of Labor Statistics. The MoM figure compares the prices of goods in the reference month to the previous month.The CPI is a key indicator to measure inflation and changes in purchasing trends. Generally, a high reading is seen as bullish for the US Dollar (USD), while a low reading is seen as bearish.
Copper price remains stable until this moment below $4.8900 level, which decelerates the chances for renewing the bullish attempts, to keep preferring the sideways bias domination in the near trading, and there is a possibility to form some correctional waves that target $4.7500 reaching $4.6600 level.
While the price success to breach the mentioned barrier and hold above it will reinforce the chances for renewing the bullish attempts, to expect reaching $5.0300 followed by the next barrier at $5.1000.
The expected trading range for today is between $4.7500 and $4.8900
Trend forecast: Fluctuated within the bullish track