The main category of Forex News.
You can use the search box below to find what you need.
[wd_asp id=1]
The main category of Forex News.
You can use the search box below to find what you need.
[wd_asp id=1]
See today’s full USD/JPY forecast with chart setups and trade ideas.
US-China trade talks continued on June 10, spotlighting AUD/USD. Easing US-China trade tensions and progress toward a meaningful agreement could boost Chinese demand and bolster Aussie dollar sentiment. Given that China accounts for one-third of Australian exports and, with a trade-to-GDP rate exceeding 50%, improving trade terms may ease recession fears.
Conversely, failed talks may raise recession risks and prompt a more dovish RBA rate stance. A more dovish RBA rate path could drag AUD/USD lower.
At the most recent RBA press conference, Governor Michele Bullock warned:
“Australia’s economy could easily be compromised if a trade war between the US and China escalates. Depending on where we end up on trade developments, there might be more interest rate adjustments. But for now, rates are in the right place.”
AUD/USD: Key Scenarios to Watch
Click here for a more comprehensive analysis of AUD/USD trends and trade data insights.
Later today, the US CPI Report will move AUD/USD through its influence on US-Aussie interest rate differentials.
Higher inflation would likely temper Fed rate cut expectations, widening the interest rate differential in favor of the US dollar. A wider rate differential may pull AUD/USD below $0.65, bringing the 200-day and 50-day EMAs into sight.
Softer inflation, by contrast, may revive Fed rate cut bets, narrowing the rate differential. In this scenario, AUD/USD may move above $0.6550, with the $0.66 level as the next key target.
Potential support around the 50-Day MA takes on added significance since it is joined by two other indicators. The 20-Day MA converged with the 50-Day line recently and an anchored volume weighted average price (AVWAP) level is at $3.51 currently. Having said that, last week’s low was $3.50. Since it is a weekly support level, it takes on added significance relative to a daily level. This means two things. Either weekly support is broken to the downside, pointing to still lower prices, or strong support is found at or above the weekly low, that leads to a bullish reversal.
A little lower is key support at $3.44, as it is a higher swing low and therefore part of the price structure for the near-term rising trend that began from the May swing low (C). A drop below it would indicate a potential bearish reversal following two recent lower swing highs, relative to the May swing high (B). If the $3.44 swing low is broken to the downside, then the next lower price levels to watch for support, include the 61.8% Fibonacci retracement at $3.38 and the 200-Day MA, now at $3.29. There were two recent successful tests of support around the 200-Day MA during bearish corrections.
Therefore, a drop to the 200-Day line might be the lowest price level reached if the current pullback continues to weaken. Having said that, given the strengthening relationship with the 200-Day MA, support would more likely be seen a little above the 200-Day line, if not more so. Notice that the decline in April dropped below the 200-Day MA for four days before recovering. In May, the dip below the 200-Day line occurred over two days. Further, the drop below the line in April was greater than what occurred in May.
For a look at all of today’s economic events, check out our economic calendar.
Spot Gold extended its weekly rally on Tuesday, approaching the $3,350 area in the American session. The US Dollar (USD) enjoyed near-term demand during Asian trading hours, and XAU/USD flirted with the $3,300 threshold at the beginning of the day as investors were optimistic about a potential trade deal between the United States (US) and China.
The absence of meaningful headlines and extended talks on Tuesday slowly weighed on the market’s mood, underpinning the bright metal. The USD, however, captured attention after Wall Street’s opening, once again advancing alongside stocks on hopes a trade deal will be announced shortly.
Indeed, easing tensions between Beijing and Washington would mean a firmer USD amid relief about US economic progress. On a positive note, the US reported progress on talks with other major economies, such as India. Still, the main theme remains on how the two world’s largest economy will resolve their conflict.
Coming ahead, investors are looking at the upcoming US Consumer Price Index (CPI) release. Inflation, as measured by the CPI, is expected to have posted a modest advance in May, maybe not enough to twist the Federal Reserve’s (Fed) monetary policy, but enough to fuel ongoing concerns about the US economic health.
The daily chart for the XAU/USD pair shows the pair found buyers around a modestly bullish 20 Simple Moving Average (SMA) for a second consecutive day. The SMA provides support at around $3,302, while developing far above bullish 100 and 200 SMAs. The Momentum indicator eases and aims lower just above its 100 line, suggesting buying interest remains limited. Finally, the Relative Strength Index (RSI) indicator is flat at around 52, in line with the absence of directional strength. The bright metal would need to overcome the mentioned $3,350 region to turn bullish.
The near-term picture suggests XAU/USD could retest the $3,300 mark. The pair briefly surpassed a bearish 20 SMA, but was unable to retain ground above it. A flat 200 SMA at around $3,300, in the meantime, provided intraday support and reinforcing the round figure. Additionally, technical indicators aim modestly lower within negative levels, skewing the risk to the downside.
Support levels: 3,314.30 3,300.00 3,287.45
Resistance levels: 3,349.50 3,361.95 3,375.80
Generally speaking, a trade war is an economic conflict between two or more countries due to extreme protectionism on one end. It implies the creation of trade barriers, such as tariffs, which result in counter-barriers, escalating import costs, and hence the cost of living.
An economic conflict between the United States (US) and China began early in 2018, when President Donald Trump set trade barriers on China, claiming unfair commercial practices and intellectual property theft from the Asian giant. China took retaliatory action, imposing tariffs on multiple US goods, such as automobiles and soybeans. Tensions escalated until the two countries signed the US-China Phase One trade deal in January 2020. The agreement required structural reforms and other changes to China’s economic and trade regime and pretended to restore stability and trust between the two nations. However, the Coronavirus pandemic took the focus out of the conflict. Yet, it is worth mentioning that President Joe Biden, who took office after Trump, kept tariffs in place and even added some additional levies.
The return of Donald Trump to the White House as the 47th US President has sparked a fresh wave of tensions between the two countries. During the 2024 election campaign, Trump pledged to impose 60% tariffs on China once he returned to office, which he did on January 20, 2025. With Trump back, the US-China trade war is meant to resume where it was left, with tit-for-tat policies affecting the global economic landscape amid disruptions in global supply chains, resulting in a reduction in spending, particularly investment, and directly feeding into the Consumer Price Index inflation.
Just as we’ve been reporting to you about declining rig counts across the U.S. and in Oklahoma, now comes a prediction from the U.S. Energy Information Administration of falling oil prices and lower rig counts. It means more stacked oil drilling rigs and oil prices of $60 or lower.
The EIA came out with its prediction this week saying it expects the Brent crude oil price to fall to near $60 per barrel by the end of the year and to average about $59 per barrel in 2026. EIA expects the low price of crude oil to affect both U.S. crude oil production and retail gasoline prices in the short term.
In its June Short-Term Energy Outlook (STEO), EIA forecasts U.S. crude oil production to average about 13.4 million barrels per day this year, just below the record highs earlier this year. For 2026, the forecast is slightly lower than 2025 levels. EIA expects U.S. retail gasoline prices to average below $3.10 per gallon through the end of 2026, which is about 6% lower than the 2024 average price.
|
2024 |
2025 |
2026 |
|
|
Brent crude oil spot price (dollars per barrel) |
$81 |
$66 |
$59 |
|
Retail gasoline price (dollars per gallon) |
$3.30 |
$3.10 |
$3.10 |
|
U.S. crude oil production (million barrels per day) |
13.2 |
13.4 |
13.4 |
|
Natural gas price at Henry Hub (dollars per million British thermal units) |
$2.20 |
$4.00 |
$4.90 |
|
U.S. liquefied natural gas gross exports (billion cubic feet per day) |
12 |
15 |
16 |
|
Shares of U.S. electricity generation |
|
|
|
|
Natural gas |
42% |
40% |
40% |
|
Coal |
16% |
16% |
15% |
|
Renewables |
23% |
25% |
27% |
|
Nuclear |
19% |
19% |
18% |
|
U.S. GDP (percentage change) |
2.8% |
1.4% |
1.7% |
|
U.S. CO2 emissions (billion metric tons) |
4.8 |
4.8 |
4.8 |
|
Data source: U.S. Energy Information Administration, Short-Term Energy Outlook, June 2025 |
|||
Some key highlights from the June STEO include:
June 10, 2025 – Written by Frank Davies
STORY LINK Euro to Dollar Forecast: EUR to See “1.1370-1.1430 Range Today”
Euro-Zone and US surveys have both suggested a boost to investor confidence, but the dollar has failed to sustain gains with the Euro to Dollar (EUR/USD) exchange rate trading back above the 1.14 level from 1.1375 lows.
According to ING; “It’s hard to see EUR/USD breaking out of a 1.1370-1.1430 range today, with directional breakout risks equally balanced.”
CIBC is positive on the pair; “we anticipate underlying EUR resilience as the broad USD diversification narrative is set to persist.”
Events in Los Angeles will command media headlines. If tensions spread to other major cities or there is an overall escalation, there is the risk that wider confidence in US assets will take another hit.
Markets will also continue to monitor trade talks closely.
MUFG commented; “The talks are taking place amidst growing evidence of the economic disruption from the tariff war. The latest trade report from China released yesterday revealed that exports to the US declined by almost -20% in May which was the largest monthly drop since the start of COVID.”
Saxo chief investment strategist Charu Chanana commented; “The extension of talks and some positive sound bites from the U.S. officials could offer short-term relief, markets are unlikely to buy into this optimism without real structural progress.”

She added; “Unlike the Geneva talks, where tariff relief provided easy wins, the London talks are now tackling thornier issues like chip export controls, rare earths, and student visas.”
TD Securities commented; “A less exceptional US combined with a more confrontational trade policy may drive global investors to diversify away from USD-denominated assets.”
According to ING; “Look out for any updates on US-China trade talks. Any good news is probably a dollar positive in the current environment.”
The Euro-Zone Sentix investor confidence index improved to 0.2 for June from -8.1 the previous month and above consensus forecasts of -5.3.
Sentix commented; “There are signs of an upturn for the economy in the eurozone and Germany in June. The increase of +10.5 points in the expected values in particular gives cause for hope. Euroland is benefiting from a recovery in Germany.”
According to Scotiabank there is scope for further hawkish ECB rhetoric; “We see scope for EUR strength on the back of relative central bank policy as markets fade their expectations for cuts.”
Looking at the US outlook Sentix noted; “The shock caused by the tariff policy in the US is slowly subsiding. Situation scores in particular are rising strongly for the US economy. Expectations are also recovering by +11.0 points, but remain negative in absolute terms.”

It added; “Overall, the global economy is breathing a sigh of relief, even if the US tariff shock has not yet been fully absorbed.”
The US NFIB small-business confidence index improved to 98.8 for May from 95.8 the previous month and above expectations of 96.0.
According to the survey, expected business conditions and sales expectations contributed the greatest to the rise in the Index. The Uncertainty Index rose 2 points from April to 94.
ING notes that the Treasury will be holding the latest 3-year bond auction on Wednesday.
It added; “A poor auction could rekindle the weaker dollar story, where a pair like USD/JPY could lead the dollar lower in a more difficult environment for risk.”
International Money Transfer? Ask our resident FX expert a money transfer question or try John’s new, free, no-obligation personal service! ,where he helps every step of the way,
ensuring you get the best exchange rates on your currency requirements.
TAGS: Euro Dollar Forecasts
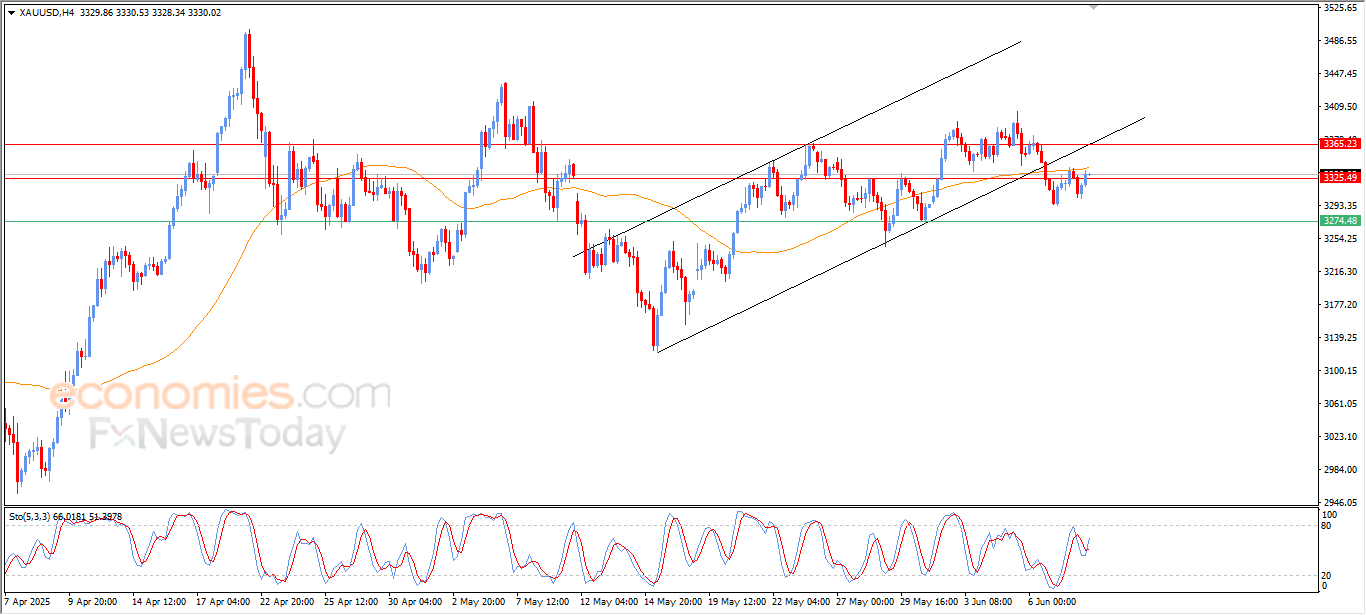
Gold (XAU/USD) has reversed course durub¡ng the European trading session on Tuesday, and is showing moderate gains, approaching resistance at $3,340 as the Dollar gives away gains with optimism about the outcome of the US-China meeting wearing off.
seems
A mild enthusiasm on the back of the positive comments from President Trump and US representatives regarding the developments of the negotiation seems to have faded, as the meeting extends for the second day. The US Dollar is giving away gains with investors turning more cautious, boosting demand for safe havens like Gold.
Investors are trimming their US Dollar longs, increasingly cautious about the outcome of the negotiations between the world’s two major economies, amid the lack of progress on trade deals. So far, only the UK has reached a rather modest one, while the clock ticks closer to the July 9 deadline.
The broader trend remains negative, with the precious metal correcting lower following a rally from May 15 lows. Intraday charts, however, show a bullish reaction from $3,290, which looks likely to extend beyond the previous support, now turned resistance at $3,340.,
Elliott Wave analysts would say that the pair has confirmed the completion of a bullish cycle and is on a three-wave correction. In this case, we would be on the A-B leg, which might extend to the reverse trendline, now at $3,370, before extending lower.
On the downside, supports are at the June 9 low, $3,290, and the May 15 and 19 highs, and May 29 lows at $3,245.
The table below shows the percentage change of US Dollar (USD) against listed major currencies today. US Dollar was the strongest against the British Pound.
| USD | EUR | GBP | JPY | CAD | AUD | NZD | CHF | |
|---|---|---|---|---|---|---|---|---|
| USD | 0.00% | 0.34% | 0.01% | -0.00% | 0.05% | 0.00% | -0.06% | |
| EUR | -0.00% | 0.35% | 0.00% | 0.03% | 0.07% | 0.00% | -0.04% | |
| GBP | -0.34% | -0.35% | -0.41% | -0.33% | -0.28% | -0.35% | -0.38% | |
| JPY | -0.01% | 0.00% | 0.41% | 0.00% | -0.01% | -0.10% | -0.16% | |
| CAD | 0.00% | -0.03% | 0.33% | -0.00% | 0.03% | -0.02% | -0.06% | |
| AUD | -0.05% | -0.07% | 0.28% | 0.00% | -0.03% | -0.04% | -0.12% | |
| NZD | 0.00% | -0.00% | 0.35% | 0.10% | 0.02% | 0.04% | -0.04% | |
| CHF | 0.06% | 0.04% | 0.38% | 0.16% | 0.06% | 0.12% | 0.04% |
The heat map shows percentage changes of major currencies against each other. The base currency is picked from the left column, while the quote currency is picked from the top row. For example, if you pick the US Dollar from the left column and move along the horizontal line to the Japanese Yen, the percentage change displayed in the box will represent USD (base)/JPY (quote).
resistance
No news for copper price by it continues fluctuation below the extra barrier at $4.8900, which obstacles the chances for resuming the bullish attack, to expect the domination of the sideways track in the near period, and there is a chance for forming some correctional waves, to reach $4.7500 reaching 50%Fibonacci correctional level at $4.6600.
While the price success to confirm breaching the mentioned barrier will reinforce the chances for renewing the bullish attempts, to expect reaching $5.0300 reaching the next barrier at $5.1000.
The expected trading range for today is between $4.7500 and $4.8900
Trend forecast: Fluctuated
The NZDCHF kept its stability in the last trading within the bullish channel’s levels, noticing forming weak trading due to the several barriers near the 0.8300 level that decreases the chances for recording any extra gains until now.
The repeated stability below the barrier will increase the efficiency of the bearish correctional track again, to expect reaching 0.8240, then attempt to press on the bullish channel’s support at 0.8210, while motivating the bullish track requires repeated closes above the barrier to reach the positive stations at 0.8375 and 0.8415.
The expected trading range for today is between 0.8210 and 0.8300
Trend forecast: Bearish
The GBP/USD price analysis shows the pound giving up its gains from the previous session amid dollar strength. The greenback recovered as market participants watched trade talks between China and the US in London. Meanwhile, traders are also preparing for the US consumer inflation report and the UK’s spending plans. Downbeat UK claimant count data also ignited a sell-off.
–Are you interested to learn more about crypto signals? Check our detailed guide-
After a call between the US and Chinese presidents, the two countries agreed to meet and discuss trade matters in London. The talks started after Trump accused China of not being true to their recent trade deal.
Recently, the two countries agreed to slash tariffs for the next 90 days. Moreover, this deal paused a raging trade war that had dimmed the outlook for the global economy. Therefore, any conflicts on trade revive tensions and fears for both economies. Meanwhile, talks boost investor confidence. However, it remains unclear whether the two countries will reach an agreement.
Meanwhile, traders are awaiting the US CPI report, which will provide clues about the outlook for Fed rate cuts. At the same time, a UK spending plan might shape the outlook for the economy and monetary policy.
Traders are not looking forward to any significant releases from the UK or the US. As a result, all focus will remain on trade talks.
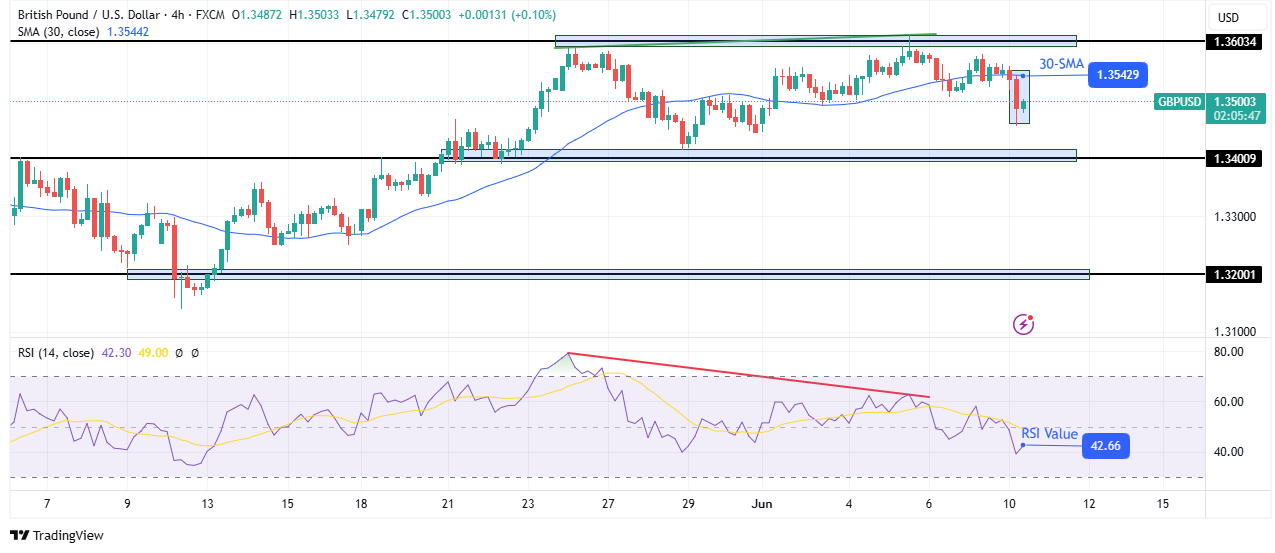
On the technical side, the GBP/USD price has broken below the 30-SMA, indicating a bearish shift in sentiment. At the same time, the price has made a solid red candle below the SMA, confirming strength in the new move. Currently, the price trades well below the SMA, with the RSI under 50, suggesting a bearish bias.
–Are you interested to learn more about forex robots? Check our detailed guide-
The shift comes after the previous rally paused at the 1.3603 resistance level and made a bearish divergence. This weakness allowed bears to gain momentum and take charge by pushing the price below the SMA.
Bears can now aim for the next support at the 1.3400 level. A break below this level would strengthen the bearish bias by making a lower low. On the other hand, if bears fail to achieve this, the price will bounce higher.
Looking to trade forex now? Invest at eToro!
67% of retail investor accounts lose money when trading CFDs with this provider. You should consider whether you can afford to take the high risk of losing your money.
No news for copper price by it continues fluctuation below the extra barrier at $4.8900, which obstacles the chances for resuming the bullish attack, to expect the domination of the sideways track in the near period, and there is a chance for forming some correctional waves, to reach $4.7500 reaching 50%Fibonacci correctional level at $4.6600.
While the price success to confirm breaching the mentioned barrier will reinforce the chances for renewing the bullish attempts, to expect reaching $5.0300 reaching the next barrier at $5.1000.
The expected trading range for today is between $4.7500 and $4.8900
Trend forecast: Fluctuated