The main category of Forex News.
You can use the search box below to find what you need.
[wd_asp id=1]
The main category of Forex News.
You can use the search box below to find what you need.
[wd_asp id=1]
In a shocking move that has defused a brutal trade war and boosted international markets, the United States and China decided on May 12, to significantly reduce tariffs on each other’s goods for the first 90 days.
This naturally sparked a continued downward spiral in gold and prices touched $3121 for XAUUSD.
This week, gold is looking to retrace and take out the late sellers in the market. Let’s discuss the key pivot levels for gold buying and selling in this XAUUSD weekly forecast of May 19th to May 23rd, 2025.
In the previous week’s forecast we gave the selling level of gold in 1h, from where gold dumped 1420 points.
We also shared a major buying level of gold in the weekly FVG, from which gold is up 827 points, at the time of writing.

Now let’s start by discussing the key economic events of this week and their possible impact on the price of XAUUSD.
Not many significant U.S. economic reports are scheduled for release this week, but it is still expected to impact XAUUSD.
May 22nd, Thursday: Flash Manufacturing PMI (Purchasing Managers’ Index) and Flash Services PMI
Two early measures of economic health are the Flash Manufacturing PMI and the Flash Services PMI. They have the following effects on the gold vs. US dollar (XAU/USD) pair:
In summary, while negative PMI data can push gold prices higher, positive data tends to push them lower.
Gold has already tested its weekly FVG and closed above it, which is a bullish sign for gold. The next targets according to the weekly timeframe can be $3260 and $3328.86 which signify the untested lows and highs of the previous weekly candles.

Gold is showing bullish momentum in all lower time frames which makes buying an ideal position to enter and hold.
On the 1 hour timeframe the strongest buying level is coming up at the bullish order block of $3129.85-3152.56.

On the 4h timeframe the buying opportunity is much lower around $3098-$3038. This is also the the last daily FVG of this entire bullish rally for which the low is $2956 which can be your invalidation point for buys and flipping towards sells on retracement, but that is far away for now.

In the 4 hour timeframe selling can be expected from the $3284-3325 levels, due to FVG, and structure area of the 4h timeframe.

Below, we’ll take a look at support and resistance levels for XAUUSD this week.
To conclude, the safe strategy in gold is to look for sells in the lower time frame levels and look for buying in the higher time frame levels. You can mark these levels on your chart for easier trading guidance when you trade.
Disclosure: This article does not represent investment advice. The content and materials featured on this page are for educational purposes only.
GBP/USD gathers bullish momentum in the European session and trades at its highest level in nearly two weeks above 1.3350. The technical outlook suggests that the pair has more room on the upside before turning technically overbought.
The table below shows the percentage change of British Pound (GBP) against listed major currencies today. British Pound was the strongest against the US Dollar.
| USD | EUR | GBP | JPY | CAD | AUD | NZD | CHF | |
|---|---|---|---|---|---|---|---|---|
| USD | -0.79% | -0.62% | -0.29% | -0.15% | -0.32% | -0.19% | -0.38% | |
| EUR | 0.79% | -0.10% | 0.29% | 0.46% | 0.36% | 0.42% | 0.18% | |
| GBP | 0.62% | 0.10% | 0.12% | 0.56% | 0.47% | 0.52% | 0.28% | |
| JPY | 0.29% | -0.29% | -0.12% | 0.15% | 0.15% | 0.30% | -0.03% | |
| CAD | 0.15% | -0.46% | -0.56% | -0.15% | -0.16% | -0.05% | -0.28% | |
| AUD | 0.32% | -0.36% | -0.47% | -0.15% | 0.16% | 0.05% | -0.17% | |
| NZD | 0.19% | -0.42% | -0.52% | -0.30% | 0.05% | -0.05% | -0.24% | |
| CHF | 0.38% | -0.18% | -0.28% | 0.03% | 0.28% | 0.17% | 0.24% |
The heat map shows percentage changes of major currencies against each other. The base currency is picked from the left column, while the quote currency is picked from the top row. For example, if you pick the British Pound from the left column and move along the horizontal line to the US Dollar, the percentage change displayed in the box will represent GBP (base)/USD (quote).
The broad-based US Dollar (USD) weakness fuels GBP/USD’s rally at the beginning of the week as markets react to Moody’s downgrade of the United States’ credit rating late Friday.
Moody’s announced that it downgraded the US’ credit rating to ‘AA1’ from ‘AAA’, citing concerns about the growing $36 trillion debt pile. Moody’s explained that the fiscal proposals under considerations were unlikely to lead to a sustained, multi-year reduction in deficits, and added that it forecasts the federal debt burden to rise to about 134% of Gross Domestic Product by 2035, compared with 98% in 2024, per Reuters.
The US economic calendar will not feature any high-impact data releases in the second half of the day. Hence, investors will pay close attention to comments from Federal Reserve (Fed) officials.
The University of Michigan’s preliminary Consumer Sentiment Survey for May showed that consumers’ one-year inflation expectation jumped to 7.3% from 6.5% in April. In case Fed officials hint that they could refrain from lowering the policy rate multiple times, citing heightened concerns about the inflation outlook, the USD could gather strength against its peers and make it difficult for GBP/USD to extend its rally.
Atlanta Fed President Raphael Bostic said last Friday that he expects the Fed to lower the policy rate once this year. According to the CME FedWatch Tool, markets are currently pricing in about a 70% chance of the Fed cutting the policy rate at least twice this year.
The Relative Strength Index (RSI) indicator on the 4-hour chart climbed above 60, pointing to a buildup of bullish momentum. On the upside, 1.3380 (static level) aligns as immediate resistance before 1.3440 (upper limit of the latest uptrend) and 1.3500 (static level, round level).
Looking south, supports could be seen at 1.3300 (100-period Simple Moving Average (SMA), static level), 1.3270 (Fibonacci 23.6% retracement of the latest uptrend) and 1.3220 (200-period SMA).
The Pound Sterling (GBP) is the oldest currency in the world (886 AD) and the official currency of the United Kingdom. It is the fourth most traded unit for foreign exchange (FX) in the world, accounting for 12% of all transactions, averaging $630 billion a day, according to 2022 data.
Its key trading pairs are GBP/USD, also known as ‘Cable’, which accounts for 11% of FX, GBP/JPY, or the ‘Dragon’ as it is known by traders (3%), and EUR/GBP (2%). The Pound Sterling is issued by the Bank of England (BoE).
The single most important factor influencing the value of the Pound Sterling is monetary policy decided by the Bank of England. The BoE bases its decisions on whether it has achieved its primary goal of “price stability” – a steady inflation rate of around 2%. Its primary tool for achieving this is the adjustment of interest rates.
When inflation is too high, the BoE will try to rein it in by raising interest rates, making it more expensive for people and businesses to access credit. This is generally positive for GBP, as higher interest rates make the UK a more attractive place for global investors to park their money.
When inflation falls too low it is a sign economic growth is slowing. In this scenario, the BoE will consider lowering interest rates to cheapen credit so businesses will borrow more to invest in growth-generating projects.
Data releases gauge the health of the economy and can impact the value of the Pound Sterling. Indicators such as GDP, Manufacturing and Services PMIs, and employment can all influence the direction of the GBP.
A strong economy is good for Sterling. Not only does it attract more foreign investment but it may encourage the BoE to put up interest rates, which will directly strengthen GBP. Otherwise, if economic data is weak, the Pound Sterling is likely to fall.
Another significant data release for the Pound Sterling is the Trade Balance. This indicator measures the difference between what a country earns from its exports and what it spends on imports over a given period.
If a country produces highly sought-after exports, its currency will benefit purely from the extra demand created from foreign buyers seeking to purchase these goods. Therefore, a positive net Trade Balance strengthens a currency and vice versa for a negative balance.
Keep in mind that the season for natural gas is typically more of a winter season, until you get to the very hottest parts of summer. This is because it is an American base contract more than anything else, and Americans tend to use natural gas to heat their homes, as well as produce extra electricity in order to run air conditioning.

While natural gas of course is important in other parts of the world, the Henry Hub contract is what most people trade, and therefore you have to be aware of what’s going on in America more than anything else.
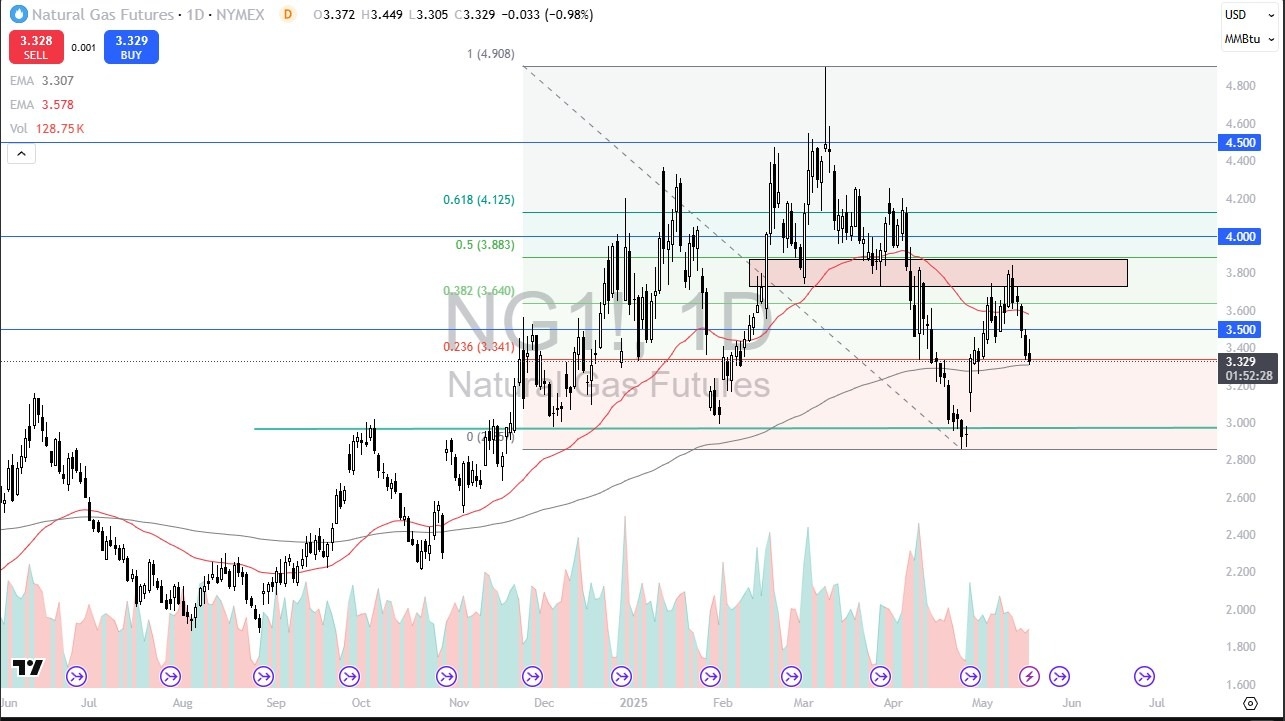
As of late, we have seen the Europeans buying a lot of liquefied natural gas, which of course has a major influence on what we are seeing here. If we break down below the 200 Day EMA, the market is likely to go looking to the $3.00 level, which obviously has a certain amount of psychology attached to it as it is a large, round, psychologically significant figure. Anything below there would be extraordinarily negative and could send the market down to the $2.40 level before it is all said and done.
Short-term rallies are likely, but those should end up being selling opportunities, as natural gas is going to be less in demand for the next couple of months, so I have no interest in buying this market, unless of course there is some type of external factor that drives up the price such as war, or some type of major disruption in supply for some other reason. I remain bearish, and probably will for a few months.
Ready to trade Forex daily analysis and predictions? Here are the best commodity trading platforms to choose from.
Christopher Lewis has been trading Forex and has over 20 years experience in financial markets. Chris has been a regular contributor to Daily Forex since the early days of the site. He writes about Forex for several online publications, including FX Empire, Investing.com, and his own site, aptly named The Trader Guy. Chris favours technical analysis methods to identify his trades and likes to trade equity indices and commodities as well as Forex. He favours a longer-term trading style, and his trades often last for days or weeks.
The USD/JPY forecast shows further dollar weakness after a downgrade to the US government’s credit rating. At the same time, market participants were worried about progress on trade negotiations between the US and its trading partners.
–Are you interested in learning more about buying NFT tokens? Check our detailed guide-
The dollar fell on Friday after data revealed weak consumer sentiment. According to the report, consumer sentiment came in at 50.8 compared to expectations of 53.1. The unexpected drop revealed that consumers were still not confident in the economy.
Moreover, the greenback started the week down against most of its peers, including the yen. This happened after Moody’s downgraded the US government’s credit rating, citing its growing debt size. This was another reason for traders to dump the dollar and buy the yen.
Furthermore, demand for the safe-haven yen increased after reports that Trump was threatening tariffs on countries that are not negotiating in good faith. The US has announced trade deals with the UK and China, which boosted sentiment. However, talks with India, Japan, and South Korea seem to have stalled. As a result, Trump’s tariff threats caused some uncertainty in the market.
Meanwhile, BoJ policymakers are ready to keep hiking interest rates as long as the economy pushes past Trump’s tariff impacts.
Market participants do not expect any key economic releases from the US and Japan.
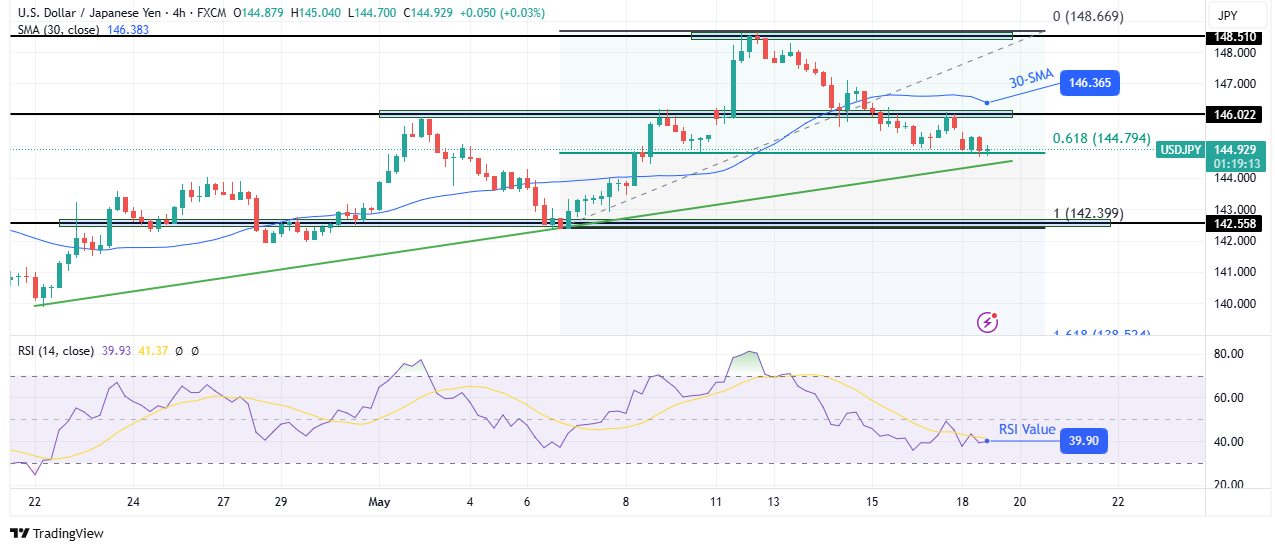
On the technical side, the USD/JPY price has pulled back and is approaching its support trendline. The price trades below the 30-SMA, with the RSI under 50, indicating a bearish bias. At the same time, the price has reached the 0.618 Fib retracement level that might act as a support.
–Are you interested in learning more about forex robots? Check our detailed guide-
Therefore, USD/JPY might soon bounce higher. The price has maintained a shallow uptrend that chops through the SMA but respects the trendline. Consequently, the uptrend will continue if bulls return near the trendline support. Such an outcome would allow the price to break above the 146.02 resistance level and the 30-SMA. Bulls would likely break above the 148.51 resistance level to make a new high.
On the other hand, a break below the trendline would signal a shift in sentiment. It would allow bears to retest the 142.55 support level.
Looking to trade forex now? Invest at eToro!
68% of retail investor accounts lose money when trading CFDs with this provider. You should consider whether you can afford to take the high risk of losing your money.
Gold price is showing some fresh signs of life early Monday, following a weekly decline. The further upside in Gold price depends on the upcoming Fedspeak and talks over potential US trade deals amid rising concerns over US fiscal debt.
Markets have resorted to selling US assets as they respond to the credit blow, marking the start of a new week. Moody’s downgraded the US sovereign credit rating on Friday by one notch from its pristine “Aaa” rating to “Aa1”.
The rating downgrade is based on concerns about the nation’s growing $36 trillion debt pile and higher interest payments amid US President Donald Trump’s erratic economic and trade policies.
The US Dollar (USD) wilted alongside the Treasury bonds and US equity futures, reviving the safe-haven appeal of Gold price. However, rising US Treasury bond yields on economic concerns limit the upside attempts in the yellow metal, leaving the bullion confined in a range above $3,200.
Further, US Treasury Secretary Scott Bessent’s tariff threat on Sunday also keeps markets on the edge, allowing Gold price some sigh of relief. Bessent said, “Trump has put them (trading partners) on notice that if you do not negotiate in good faith, you will ratchet back up to your April 2 level.”
These factors have unnerved markets, and hence, they pay little heed to the news that the House panel approved President Trump’s tax cut bill early Monday, paving the way for possible passage in the House of Representatives later this week.
In the day ahead, Gold price could likely remain supported as the USD could face headwinds from growing economic and fiscal concerns. Data released last week showed that the US Producer Price Index (PPI) in April fell unexpectedly, while Retail Sales growth slowed, and Consumer Price Index (CPI) rose less than expected.
However, any optimistic headlines on the expected US trade agreements with South Korea, India and Japan could refuel the Gold price downside. Cautious remarks from Federal Reserve (Fed) policymakers will likely hinder the rebound in the bright metal.
Technically, Gold price remains exposed to further downside risks as the 14-day Relative Strength Index (RSI) sits beneath the midline, near 48.50.
The bright metal remains capped between the 21-day Simple Moving Average (SMA) at $3,299 and the 50-day SMA at $3,169.
So long as the price stays above the throwback support of the 50-day SMA, a brief recovery toward the 21-day SMA remains in the offing.
Acceptance above that level will add legs to the upswing, exposing the falling trendline resistance at $3,407.
On the downside, if sellers manage to crack the 50-day SMA on a sustained basis, a fresh sell-off could be fuelled toward the $3,100 mark.
The April 10 low of $3,072 would then come to the rescue of buyers.
Tariffs are customs duties levied on certain merchandise imports or a category of products. Tariffs are designed to help local producers and manufacturers be more competitive in the market by providing a price advantage over similar goods that can be imported. Tariffs are widely used as tools of protectionism, along with trade barriers and import quotas.
Although tariffs and taxes both generate government revenue to fund public goods and services, they have several distinctions. Tariffs are prepaid at the port of entry, while taxes are paid at the time of purchase. Taxes are imposed on individual taxpayers and businesses, while tariffs are paid by importers.
There are two schools of thought among economists regarding the usage of tariffs. While some argue that tariffs are necessary to protect domestic industries and address trade imbalances, others see them as a harmful tool that could potentially drive prices higher over the long term and lead to a damaging trade war by encouraging tit-for-tat tariffs.
During the run-up to the presidential election in November 2024, Donald Trump made it clear that he intends to use tariffs to support the US economy and American producers. In 2024, Mexico, China and Canada accounted for 42% of total US imports. In this period, Mexico stood out as the top exporter with $466.6 billion, according to the US Census Bureau. Hence, Trump wants to focus on these three nations when imposing tariffs. He also plans to use the revenue generated through tariffs to lower personal income taxes.
EUR/USD gains traction and trades in positive territory above 1.1200 to begin the new week. The pair could face a strong resistance level at 1.1270.
The table below shows the percentage change of Euro (EUR) against listed major currencies today. Euro was the strongest against the US Dollar.
| USD | EUR | GBP | JPY | CAD | AUD | NZD | CHF | |
|---|---|---|---|---|---|---|---|---|
| USD | -0.66% | -0.58% | -0.36% | -0.16% | -0.32% | -0.26% | -0.38% | |
| EUR | 0.66% | -0.17% | 0.15% | 0.33% | 0.23% | 0.23% | 0.06% | |
| GBP | 0.58% | 0.17% | -0.02% | 0.50% | 0.40% | 0.40% | 0.23% | |
| JPY | 0.36% | -0.15% | 0.02% | 0.22% | 0.20% | 0.30% | 0.04% | |
| CAD | 0.16% | -0.33% | -0.50% | -0.22% | -0.15% | -0.10% | -0.27% | |
| AUD | 0.32% | -0.23% | -0.40% | -0.20% | 0.15% | -0.00% | -0.16% | |
| NZD | 0.26% | -0.23% | -0.40% | -0.30% | 0.10% | 0.00% | -0.17% | |
| CHF | 0.38% | -0.06% | -0.23% | -0.04% | 0.27% | 0.16% | 0.17% |
The heat map shows percentage changes of major currencies against each other. The base currency is picked from the left column, while the quote currency is picked from the top row. For example, if you pick the Euro from the left column and move along the horizontal line to the US Dollar, the percentage change displayed in the box will represent EUR (base)/USD (quote).
The selling pressure surrounding the US Dollar (USD) following Moody’s downgrade of the United States’ credit rating helps EUR/USD push higher in the European morning on Monday. The USD Index, which tracks the USD’s performance against a basket of six major currencies, was last seen losing 0.6% on the day below 100.50, pointing to a broad-based USD weakness.
Moody’s announced late Friday that it downgraded the US’ credit rating to ‘AA1’ from ‘AAA’, citing concerns about the growing $36 trillion debt pile. “Successive US administrations and Congress have failed to agree on measures to reverse the trend of large annual fiscal deficits and growing interest costs,” Moody’s explained, per Reuters.
In the second half of the day, several Federal Reserve (Fed) policymakers will be delivering speeches.
Late last week, Atlanta Fed President Raphael Bostic said that he expects just one rate cuts this year amid uncertainty. In case Fed officials adopt a similar tone, the USD could stage a rebound and limit EUR/USD’s upside. According to the CME FedWatch Tool, markets are currently pricing in about a 70% probability of the Fed cutting the policy rate at least twice this year.
The Relative Strength Index (RSI) indicator on the 4-hour chart rises toward 60, reflecting a buildup of bullish momentum.
On the upside, 1.1270 (Fibonacci 38.2% retracement of the latest uptrend, 100-period Simple Moving Average (SMA), 200-period SMA) aligns as a key resistance level before 1.1300 (static level) and 1.1380 (Fibonacci 23.6% retracement).
Looking south, the first support level could be spotted at 1.1200 (static level, round level) ahead of 1.1170 (Fibonacci 50% retracement) and 1.1080 (Fibonacci 61.8% retracement).
The Euro is the currency for the 19 European Union countries that belong to the Eurozone. It is the second most heavily traded currency in the world behind the US Dollar. In 2022, it accounted for 31% of all foreign exchange transactions, with an average daily turnover of over $2.2 trillion a day.
EUR/USD is the most heavily traded currency pair in the world, accounting for an estimated 30% off all transactions, followed by EUR/JPY (4%), EUR/GBP (3%) and EUR/AUD (2%).
The European Central Bank (ECB) in Frankfurt, Germany, is the reserve bank for the Eurozone. The ECB sets interest rates and manages monetary policy.
The ECB’s primary mandate is to maintain price stability, which means either controlling inflation or stimulating growth. Its primary tool is the raising or lowering of interest rates. Relatively high interest rates – or the expectation of higher rates – will usually benefit the Euro and vice versa.
The ECB Governing Council makes monetary policy decisions at meetings held eight times a year. Decisions are made by heads of the Eurozone national banks and six permanent members, including the President of the ECB, Christine Lagarde.
Eurozone inflation data, measured by the Harmonized Index of Consumer Prices (HICP), is an important econometric for the Euro. If inflation rises more than expected, especially if above the ECB’s 2% target, it obliges the ECB to raise interest rates to bring it back under control.
Relatively high interest rates compared to its counterparts will usually benefit the Euro, as it makes the region more attractive as a place for global investors to park their money.
Data releases gauge the health of the economy and can impact on the Euro. Indicators such as GDP, Manufacturing and Services PMIs, employment, and consumer sentiment surveys can all influence the direction of the single currency.
A strong economy is good for the Euro. Not only does it attract more foreign investment but it may encourage the ECB to put up interest rates, which will directly strengthen the Euro. Otherwise, if economic data is weak, the Euro is likely to fall.
Economic data for the four largest economies in the euro area (Germany, France, Italy and Spain) are especially significant, as they account for 75% of the Eurozone’s economy.
Another significant data release for the Euro is the Trade Balance. This indicator measures the difference between what a country earns from its exports and what it spends on imports over a given period.
If a country produces highly sought after exports then its currency will gain in value purely from the extra demand created from foreign buyers seeking to purchase these goods. Therefore, a positive net Trade Balance strengthens a currency and vice versa for a negative balance.
The GBPJPY pair remains affected by the negative pressures, which forces it to fluctuate below the extra support at 193.15 level, which forces it to delay the bullish rally on the current trading, while the stability of the moving average 55 above the support at 191.50, stochastic approach from 20 level, these factors make us wait for gathering the positive momentum, then begin targeting some of the positive stations, by its rally to 194.50 and 195.30.
While the decline below 191.50 and providing a negative close will confirm its move to the bearish track, to expect suffering big losses by reaching 190.40.
The expected trading range for today is between 192.20 and 194.10
Trend forecast: Bullish
Do you need help in trading decisions? Do you want to learn how to start trading?
Join Economies.com VIP Club and benefit from over 15 years of market analysis expertise and get:
Special Offer: Subscribe to the Economies.com VIP channel and get also a free subscription to a trusted trading signals channel provided by Best Trading Signal.
The GBPJPY pair remains affected by the negative pressures, which forces it to fluctuate below the extra support at 193.15 level, which forces it to delay the bullish rally on the current trading, while the stability of the moving average 55 above the support at 191.50, stochastic approach from 20 level, these factors make us wait for gathering the positive momentum, then begin targeting some of the positive stations, by its rally to 194.50 and 195.30.
While the decline below 191.50 and providing a negative close will confirm its move to the bearish track, to expect suffering big losses by reaching 190.40.
The expected trading range for today is between 192.20 and 194.10
Trend forecast: Bullish
Do you need help in trading decisions? Do you want to learn how to start trading?
Join Economies.com VIP Club and benefit from over 15 years of market analysis expertise and get:
Special Offer: Subscribe to the Economies.com VIP channel and get also a free subscription to a trusted trading signals channel provided by Best Trading Signal.
Copper price began forming a negative move, activating with the negativity of the main indicators, to settle near the extra support at $4.5000, facing negative pressures will increase the chances for breaking the current support, to open the way towards targeting extra negative stations, which might begin at $4.4500 reaching $4.3100.
The failure to break the current support might push the price to form mixed trading, and there is a new chance for targeting 50%Fibonacci correction level near $4.6600.
The expected trading range for today is between $4.4500 and $4.5600
Trend forecast: Bearish
Do you need help in trading decisions? Do you want to learn how to start trading?
Join Economies.com VIP Club and benefit from over 15 years of market analysis expertise and get:
Special Offer: Subscribe to the Economies.com VIP channel and get also a free subscription to a trusted trading signals channel provided by Best Trading Signal.
The GBPJPY pair remains affected by the negative pressures, which forces it to fluctuate below the extra support at 193.15 level, which forces it to delay the bullish rally on the current trading, while the stability of the moving average 55 above the support at 191.50, stochastic approach from 20 level, these factors make us wait for gathering the positive momentum, then begin targeting some of the positive stations, by its rally to 194.50 and 195.30.
While the decline below 191.50 and providing a negative close will confirm its move to the bearish track, to expect suffering big losses by reaching 190.40.
The expected trading range for today is between 192.20 and 194.10
Trend forecast: Bullish
Do you need help in trading decisions? Do you want to learn how to start trading?
Join Economies.com VIP Club and benefit from over 15 years of market analysis expertise and get:
Special Offer: Subscribe to the Economies.com VIP channel and get also a free subscription to a trusted trading signals channel provided by Best Trading Signal.