The main category of Forex News.
You can use the search box below to find what you need.
[wd_asp id=1]
The main category of Forex News.
You can use the search box below to find what you need.
[wd_asp id=1]
This is a follow-up analysis of our prior report “”, dated 17 April 2025.
Since our last publication, the has staged an initial push down to test the first medium-term support zone of 140.30/140.00, as highlighted (it printed an intraday low of 139.89 on 22 April).
Before the expected relief US dollar bounce took shape, the USD/JPY rallied by 4.4% to hit an intraday high of 145.93 on 2 May.
A setback occurred, causing it to slide towards an intraday low of 142.35 on 6 May.
The initial two weeks of US dollar strength against the Japanese yen have been reinforced by the recently concluded Bank of Japan (BoJ) monetary policy decision meeting last Thursday, 1 May. The BoJ switched into a “dovish hold” stance by keeping its short-term policy unchanged at 0.5% but slashed its current fiscal year growth forecast to 0.5% from 1.1%, citing trade tariff uncertainty.
However, the Japanese yen’s strength against the US dollar was short-lived as the USD/JPY managed to propel higher by 4.4% to hit a high of 148.65 on Monday, 12 May, triggered by a renewed bout of risk-on sentiment over the growing optimism of US-China trade tensions de-escalation.
Fig 1: Japan implied forward short-term interest rate curve as of 15 May 2025 (Source: Macro Micro)
Market expectations for Bank of Japan rate hikes in 2025 have softened compared to three months ago. The forward-implied short-term policy rate, derived from interest rate futures, has shifted lower, now projected at 0.66% by December 2025, down from 0.83% previously. However, this remains slightly above the 0.57% level seen just a month ago (see Fig 1).
However, other factors can support a potential resurgence of Japanese yen strength.

Fig 2: 10-YR & 2-YR yield spreads of US Treasuries/JGBs medium-term trends as of 16 May 2025 (Source: TradingView)
Since 6 January 2025, the and yield spreads of the US Treasury notes over Japanese Government Bonds (JGBs) have continued to narrow (trended downwards) below their respective key medium-term pivotal resistances of 3.60% and 3.84%, respectively.
If their downward trajectory remains intact, the 10-year and 2-year yield spreads of the US Treasury notes over JGBs may see further downside towards 2.47% and 2.90% next, which in turn may trigger further downside pressure on the USD/JPY (see Fig 2).

Fig 3: USD/JPY medium-term trend as of 16 May 2025 (Source: TradingView)
The USD/JPY’s swift intraday rally of 2.1% seen on Monday, 16 May, is the best single-day gain of the USD/JPY since 17 June 2022.
Interestingly, the bullish momentum of the US dollar’s strength was short-lived, and the USD/JPY staged a decline of -2.5% to print an intraday low of 144.92 on Friday, 16 May at the time of writing, which wiped out its initial gains (see Fig 3).
In addition, the price actions of the USD/JPY have reintegrated back below its 50-day moving average and the medium-term descending trendline from its 10 January 2025 swing high, coupled with a bearish momentum condition being flashed out on its daily RSI momentum indicator.
Hence, the rally of 16 May is likely considered a “head fake” failure, a bullish breakout. Watch the 149.00 key medium-term pivotal resistance (also the key 200-day moving average), and a break below the 144.10 key intermediate support may see further weakness on the USD/JPY to retest 140.30/140.00 medium-term support in the first step before exposing the next medium-term supports at 138.90 and 137.10/136.50.
On the other hand, a clearance above 149.00 invalidates the bearish scenario for a recovery towards the next medium-term resistances at 151.30 and 154.50.
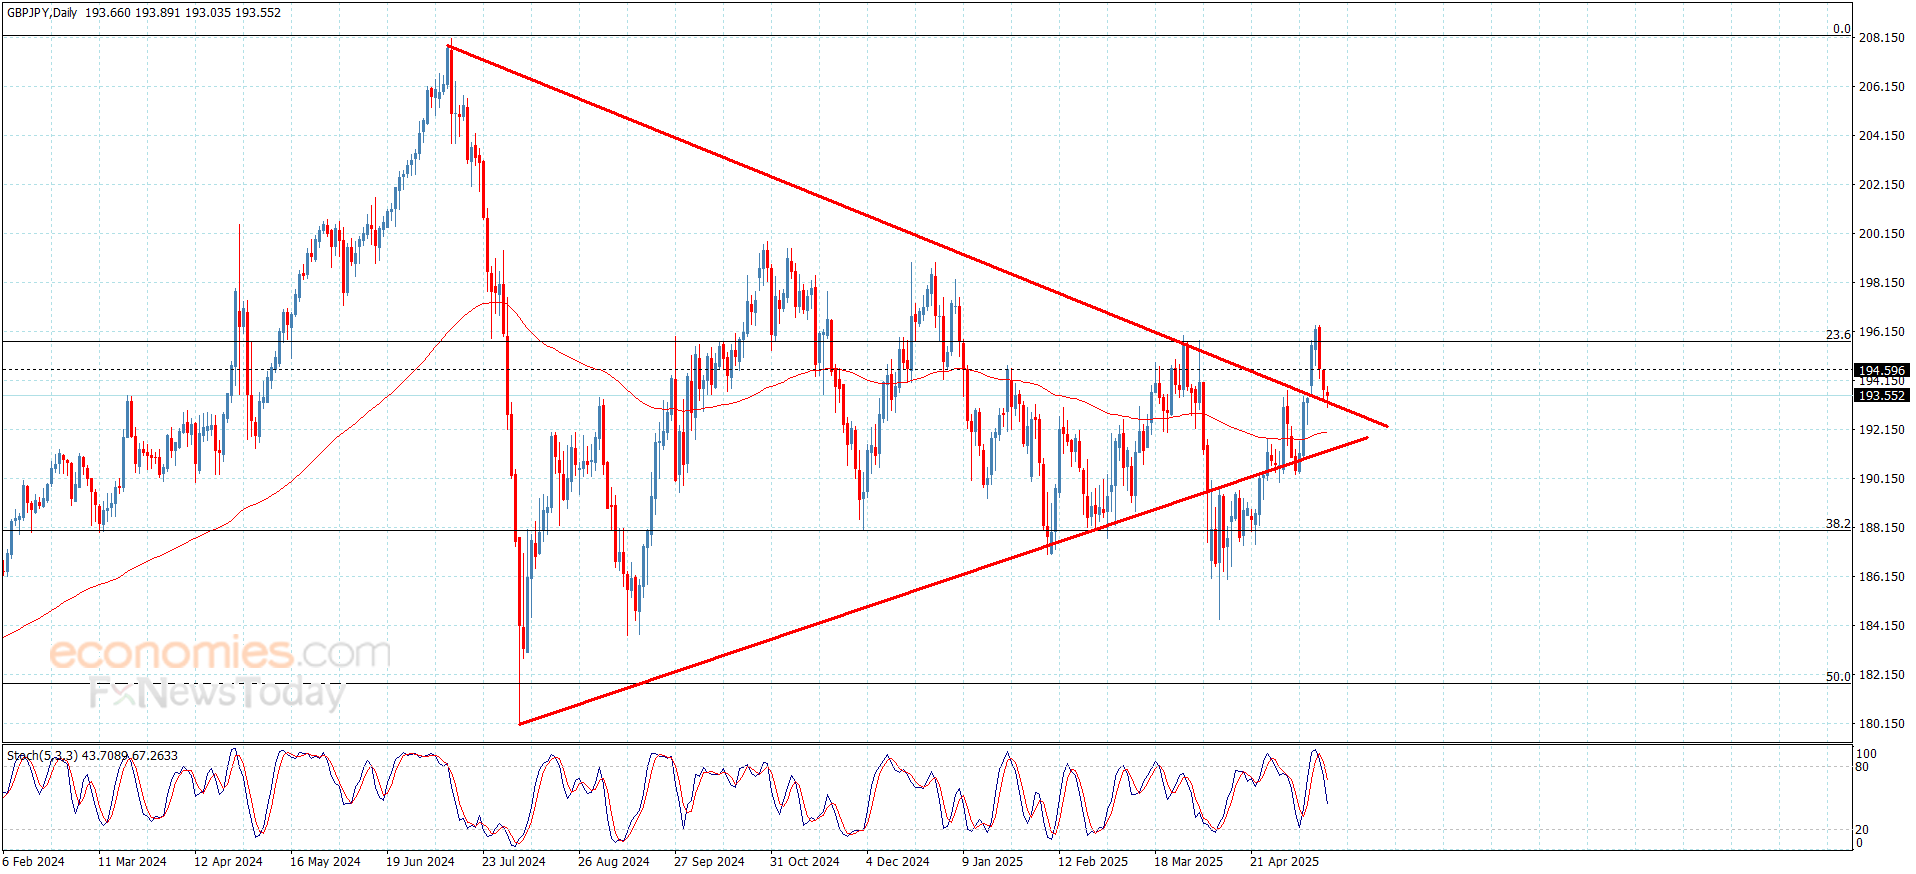
The GBPJPY pair affected by the bearish correctional bias domination, to settle near the support at 193.15, the continuation of the main indicator’s contradiction might force the price to provide new mixed trading, but its stability above the mentioned support will increase the chances for renewing the bullish attempts, which targets 194.55 level, to extend the trading towards the next resistance at 195.70.
In case reaching below the current support, we recommend the neutrality and monitoring the price behavior due to the factors that assist to decrease the negativity, starting from the moving average 55 stability below the current trading and its stability near 192.05, besides the continuation of forming a solid support at 191.40 level, to decrease the chances for renewing the negative attack on the upcoming trading.
The expected trading range for today is between 193.00 and 194.55
Trend forecast: Bullish
Do you need help in trading decisions? Do you want to learn how to start trading?
Join Economies.com VIP Club and benefit from over 15 years of market analysis expertise and get:
Special Offer: Subscribe to the Economies.com VIP channel and get also a free subscription to a trusted trading signals channel provided by Best Trading Signal.
The GBPJPY pair affected by the bearish correctional bias domination, to settle near the support at 193.15, the continuation of the main indicator’s contradiction might force the price to provide new mixed trading, but its stability above the mentioned support will increase the chances for renewing the bullish attempts, which targets 194.55 level, to extend the trading towards the next resistance at 195.70.
In case reaching below the current support, we recommend the neutrality and monitoring the price behavior due to the factors that assist to decrease the negativity, starting from the moving average 55 stability below the current trading and its stability near 192.05, besides the continuation of forming a solid support at 191.40 level, to decrease the chances for renewing the negative attack on the upcoming trading.
The expected trading range for today is between 193.00 and 194.55
Trend forecast: Bullish
Do you need help in trading decisions? Do you want to learn how to start trading?
Join Economies.com VIP Club and benefit from over 15 years of market analysis expertise and get:
Special Offer: Subscribe to the Economies.com VIP channel and get also a free subscription to a trusted trading signals channel provided by Best Trading Signal.
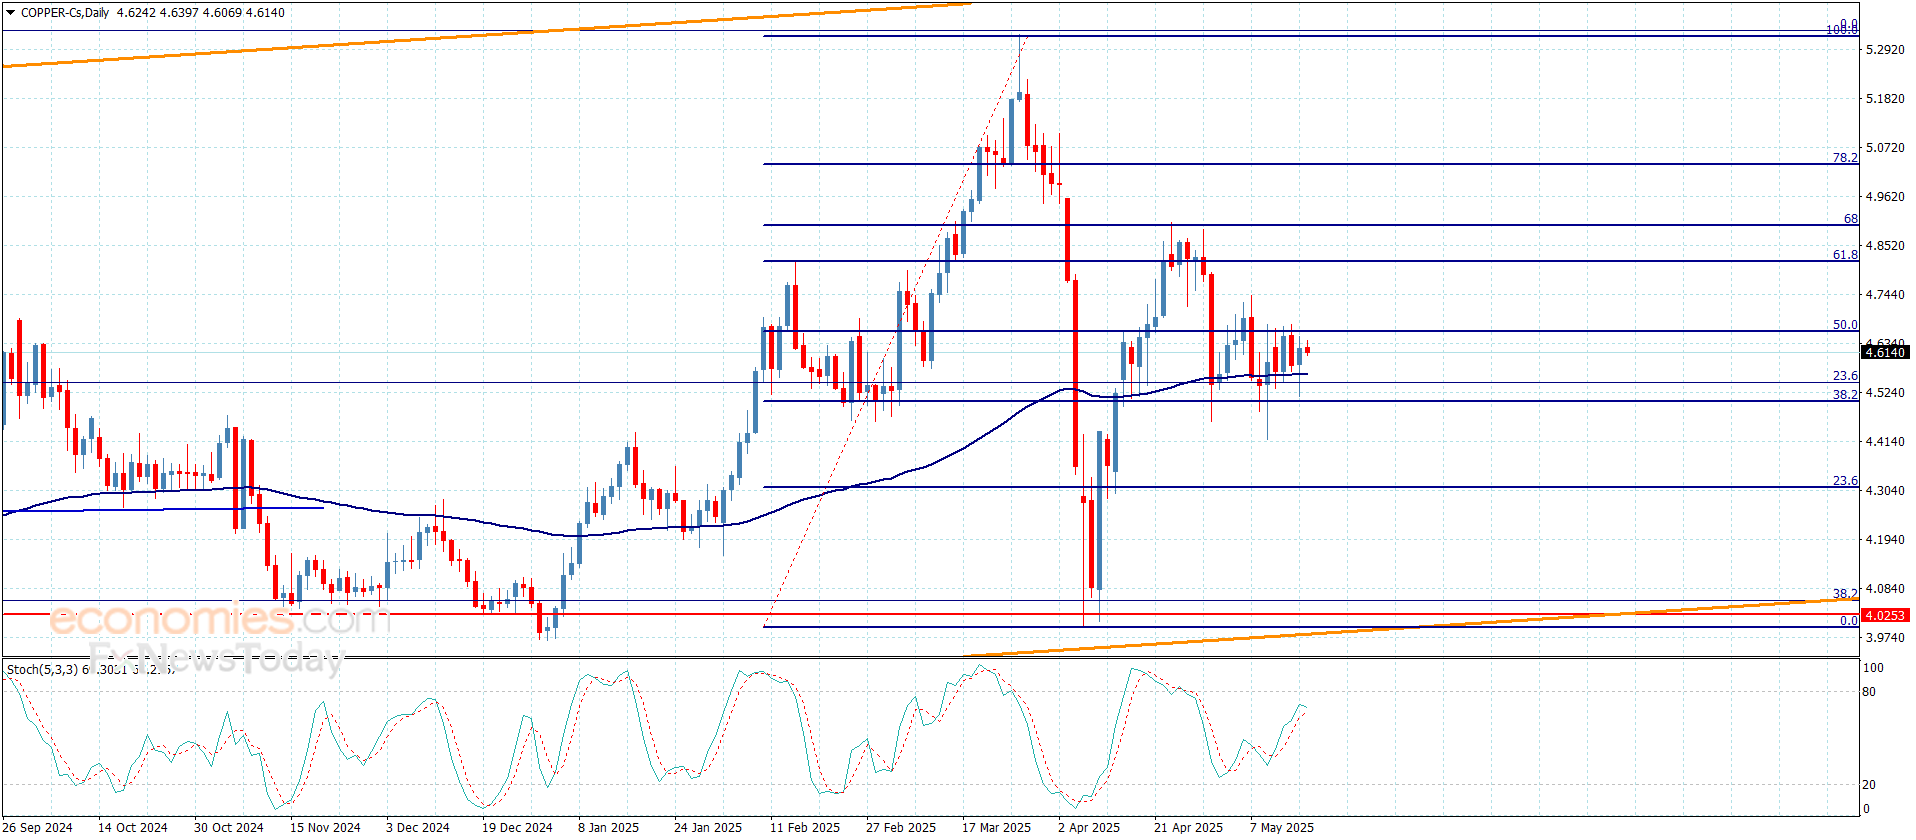
No news for Copper price until this moment by its repeated sideways fluctuation near $4.6200 level, attempting to settle below the initial barrier at $4.6600, reinforcing the chances for activating the suggested negative scenario, reminding you that the initial targets are located near $4.4500 and $4.3100 level.
Note that regaining the bullish bias requires forming strong bullish waves, to surpass the resistance at $4.9100, and holding above it to open the way towards achieving big gains that might begin at $5.0300.
The expected trading range for today is between $4.4500 and $4.6800
Trend forecast: Bearish
Do you need help in trading decisions? Do you want to learn how to start trading?
Join Economies.com VIP Club and benefit from over 15 years of market analysis expertise and get:
Special Offer: Subscribe to the Economies.com VIP channel and get also a free subscription to a trusted trading signals channel provided by Best Trading Signal.
The GBPJPY pair affected by the bearish correctional bias domination, to settle near the support at 193.15, the continuation of the main indicator’s contradiction might force the price to provide new mixed trading, but its stability above the mentioned support will increase the chances for renewing the bullish attempts, which targets 194.55 level, to extend the trading towards the next resistance at 195.70.
In case reaching below the current support, we recommend the neutrality and monitoring the price behavior due to the factors that assist to decrease the negativity, starting from the moving average 55 stability below the current trading and its stability near 192.05, besides the continuation of forming a solid support at 191.40 level, to decrease the chances for renewing the negative attack on the upcoming trading.
The expected trading range for today is between 193.00 and 194.55
Trend forecast: Bullish
Do you need help in trading decisions? Do you want to learn how to start trading?
Join Economies.com VIP Club and benefit from over 15 years of market analysis expertise and get:
Special Offer: Subscribe to the Economies.com VIP channel and get also a free subscription to a trusted trading signals channel provided by Best Trading Signal.
Silver (XAG/USD) is pulling back from its recent gains seen in the previous session, hovering around $32.50 during Friday’s Asian trading hours. The metal is under pressure, possibly due to a Financial Times report indicating that the Trump administration plans to add several Chinese semiconductor companies to its export blacklist, known as the “entity list.” Silver’s growing connection to the chipmaking industry—owing to its essential role in electronics and semiconductor production—is amplifying the market’s sensitivity to such developments.
Meanwhile, safe-haven demand for precious metals, including Silver, has softened amid signs of easing global trade tensions. The US and China have reportedly reached a preliminary agreement to significantly reduce tariffs. According to the proposed deal, the US would lower tariffs on Chinese imports from 145% to 30%, while China would cut its tariffs on US goods from 125% to 10%. This breakthrough is viewed as a positive move toward de-escalating trade frictions between the two economic powerhouses.
Despite the recent pullback, Silver’s downside may be limited as the US Dollar (USD) weakens following economic data that increased expectations of potential Federal Reserve (Fed) rate cuts in the near term. Lower US interest rates generally support Silver prices, as they reduce the opportunity cost of holding non-yielding assets like precious metals.
However, Fed Chair Jerome Powell warned that inflation may become more unpredictable due to more frequent supply shocks, which could complicate the Fed’s efforts to maintain price stability moving forward.
Silver is a precious metal highly traded among investors. It has been historically used as a store of value and a medium of exchange. Although less popular than Gold, traders may turn to Silver to diversify their investment portfolio, for its intrinsic value or as a potential hedge during high-inflation periods. Investors can buy physical Silver, in coins or in bars, or trade it through vehicles such as Exchange Traded Funds, which track its price on international markets.
Silver prices can move due to a wide range of factors. Geopolitical instability or fears of a deep recession can make Silver price escalate due to its safe-haven status, although to a lesser extent than Gold’s. As a yieldless asset, Silver tends to rise with lower interest rates. Its moves also depend on how the US Dollar (USD) behaves as the asset is priced in dollars (XAG/USD). A strong Dollar tends to keep the price of Silver at bay, whereas a weaker Dollar is likely to propel prices up. Other factors such as investment demand, mining supply – Silver is much more abundant than Gold – and recycling rates can also affect prices.
Silver is widely used in industry, particularly in sectors such as electronics or solar energy, as it has one of the highest electric conductivity of all metals – more than Copper and Gold. A surge in demand can increase prices, while a decline tends to lower them. Dynamics in the US, Chinese and Indian economies can also contribute to price swings: for the US and particularly China, their big industrial sectors use Silver in various processes; in India, consumers’ demand for the precious metal for jewellery also plays a key role in setting prices.
Silver prices tend to follow Gold’s moves. When Gold prices rise, Silver typically follows suit, as their status as safe-haven assets is similar. The Gold/Silver ratio, which shows the number of ounces of Silver needed to equal the value of one ounce of Gold, may help to determine the relative valuation between both metals. Some investors may consider a high ratio as an indicator that Silver is undervalued, or Gold is overvalued. On the contrary, a low ratio might suggest that Gold is undervalued relative to Silver.
Other than a daily close above yesterday’s high, signs of aggressive buying are illustrated in the tail on today’s candle pattern, the rise above the open price following a bearish decline, and sustained buying pressure heading into the close. That shows strength that should be carried into the next two or three sessions.
Once dynamic support for the trend is successfully tested as support and followed by bullish signs, there is the potential for the bull trend to keep going. But today’s decline had additional significance as a standard falling ABCD pattern completed near the lows of the day. Overall, there looks like there is the potential for choppy movement within a two-week range from last week’s high of $3,439 to this week’s low of $3,121.
Dynamic support continues with the 50-Day MA, while the 20-Day MA is now at $3,308 and shows a top dynamic resistance level. It will likely be more useful than the lower swing high, which is a bit higher. So, the 20-Day line provides a top price level where if it is exceeded demand may continue to improve and eventually challenge resistance around the recent lower swing high. In the near-term a rise above Wednesday’s high of $3,257 shows strength and would increase the chance for a rise into the 20-Day line.
For a look at all of today’s economic events, check out our economic calendar.
Gold price struggles to capitalize on the previous day’s solid rebound from over a one-month low and consolidates below the $3,250 level during the Asian session amid the US-China trade deal optimism. Meanwhile, signs of easing inflation in the US and weaker consumer spending data lift Fed rate cut bets. The outlook drags the US bond yields lower and undermines the USD, supporting the non-yielding yellow metal.
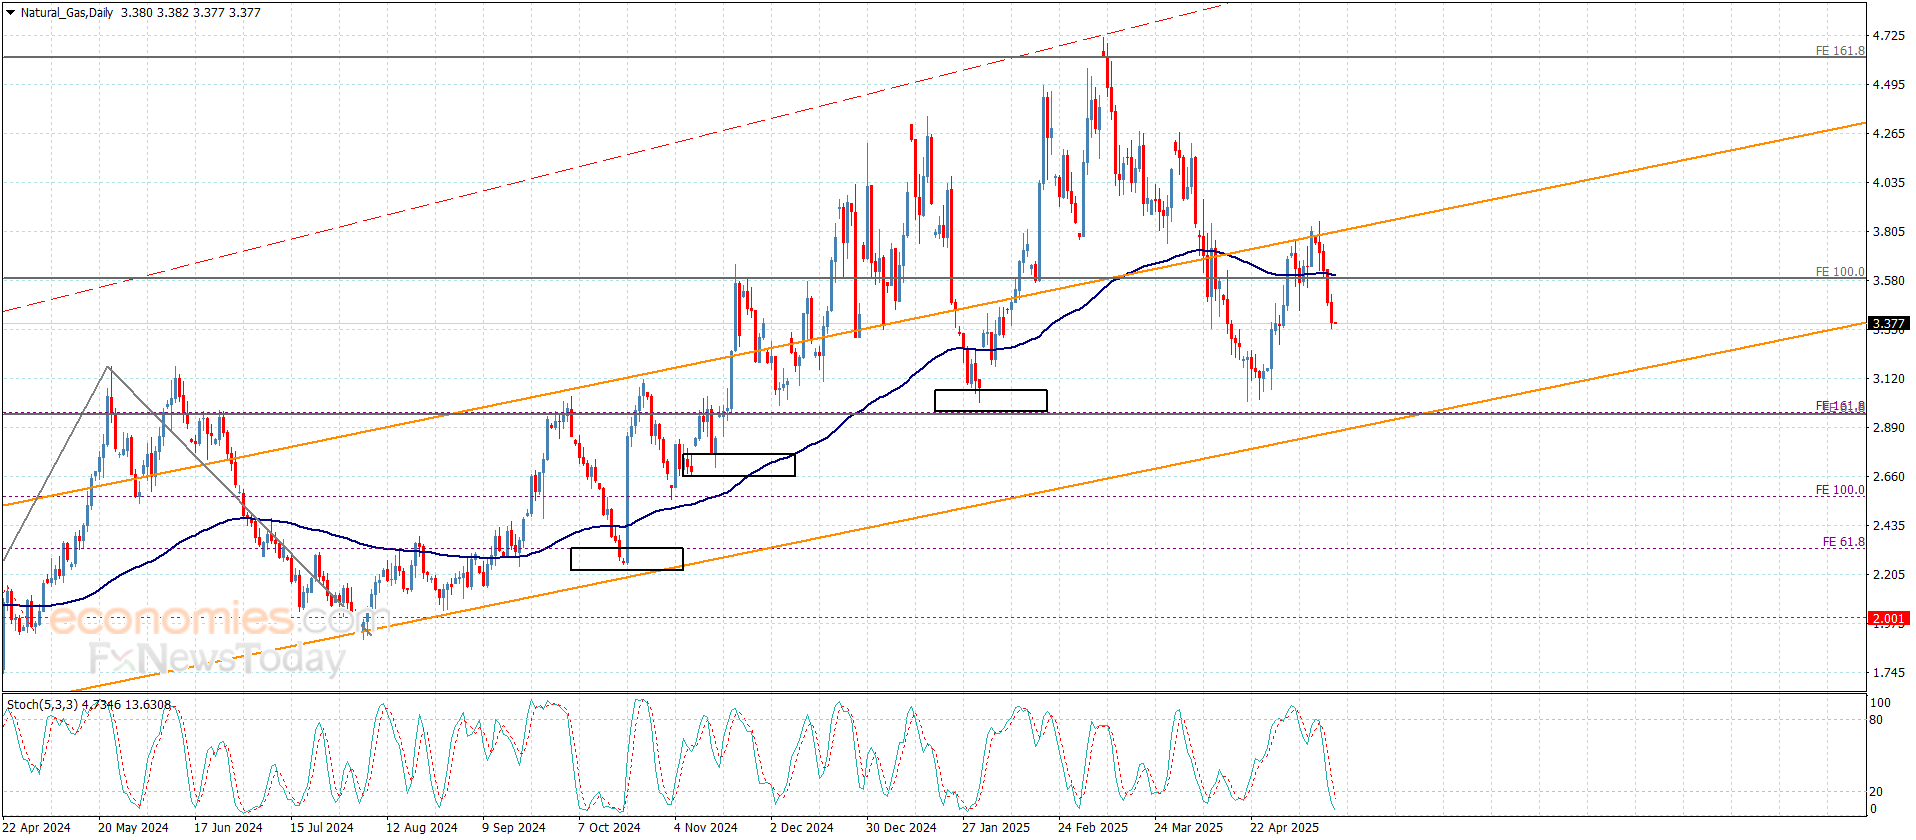
There are several short-term bearish signs in recent price action. The dip below the $3.42 higher swing low earlier today triggered a bearish reversal of the short-term uptrend. Yesterday’s low hit support at the 38.2% Fibonacci retracement and stopped, before closing the session there. That level was busted earlier today. Also, the light blue line on the chart shows price levels from the anchored volume weighted average price line (AVWAP). It had been acting as support since the recent swing low but that changed when Wednesday’s session closed below the line for the first time.
Let’s consider the head and shoulder pattern that formed at the most recent top and the behavior of the price of natural gas since then. Following a drop below support at the neckline of the formation the price of natural gas will establish a counter-trend rally to test prior support levels as resistance. The neckline of the pattern is one significant area to consider.
The recent short-term trend high of $3.73 from Monday completed a successful test of resistance around the neckline. And the price area around the neckline was also marked by several other indicators, including a 61.8% Fibonacci retracement, the 50-Day MA, and an AVWAP line from the peak in March. Other than a quick rebound following the initial breakdown of the topping pattern, the recent advance was really the first bullish counter-trend rally. If that is the case, then the current decline could surprise to the downside.
If the 50% retracement fails to reverse the slide, the 61.8% Fibonacci retracement at $3.23 becomes the next lower target. Notice that the dark blue 200-Day MA is rising and heading towards the 61.8% level. Together, they could create something of a magnet for price. However, a sustained decline below the 50% retracement would happen first, and there is a risk of that now.
For a look at all of today’s economic events, check out our economic calendar.
May 15, 2025 – Written by David Woodsmith
STORY LINK Euro to US Dollar Forecast: EUR Drifts Into “Bearish Territory”
The Euro to Dollar exchange rate (EUR/USD) has fluctuated around 1.1200 on Thursday and settled close to this level after the raft of US data.
Scotiabank notes that overall volatility has eased and added; “Near-term support is expected below 1.1100 and recent resistance has been observed above 1.1250.”
According to ING; “We see EUR/USD trading in a 1.11-1.15 range over the coming weeks and months, although risks are skewed to the upside. 1.1265 is now decent intra-day resistance.”
US retail sales increased 0.1% for April, in line with consensus forecasts and followed an upwardly-revised 1.7% gain the previous month. Underlying sales also increased 0.1% on the month, but the control group recorded a 0.2% monthly decline compared with expectations of a 0.3% gain.
Producer prices declined 0.5% for the month compared with expectations of a 0.2% gain while core prices declined 0.4%.
There was no significant shift in interest rate expectations following the data.
As far as business confidence is concerned, the New York manufacturing index edged lower to -9.2 for May from -8.1 previously.

Companies were marginally more positive on the outlook with mixed inflation pressures.
The Philadelphia Fed index improved to -4 for May from -26.4 in April while there was stronger upward pressure on prices. Companies were notably more optimistic over the outlook with on-going inflation pressures.
The dollar’s fundamental outlook remained a key market focus. US bond yields edged lower as markets considered the longer-term fiscal outlook.
According to ING; “The topic involves a lot of speculation about what might happen, but the evidence is also starting to support the diversification thesis.”
There was evidence of strong buying of Japanese bonds and equities for the month.
ING added; “instead of April being a month of deleveraging and global asset managers merely downscaling and repatriating, April proved a month of diversification into Japanese assets by foreign accounts. That looks like a big tick in the box of the diversification element of de-dollarisation.”
The US Treasury has denied that it is looking to weaken the dollar, but Commerzbank is not convinced and considers that there are slightly more subtle ways of achieving the objective.

It noted; “it can also be achieved with a sufficient number of bilateral agreements. One with South Korea, one with Japan, and so on. Now, it is by no means plausible that these countries want to revalue their own currencies against the dollar. But it is easier – at least from the perspective of the US president and his ‘neorealist’ advisors – to force them to do so one by one.”
Danske Bank added; “a negative risk premium remains embedded in the USD, which continues to trade meaningfully away from fundamentals and pre-Liberation Day levels, reflecting eroding confidence in the greenback.”
It added; “Longer term, structural challenges like US and euro area political shifts, trade uncertainty, and capital rotation out of US assets suggest considerable USD downside.”
International Money Transfer? Ask our resident FX expert a money transfer question or try John’s new, free, no-obligation personal service! ,where he helps every step of the way,
ensuring you get the best exchange rates on your currency requirements.