The main category of Forex News.
You can use the search box below to find what you need.
[wd_asp id=1]
The main category of Forex News.
You can use the search box below to find what you need.
[wd_asp id=1]
May 15, 2025 – Written by David Woodsmith
STORY LINK Euro to US Dollar Forecast: EUR Drifts Into “Bearish Territory”
The Euro to Dollar exchange rate (EUR/USD) has fluctuated around 1.1200 on Thursday and settled close to this level after the raft of US data.
Scotiabank notes that overall volatility has eased and added; “Near-term support is expected below 1.1100 and recent resistance has been observed above 1.1250.”
According to ING; “We see EUR/USD trading in a 1.11-1.15 range over the coming weeks and months, although risks are skewed to the upside. 1.1265 is now decent intra-day resistance.”
US retail sales increased 0.1% for April, in line with consensus forecasts and followed an upwardly-revised 1.7% gain the previous month. Underlying sales also increased 0.1% on the month, but the control group recorded a 0.2% monthly decline compared with expectations of a 0.3% gain.
Producer prices declined 0.5% for the month compared with expectations of a 0.2% gain while core prices declined 0.4%.
There was no significant shift in interest rate expectations following the data.
As far as business confidence is concerned, the New York manufacturing index edged lower to -9.2 for May from -8.1 previously.

Companies were marginally more positive on the outlook with mixed inflation pressures.
The Philadelphia Fed index improved to -4 for May from -26.4 in April while there was stronger upward pressure on prices. Companies were notably more optimistic over the outlook with on-going inflation pressures.
The dollar’s fundamental outlook remained a key market focus. US bond yields edged lower as markets considered the longer-term fiscal outlook.
According to ING; “The topic involves a lot of speculation about what might happen, but the evidence is also starting to support the diversification thesis.”
There was evidence of strong buying of Japanese bonds and equities for the month.
ING added; “instead of April being a month of deleveraging and global asset managers merely downscaling and repatriating, April proved a month of diversification into Japanese assets by foreign accounts. That looks like a big tick in the box of the diversification element of de-dollarisation.”
The US Treasury has denied that it is looking to weaken the dollar, but Commerzbank is not convinced and considers that there are slightly more subtle ways of achieving the objective.

It noted; “it can also be achieved with a sufficient number of bilateral agreements. One with South Korea, one with Japan, and so on. Now, it is by no means plausible that these countries want to revalue their own currencies against the dollar. But it is easier – at least from the perspective of the US president and his ‘neorealist’ advisors – to force them to do so one by one.”
Danske Bank added; “a negative risk premium remains embedded in the USD, which continues to trade meaningfully away from fundamentals and pre-Liberation Day levels, reflecting eroding confidence in the greenback.”
It added; “Longer term, structural challenges like US and euro area political shifts, trade uncertainty, and capital rotation out of US assets suggest considerable USD downside.”
International Money Transfer? Ask our resident FX expert a money transfer question or try John’s new, free, no-obligation personal service! ,where he helps every step of the way,
ensuring you get the best exchange rates on your currency requirements.
Spot Gold is in a better shape in the American session on Thursday, rising beyond the $3,200 mark after falling to a five-week low of $3,120.83 during London trading hours. Fading optimism about a potential United States (US)- China trade deal brought demand for safety back to the table.
Concerns arose on news coming from Japan early in Asia, indicating the US is considering revising its trade agreement with Japan. Market talks suggest the US is asking for additional concessions on agriculture and livestock products, something Japan is unwilling to grant, risking a deadlock in negotiations.
On a positive note, encouraging US data limited the US Dollar (USD) decline. The country unveiled the April Producer Price Index (PPI), which fell by 0.5% in the month, while the annual figure came in at 2.4%, both below expectations and March levels. Also, Initial Jobless Claims for the week ended May 10 matched expectations, up by 229K. Retail Sales were up 0.1% in April, slightly better than the 0% anticipated by market participants.
On a negative note, Capacity Utilisation stood at 77.7% in April, slightly below the expected and previous 77.8%, while Industrial Production in the same month stayed pat vs a 0.2% advance anticipated by market players.
Meanwhile, US indexes trade mixed, with the Nasdaq Composite struggling to overcome its daily opening, the Dow Jones Industrial Average trimming part of its recent losses and the S&P 500 extending its recent advance.
Friday will bring little of relevance, with the focus on the preliminary estimate of the US Michigan Consumer Sentiment Index for May.
Technically, the daily chart shows that XAU/USD trades in the green, yet also that it posted a lower low and a lower high. At the same time, the 20 Simple Moving Average (SMA) turns modestly lower around the $3,305 level, while the 100 and 200 SMAs maintain their upward slopes far below the current level. Finally, technical indicators aim higher, but remain below their previous intraday highs and within negative levels, suggesting buying is still tepid.
The near-term picture shows buyers are piling up, but still lack full conviction. The pair is currently pressuring from below a flat 20 SMA, while the longer moving averages are pretty much flat above the shorter one. Technical indicators, in the meantime, head firmly north, yet remain within negative levels.
Support levels: 3,198.30 3,173.80 3,158.40
Resistance levels: 3,215.80 3,232.10 3,245.70
May 15, 2025 – Written by Frank Davies
STORY LINK Pound-to-Dollar Forecast: GBP Advances vs USD on Slowing US Retail Sales
The Pound US Dollar exchange rate gained ground on Thursday as the US released its latest retail sales index and the UK released its latest GDP reading.
At the time of writing, GBP/USD was trading at approximately $1.3300, up roughly 0.3% from the start of Thursday’s session.
The US Dollar (USD) weakened across the board on Thursday as markets reacted to discouraging retail sales figures from April.
Consumer spending growth nearly came to a halt last month, with the retail sales index slipping sharply from March’s 1.5% reading to just 0.1%, coming in only slightly above forecasts for flat growth.
This underwhelming performance added to growing concerns about the US’s economic outlook, especially on the back of Tuesday’s subdued inflation reading.
The US Dollar came under additional strain after data showed a surprise dip in producer prices for April, marking the first time producer inflation had fallen since 2023, and deepened worries about weakening inflationary momentum in the US economy.
As investor confidence waned, the Dollar faced renewed pressure and retreated against most major currencies.
The Pound (GBP) strengthened on Thursday following the release of upbeat UK growth figures for Q1 2025.
Official data from the Office for National Statistics (ONS) showed the economy expanded by 0.7% over the first three months of the year, exceeding forecasts and registering the strongest performance among the G7 nations.
The unexpected acceleration in growth helped bolster confidence in the UK’s economic outlook, lending support to Sterling during the day’s European trading session.
As the week draws to a close, attention for the GBP/USD exchange rate is expected to shift towards upcoming US economic data.
The University of Michigan’s preliminary consumer sentiment reading for May is due for release, with projections suggesting sentiment will remain subdued, hovering near the lowest levels since July 2022, as noted in last months report.
If the index holds at these levels, it could weigh on the US Dollar (USD) by further fuelling concerns over the resilience of the American economy.
Meanwhile, with no notable UK data scheduled for Friday, Sterling may struggle to find a clear trajectory, potentially leading to more subdued or directionless movement in the GBP/USD pairing.
International Money Transfer? Ask our resident FX expert a money transfer question or try John’s new, free, no-obligation personal service! ,where he helps every step of the way,
ensuring you get the best exchange rates on your currency requirements.
TAGS: Pound Dollar Forecasts
Silver prices are recovering from earlier lows, supported by renewed demand at technical support levels.
At the time of writing, XAG/USD is up 0.90% on the day, trading near $32.53, after briefly dipping below the 100-day Simple Moving Average (SMA) at $31.90.
The advance reflects increased buying interest, although the broader market remains consolidative. Investors continue to weigh mixed United States (US) economic data and evolving expectations around Federal Reserve (Fed) policy, leaving Silver confined within a well-defined trading range.
On the daily chart, the current candlestick features a small real body near the top of a long lower wick — a classic sign of intraday bearish pressure that was ultimately rejected.
Buyers stepped in at the 100-day SMA, pushing prices back toward the session’s opening level. While this does not confirm a bullish reversal, it highlights strong demand at lower levels. The candle represents a defensive stance by buyers rather than a clear trend change. However, with the trading day still in progress, a confirmed close is needed to validate the move.
Silver remains constrained between the 100-day SMA at $31.90 and the 50-day SMA at $32.76, with additional resistance at the psychological $33.00 level. Immediate support aligns with the 61.8% Fibonacci retracement of the March–April rally, near the $32.00 mark. The Relative Strength Index (RSI) on the daily chart stands at 47.68, indicating a neutral momentum profile.
Silver (XAG/USD) daily chart
On the weekly timeframe, Silver appears to be forming a bullish harami pattern — a smaller bullish candle developing within the body of last week’s larger bearish candle. This configuration often signals a potential loss of bearish momentum, particularly when it occurs near established support levels. In this case, Silver is holding above the 23.6% Fibonacci retracement of the 2024 advance, located at $31.81.
Silver (XAG/USD) weekly chart

The 10-week and 50-week SMAs, positioned at $32.57 and $30.95, respectively, are gradually converging, indicating a tightening technical structure. The Relative Strength Index (RSI) on the weekly chart is at 52.75, reflecting a mildly bullish bias but no strong momentum either way. A sustained breakout above $33.69 or a confirmed close below $31.80 would likely determine the next directional move for Silver.
Silver is a precious metal highly traded among investors. It has been historically used as a store of value and a medium of exchange. Although less popular than Gold, traders may turn to Silver to diversify their investment portfolio, for its intrinsic value or as a potential hedge during high-inflation periods. Investors can buy physical Silver, in coins or in bars, or trade it through vehicles such as Exchange Traded Funds, which track its price on international markets.
Silver prices can move due to a wide range of factors. Geopolitical instability or fears of a deep recession can make Silver price escalate due to its safe-haven status, although to a lesser extent than Gold’s. As a yieldless asset, Silver tends to rise with lower interest rates. Its moves also depend on how the US Dollar (USD) behaves as the asset is priced in dollars (XAG/USD). A strong Dollar tends to keep the price of Silver at bay, whereas a weaker Dollar is likely to propel prices up. Other factors such as investment demand, mining supply – Silver is much more abundant than Gold – and recycling rates can also affect prices.
Silver is widely used in industry, particularly in sectors such as electronics or solar energy, as it has one of the highest electric conductivity of all metals – more than Copper and Gold. A surge in demand can increase prices, while a decline tends to lower them. Dynamics in the US, Chinese and Indian economies can also contribute to price swings: for the US and particularly China, their big industrial sectors use Silver in various processes; in India, consumers’ demand for the precious metal for jewellery also plays a key role in setting prices.
Silver prices tend to follow Gold’s moves. When Gold prices rise, Silver typically follows suit, as their status as safe-haven assets is similar. The Gold/Silver ratio, which shows the number of ounces of Silver needed to equal the value of one ounce of Gold, may help to determine the relative valuation between both metals. Some investors may consider a high ratio as an indicator that Silver is undervalued, or Gold is overvalued. On the contrary, a low ratio might suggest that Gold is undervalued relative to Silver.
Major Currency Pairs Forecasts: this analysis focuses on four major currency pairs: EUR/USD, USD/JPY, GBP/USD, and USD/CHF. Understanding the factors influencing these pairs can provide insights into potential future movements.
The EUR/USD pair is the most traded currency pair globally, representing the economic relationship between the Eurozone and the United States. Several factors influence its movement:
Economic Indicators
The economic health of both the Eurozone and the U.S. plays a crucial role in determining the direction of this pair. Key indicators include GDP growth, employment figures, and inflation rates. Recent trends suggest that while the U.S. economy has shown resilience, the Eurozone faces challenges such as slower growth and inflationary pressures.
Central Bank Policies
The European Central Bank (ECB) and the Federal Reserve (Fed) have differing monetary policies that significantly impact the EUR/USD exchange rate. If the Fed continues to adopt a hawkish stance while the ECB remains dovish, the U.S. dollar may strengthen against the euro. Conversely, any shift towards tighter monetary policy by the ECB could bolster the euro.
Market Sentiment
Market sentiment, influenced by geopolitical events and economic forecasts, can lead to volatility in the EUR/USD pair. Traders often react to news regarding trade relations, political stability, and economic forecasts, which can create short-term fluctuations.
The USD/JPY pair is heavily influenced by interest rate differentials between the U.S. and Japan, as well as broader market sentiment.
Interest Rate Differentials
The Bank of Japan (BoJ) has maintained a low-interest-rate environment for an extended period, while the Fed has been more aggressive in adjusting rates. This divergence can lead to a stronger U.S. dollar against the Japanese yen, particularly if the Fed signals further rate hikes.
Safe-Haven Demand
The Japanese yen is often viewed as a safe-haven currency. During times of global uncertainty or market volatility, demand for the yen may increase, leading to appreciation against the U.S. dollar. Conversely, if market sentiment improves, the yen may weaken as investors seek higher returns elsewhere.
Economic Data Releases
Key economic data from both the U.S. and Japan, such as employment reports and inflation data, can significantly impact the USD/JPY pair. Positive data from the U.S. may strengthen the dollar, while disappointing figures from Japan could lead to yen depreciation.
The GBP/USD pair, often referred to as “Cable,” is influenced by various factors, including economic performance, political developments, and market sentiment.
Economic Performance
The economic outlook for the United Kingdom is critical for the GBP/USD pair. Factors such as GDP growth, inflation, and employment rates can influence the strength of the British pound. Recent economic challenges, including those related to Brexit, have created uncertainty, which can lead to volatility in this pair.
Political Developments
Political events, particularly those related to Brexit negotiations and domestic policies, can have a profound impact on the GBP/USD exchange rate. Any signs of progress or setbacks in negotiations can lead to significant fluctuations in the pound’s value.
Market Sentiment
Market sentiment plays a crucial role in the GBP/USD pair’s movements. Traders often react to news regarding economic forecasts, political stability, and global market trends. A shift in sentiment can lead to rapid changes in the exchange rate.
The USD/CHF pair represents the relationship between the U.S. dollar and the Swiss franc, another currency often viewed as a safe haven.
Economic Stability
Switzerland’s economic stability and strong financial system contribute to the Swiss franc’s appeal. In times of global uncertainty, the franc may appreciate against the U.S. dollar as traders seek refuge in stable currencies.
Central Bank Policies
The Swiss National Bank (SNB) maintains a cautious approach to monetary policy, often keeping interest rates low. If the Fed continues to raise rates, the U.S. dollar may strengthen against the franc. However, any unexpected moves by the SNB could lead to volatility in the USD/CHF pair.
Geopolitical Factors
Geopolitical events can significantly impact the USD/CHF exchange rate. Tensions in global markets or economic crises can lead to increased demand for the Swiss franc, resulting in appreciation against the dollar.
The major currency pairs—EUR/USD, USD/JPY, GBP/USD, and USD/CHF—are influenced by a complex interplay of economic indicators, central bank policies, and market sentiment. As traders navigate this dynamic landscape, staying informed about economic developments and geopolitical events will be crucial for making informed decisions. Understanding these factors can provide valuable insights into potential future movements in these key currency pairs.
When considering shares, indices, forex (foreign exchange) and commodities for trading and price predictions, remember that trading CFDs involves a significant degree of risk and could result in capital loss.
Past performance is not indicative of any future results. This information is provided for informative purposes only and should not be construed to be investment advice.
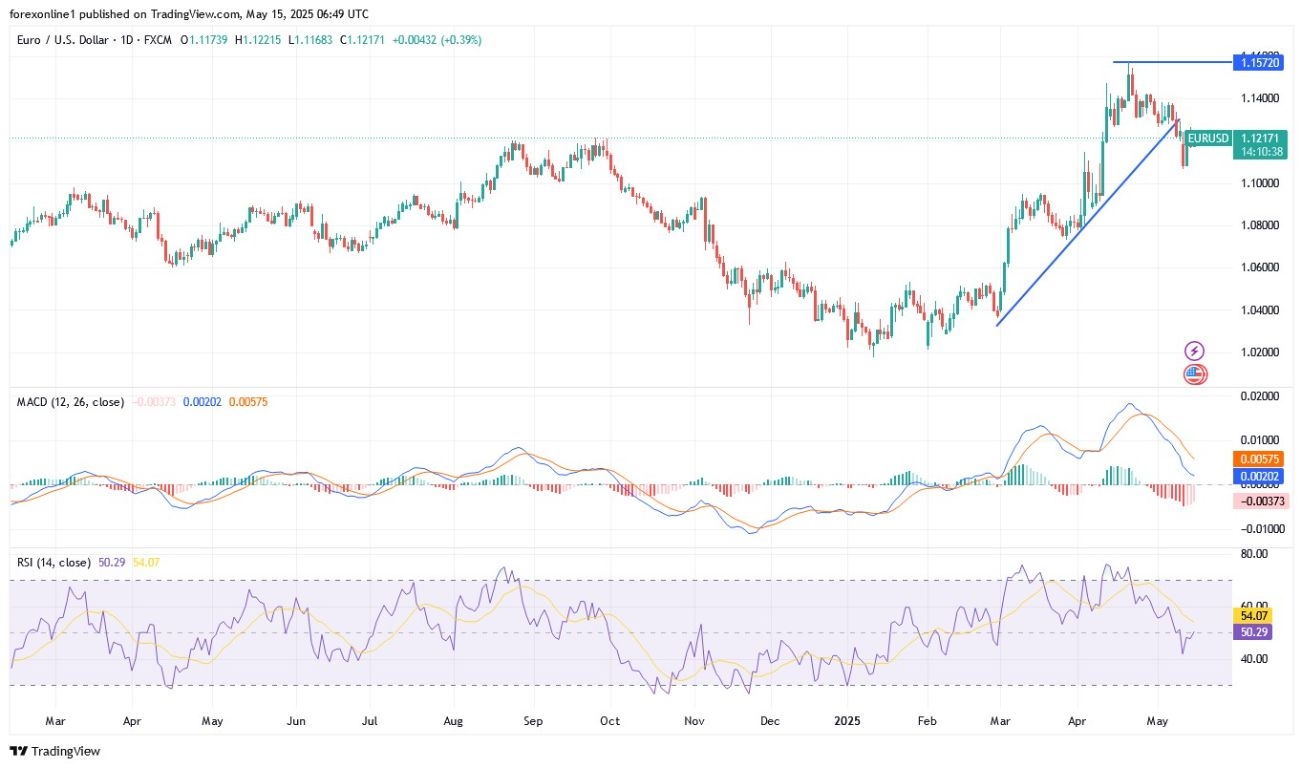
During yesterday’s trading session, bulls attempted a rebound in the EUR/USD currency pair, reaching the 1.1265 resistance level before quickly returning to stabilize around the 1.1170 level at the start of today’s Thursday session. The US dollar remains stronger against other major currencies amidst a recent easing of US-China and European trade tensions. The recent gains of the US dollar pushed the EUR/USD pair towards the 1.1065 support level. Amid the performance of the most traded currency pair in the Forex market, trading experts believe that the Euro/Dollar will face difficulty in making further progress; they anticipate some stability around the 1.120 level in EUR/USD in the coming days. During the current quarter, they expect a range for EUR/USD between the 1.10 support level and the 1.15 resistance level.

Be cautious. The direction of the EUR/USD will remain subject to some volatility if US policies continue to threaten the future of global economic recovery.
According to trading across licensed currency trading company platforms and based on the daily timeframe chart performance, the EUR/USD pair is in a phase of breaking the overall upward trend, and breaking the 1.10 support will remain important for the strength of bear control over the direction. After the recent losses, the 14-day Relative Strength Index (RSI) stabilized below the midline, preparing for a bearish shift. At the same time, the MACD indicator confirms the start of a downward move but has not yet reached the oversold stage.
Current EUR/USD trading will be on an important date with a package of European economic releases, led by the announcement of the Eurozone GDP growth reading, along with the industrial production rate and the change in employment for the bloc’s countries, all at 12:00 PM Egypt time. Then, during the more important US session, the US Producer Price Index (PPI) reading, US retail sales figures, and the number of weekly jobless claims will be announced, all at 3:30 PM Egypt time, followed minutes later by new statements from US Federal Reserve Governor Jerome Powell.
Be careful; the reaction to these data results will affect the performance of the EUR/USD price and may shape the future weekly close of the currency pair. Technically, a bullish EUR/USD scenario requires stability above the 1.1370 resistance level once again. Overall, while declining trade tensions provide support for the US dollar in the near term, the risk of a rapid deterioration in incoming data remains. We emphasize that concerns about the outlook for stable US data are valid, and that asset allocation shifts away from US assets remain a headwind for the US dollar in the medium and long term. Commenting on currency exchange rates, German Bundesbank President Nagel noted: “The dollar is very important for the global financial system, and we still need a strong dollar
Ready to trade our daily Forex analysis? We’ve made a list of the best forex demo accounts worth trading with.
Spot gold steadied after hitting its lowest level since April 10, supported by technical buying and a weaker U.S. dollar. The metal bounced near long-standing trendline support around $3,130, in place since the start of 2025. The dollar index (.DXY) slipped 0.3% to 100.81, making gold more attractive for holders of other currencies. However, despite Thursday’s dip, the index is on track for a modest weekly gain, though it remains down nearly 7% in 2025.
Markets are awaiting several key U.S. economic reports, including the producer price index, retail sales, and weekly jobless claims. These could influence rate expectations heading into the second half of 2025. Tuesday’s CPI data came in softer than expected, with core inflation rising only 0.2% in April. Fed Chair Jerome Powell is also scheduled to speak later Thursday, and traders will be parsing his comments for any hints on the Fed’s policy stance. Markets are still pricing in 50 basis points of cuts by year-end, likely starting in October.
Gold’s appeal as a safe haven has eased somewhat after the U.S. and China agreed to pause most tariffs for 90 days. While this de-escalated trade tensions, it also reduced immediate hedging demand for bullion. The drop in safe-haven flows, combined with higher Treasury yields earlier in the week, pressured gold lower before Thursday’s stabilization.
May 15, 2025 – Written by Tim Boyer
STORY LINK GBP/USD Forecast: Pound GDP Boost Fades, Dollar Eyes Bonds
The Pound Sterling initially gained against the Euro and U.S. Dollar following the latest GDP data, but GBP was unable to make further headway with concerns that the data overstated the underlying performance.
Equity markets were also weaker which limited potential support, but the US Dollar remained fragile.
The Pound to Dollar exchange rate (GBP/USD) failed to hold 1.3300 and retreated to 1.3285 with evidence of buying on dips.
The dollar overall has struggled to hold gains amid fresh concerns that the combination of huge supply of US bonds and the risk of fading global demand for Treasuries will trigger higher yields and a weaker dollar.
ING is positive on the short-term GBP/USD outlook; “With the dollar looking a bit vulnerable, GBP/USD looks biased to the 1.3360/3400 area short term.”
UK GDP grew 0.7% for the first quarter of the year after a 0.1% gain for the final three months of 2024 and compared with expectations of 0.6% growth.
According to the provisional data, the UK first-quarter performance was the strongest within the G7 area.
Budget concerns will ease slightly, although there are still important underlying stresses in meeting the government’s fiscal rules.
ING noted potential seasonal distortions in the data, but considers the outlook is broadly encouraging.
The bank added; “the UK outlook does look ‘ok’, even if first-quarter GDP probably heavily overstates the underlying pace of growth. Uncertainty surrounding global trade is a headwind, though the direct impact of tariffs on the UK looks negligible. Remember too that government spending is rising significantly this year and that will be a firm tailwind.”
Exports were also boosted by shipments ahead of US tariffs.
According to Paul Dales, chief UK economist at Capital Economics; “Overall, the main reason why GDP was stronger than everyone expected appears to be because US and UK tax changes meant that more activity was pulled forward into Q1 from Q2 than everyone expected, rather than because the UK economy is fundamentally stronger.”
US developments are likely to be crucial later in the session.
Retail sales data will be released and there are also two important regional surveys with the New York and Philadelphia Fed data. There were sharp declines for April and the May data will be important for wider confidence in the US outlook.
US bond yields have also moved higher with markets fretting over the implications of huge budget deficits and the Republican tax bill.
The 10-year yield is above 4.50% with the 30-year yield near 5.00% and close to levels which triggered a U-turn on reciprocal tariffs in April.
Significantly, higher US yields have not supported the dollar.
Rabobank commented, “Perhaps we are about to find out whether it really was rising bond yields that forced the about-face on those reciprocal tariffs, or if Scott Bessent has some other rabbit to pull out of his hat to force long yields lower.”
MUFG noted the risk that bond-market fears would lead to Truss-style difficulties for the dollar.
Looking at the proposed legislation it added; “Much of the cost of this bill is merely to extend the status quo and other aspects could easily be crowded out by yields being higher than otherwise would be. That in our view means this development will not prove positive for the dollar.”
SocGen commented; “I’m sure that President Trump, with his desire to rebuild the global trade framework, is in favour of a less expensive dollar.
International Money Transfer? Ask our resident FX expert a money transfer question or try John’s new, free, no-obligation personal service! ,where he helps every step of the way,
ensuring you get the best exchange rates on your currency requirements.
TAGS: Pound Dollar Forecasts
Silver price (XAG/USD) bounces back to near $32.00 during European trading hours on Thursday after sliding to near the monthly low around $31.65 earlier in the day. The outlook of the Silver price remains bearish as trade relations between the United States (US) and China have improved further.
During European trading hours, US Treasury Secretary Scott Bessent signaled more talks with China to avoid trade tensions. “We are going into a series of negotiations with China to prevent escalation again,” Bessent said.
Meanwhile, Beijing also appears to be making efforts to improve relations with the US. On Wednesday, the Chinese Commerce Ministry suspended non-tariff measures taken against 45 US entities in the wake of an agreement between Washington and Beijing for a 90-day pause in the trade war in which they lowered tariffs by 115%.
Waning US-China trade tensions have forced investors to reassess the global economic outlook. Theoretically, an improvement in the global economy reduces demand for safe-haven assets, such as Silver.
Meanwhile, investors await Federal Reserve (Fed) Chair Jerome Powell’s speech, which is scheduled in the North American session. Investors would look cues for any change in the Fed’s stance towards the monetary policy outlook after the temporary US-China trade truce and soft US Consumer Price Index (CPI) data for April.
The Silver price could face more pressure if Fed Powell guides that interest rates should remain where they are in the face of economic uncertainty due to new economic policies by US President Donald Trump. Fed’s higher for longer interest rates bode poorly for non-yielding assets, such as Silver.
Silver price trades in a Descending Triangle formation on a four-hour timeframe. The chart pattern reflects indecisiveness among market participants. The near-term trend of the white metal is bearish as it trades below the 20-period Exponential Moving Average (EMA), which is around $32.70.
The 14-period Relative Strength Index (RSI) wobbles around 40.00. A fresh bearish momentum would trigger if the RSI falls below the 40.00 level.
Looking up, the March 28 high of $34.60 will act as key resistance for the metal. On the downside, the April 11 low of $30.90 will be the key support zone.
Silver is a precious metal highly traded among investors. It has been historically used as a store of value and a medium of exchange. Although less popular than Gold, traders may turn to Silver to diversify their investment portfolio, for its intrinsic value or as a potential hedge during high-inflation periods. Investors can buy physical Silver, in coins or in bars, or trade it through vehicles such as Exchange Traded Funds, which track its price on international markets.
Silver prices can move due to a wide range of factors. Geopolitical instability or fears of a deep recession can make Silver price escalate due to its safe-haven status, although to a lesser extent than Gold’s. As a yieldless asset, Silver tends to rise with lower interest rates. Its moves also depend on how the US Dollar (USD) behaves as the asset is priced in dollars (XAG/USD). A strong Dollar tends to keep the price of Silver at bay, whereas a weaker Dollar is likely to propel prices up. Other factors such as investment demand, mining supply – Silver is much more abundant than Gold – and recycling rates can also affect prices.
Silver is widely used in industry, particularly in sectors such as electronics or solar energy, as it has one of the highest electric conductivity of all metals – more than Copper and Gold. A surge in demand can increase prices, while a decline tends to lower them. Dynamics in the US, Chinese and Indian economies can also contribute to price swings: for the US and particularly China, their big industrial sectors use Silver in various processes; in India, consumers’ demand for the precious metal for jewellery also plays a key role in setting prices.
Silver prices tend to follow Gold’s moves. When Gold prices rise, Silver typically follows suit, as their status as safe-haven assets is similar. The Gold/Silver ratio, which shows the number of ounces of Silver needed to equal the value of one ounce of Gold, may help to determine the relative valuation between both metals. Some investors may consider a high ratio as an indicator that Silver is undervalued, or Gold is overvalued. On the contrary, a low ratio might suggest that Gold is undervalued relative to Silver.
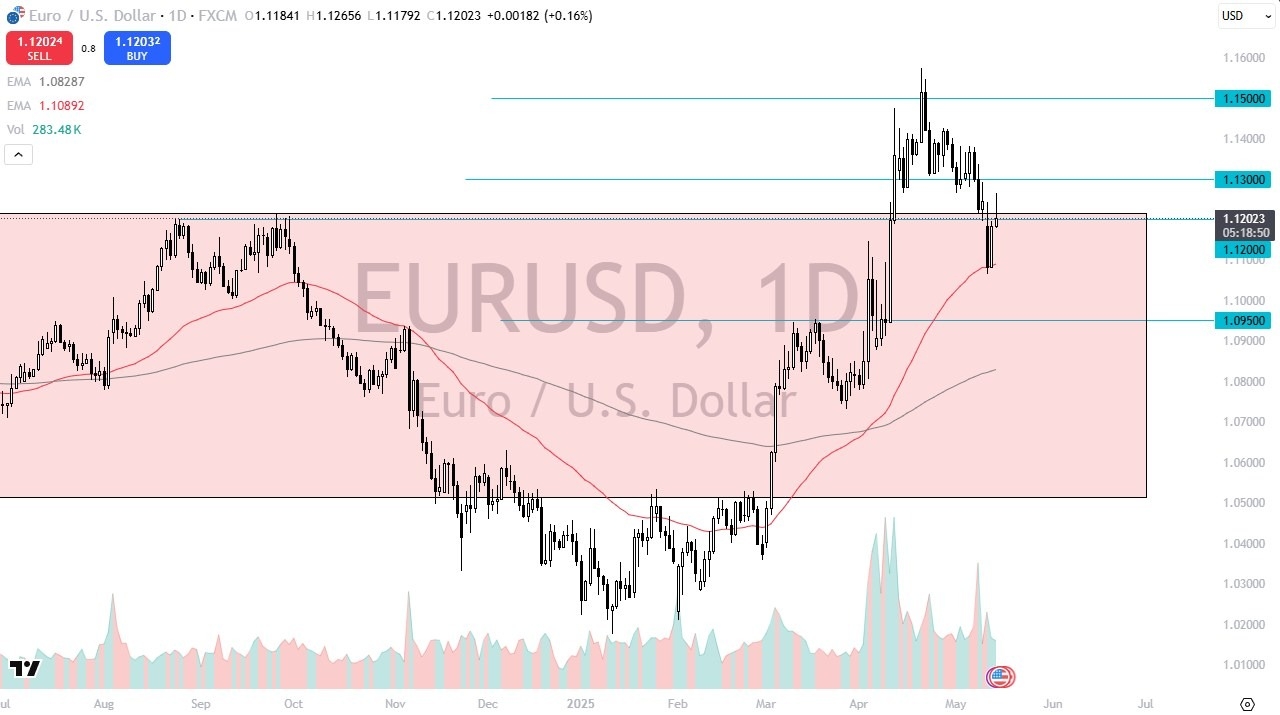
We had a little bit of a throw over here in the last couple of weeks, but we also had one at the end of last year to the downside. So, the question is, are we re-entering this area yet again? It’s very possible. That’s exactly what happens. We’ll just have to wait and see. But I do think that you have to basically take this market as one that I think got a little overdone and therefore it does make a certain amount of sense that we pull back at the very least. That doesn’t necessarily mean that I am looking for a major meltdown, but I do think that a return to the 50-day EMA near the lows of the past couple of trading sessions is very viable.
And then if we break down below there, we could be looking at the 1.0950 level, an obvious area of both support and resistance over the longer term. To the upside, if we do take out the 1.13 level, then we could start looking at the 1.15 level again, an area that has a certain amount of importance from both psychology and the longer term charge.
All things being equal with the interest rates in America climbing the way they did, it makes perfect sense that the US dollar continues to attract inflows.
Ready to trade our daily Forex analysis? We’ve made a list of the best forex trading platforms for beginners worth trading with.
Christopher Lewis has been trading Forex and has over 20 years experience in financial markets. Chris has been a regular contributor to Daily Forex since the early days of the site. He writes about Forex for several online publications, including FX Empire, Investing.com, and his own site, aptly named The Trader Guy. Chris favours technical analysis methods to identify his trades and likes to trade equity indices and commodities as well as Forex. He favours a longer-term trading style, and his trades often last for days or weeks.