The main category of Forex News.
You can use the search box below to find what you need.
[wd_asp id=1]
The main category of Forex News.
You can use the search box below to find what you need.
[wd_asp id=1]
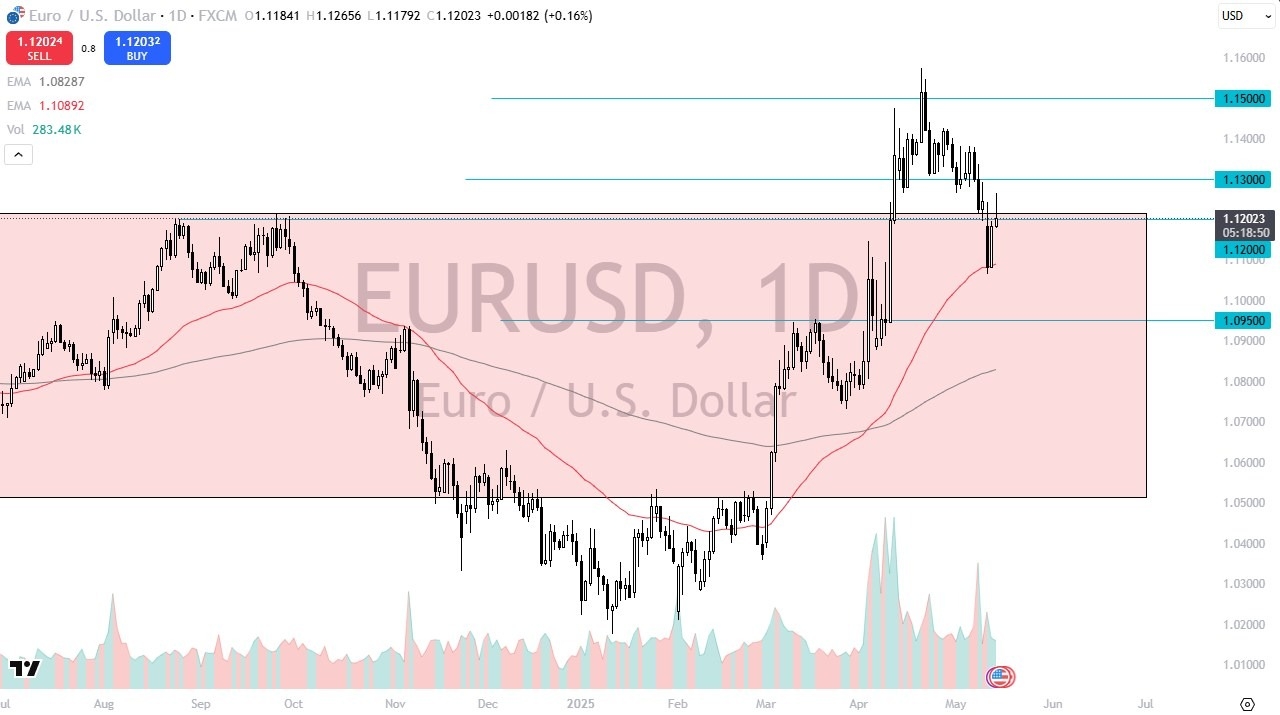
We had a little bit of a throw over here in the last couple of weeks, but we also had one at the end of last year to the downside. So, the question is, are we re-entering this area yet again? It’s very possible. That’s exactly what happens. We’ll just have to wait and see. But I do think that you have to basically take this market as one that I think got a little overdone and therefore it does make a certain amount of sense that we pull back at the very least. That doesn’t necessarily mean that I am looking for a major meltdown, but I do think that a return to the 50-day EMA near the lows of the past couple of trading sessions is very viable.

And then if we break down below there, we could be looking at the 1.0950 level, an obvious area of both support and resistance over the longer term. To the upside, if we do take out the 1.13 level, then we could start looking at the 1.15 level again, an area that has a certain amount of importance from both psychology and the longer term charge.
All things being equal with the interest rates in America climbing the way they did, it makes perfect sense that the US dollar continues to attract inflows.
Ready to trade our daily Forex analysis? We’ve made a list of the best forex trading platforms for beginners worth trading with.
Christopher Lewis has been trading Forex and has over 20 years experience in financial markets. Chris has been a regular contributor to Daily Forex since the early days of the site. He writes about Forex for several online publications, including FX Empire, Investing.com, and his own site, aptly named The Trader Guy. Chris favours technical analysis methods to identify his trades and likes to trade equity indices and commodities as well as Forex. He favours a longer-term trading style, and his trades often last for days or weeks.
The EURJPY pair is affected by the negative pressures, due to its repeated stability below the resistance at 164.90, forming several bearish waves, approaching from the initial support at 163.35 level.
The suggested scenario depends on the stability of the current support, to expect activating the bullish track, which might target 164.20 and 164.90 level gradually, while breaking the support and holding below it will increase the chances for resuming the decline, and 162.40 level represents the next target of the bearish track.
The expected trading range for today is between 163.30 and 164.90
Trend forecast: Bullish
Do you need help in trading decisions? Do you want to learn how to start trading?
Join Economies.com VIP Club and benefit from over 15 years of market analysis expertise and get:
Special Offer: Subscribe to the Economies.com VIP channel and get also a free subscription to a trusted trading signals channel provided by Best Trading Signal.
The GBPJPY pair activated the bearish correctional track, due to its reach below 194.60 level, affected by stochastic exit from the overbought level, which forces it to suffer some losses by reaching 193.90.
Depending on the key support extension on 193.35 level, to increase the chances for activating the bullish track, to step above 194.60 then targeting 195.70 level, while breaking the support will force it suffer extra losses that might extend to 192.65 reaching to the moving average 55.
The expected trading range for today is between 193.35 and 195.00
Trend forecast: Bullish
Do you need help in trading decisions? Do you want to learn how to start trading?
Join Economies.com VIP Club and benefit from over 15 years of market analysis expertise and get:
Special Offer: Subscribe to the Economies.com VIP channel and get also a free subscription to a trusted trading signals channel provided by Best Trading Signal.
Copper price confirmed the continuation of the bearish scenario by providing a new negative close yesterday below $4.6600, which represents an extra barrier to its stability near 50% Fibonacci correction level.
Note that gathering the negative momentum in the current period is important to ease the mission of pressing on the barrier at $4.5000 level, and breaking it will open the way towards targeting negative stations, which might extend to $4.4500 and $4.3100.
The expected trading range for today is between $4.4500 and $4.6600
Trend forecast: Bearish
Do you need help in trading decisions? Do you want to learn how to start trading?
Join Economies.com VIP Club and benefit from over 15 years of market analysis expertise and get:
Special Offer: Subscribe to the Economies.com VIP channel and get also a free subscription to a trusted trading signals channel provided by Best Trading Signal.
The EURJPY pair is affected by the negative pressures, due to its repeated stability below the resistance at 164.90, forming several bearish waves, approaching from the initial support at 163.35 level.
The suggested scenario depends on the stability of the current support, to expect activating the bullish track, which might target 164.20 and 164.90 level gradually, while breaking the support and holding below it will increase the chances for resuming the decline, and 162.40 level represents the next target of the bearish track.
The expected trading range for today is between 163.30 and 164.90
Trend forecast: Bullish
Do you need help in trading decisions? Do you want to learn how to start trading?
Join Economies.com VIP Club and benefit from over 15 years of market analysis expertise and get:
Special Offer: Subscribe to the Economies.com VIP channel and get also a free subscription to a trusted trading signals channel provided by Best Trading Signal.
Gold price is looking to extend the previous day’s over 2% sell-off early Thursday. The yellow metal remains vulnerable near monthly lows, trading below $3,200, as it awaits the high-impact US Producer Price Index (PPI) and Retail Sales data ahead of Federal Reserve (Fed) Chair Jerome Powell’s speech.
A negative shift in risk sentiment in Asian trades on Thursday seems to be exerting renewed downward pressure on the US Dollar (USD), helping Gold price pause its decline at the moment.
Traders are turning cautious and refraining from placing directional bets on the Greenback and Gold price before the release of the US PPI inflation and Retail Sales data, which could significantly impact the markets’ expectations of future interest rate cuts by the Fed.
Retail volumes could see a big boost from frontloading to get ahead of US tariffs impact, while the US PPI inflation is set to decline to 2.5% over the year in April. Markets are pricing in about 53 basis points (bps) of Fed rate cut this year, with a probability of a 25 bps rate reduction in September standing at about 50%, according to the CME Group’s Fed Watch Tool.
The increased odds of fewer Fed rate cuts continue to act as a headwind to the non-yielding Gold price, even though the US Consumer Price Index (CPI) cooled slightly in April. Annually, US CPI rose 2.3% in the same period, compared to a forecast of 2.4%.
Gold price also bears the brunt of receding US recession fears, courtesy of the trade truce between the world’s two largest economies – the US and China. Furthermore, optimism over US-South Korea trade talks and expectations of a US-Iran nuclear deal keep the traditional safe-haven Gold price under pressure.
However, it remains to be seen if the Gold price continues its descent, as risk sentiment could deteriorate further if the upcoming Ukraine-Russia peace talks turn sour. Weaker-than-expected US PPI and Retail Sales data could rekindle dovish Fed expectations and provide the much-needed support to Gold price.
Additionally, Gold price could draw support from rising tensions over the US deficit after Treasury reported a $1.049 trillion budget deficit for the first seven months of fiscal 2025, which started October 1, up 23%, or $194 billion, from a year earlier.
Technically, Gold price remains exposed to further downside risks so long as the price stays below the 21-day Simple Moving Average (SMA) at $3,308.
Currently, the yellow metal is challenging the key 50-day Simple Moving Average (SMA) at $3,155.
The 14-day Relative Strength Index (RSI) is currently holding below the midline, near 44, indicating more downside potential.
However, if buyers manage to defend the 50-day SMA at $3,155, a rebound toward the 21-day SMA at $3,308 cannot be ruled out.
Further up, the falling trendline resistance at $3,419 will come into play.
A sustained break below the 50-day SMA support could trigger a fresh downtrend toward the 100-day SMA at $2,972
Ahead of that, the $3,100 round level and the April 10 low of $3,072 would be tested.
Jerome H. Powell took office as a member of the Board of Governors of the Federal Reserve System on May 25, 2012, to fill an unexpired term. On November 2, 2017, President Donald Trump nominated Powell to serve as the next Chairman of the Federal Reserve. Powell assumed office as Chair on February 5, 2018.
Next release:
Thu May 15, 2025 12:40
Frequency:
Irregular
Consensus:
–
Previous:
–
Source:
Federal Reserve
The Gold price (XAU/USD) trades with mild gains near $3,180 during the early Asian session on Thursday. However, the potential upside for the yellow metal might be capped in the near term due to better risk appetite and progress in trade talks.
The precious metal remains on the defensive as tension eases in the global trade war, pushing investors away from safe-haven demand. The US and China agreed to reduce tariffs on each other after two days of negotiations in Geneva, Switzerland. The US lowered tariffs on Chinese imports to 30% from 145%, while China cut tariffs on US imports to 10% from 125%.
“Overall it’s an improved risk sentiment that for now has reduced gold’s appeal,” said Ole Hansen, head of commodities strategy at Saxo Bank A/S.
A top adviser to Iran’s supreme leader, Ali Shamkhani, said late Wednesday that Iran is ready to sign a nuclear deal with certain conditions with US President Donald Trump in exchange for lifting economic sanctions. These positive developments contribute to the Gold’s downside.
However, trade uncertainties and escalating geopolitical risks could help limit the Gold’s losses. Traders will keep an eye on the release of the US Retail Sales and Producer Price Index (PPI) for April later on Thursday. Also, the Federal Reserve (Fed) Chair Jerome Powell is set to speak.
Gold has played a key role in human’s history as it has been widely used as a store of value and medium of exchange. Currently, apart from its shine and usage for jewelry, the precious metal is widely seen as a safe-haven asset, meaning that it is considered a good investment during turbulent times. Gold is also widely seen as a hedge against inflation and against depreciating currencies as it doesn’t rely on any specific issuer or government.
Central banks are the biggest Gold holders. In their aim to support their currencies in turbulent times, central banks tend to diversify their reserves and buy Gold to improve the perceived strength of the economy and the currency. High Gold reserves can be a source of trust for a country’s solvency. Central banks added 1,136 tonnes of Gold worth around $70 billion to their reserves in 2022, according to data from the World Gold Council. This is the highest yearly purchase since records began. Central banks from emerging economies such as China, India and Turkey are quickly increasing their Gold reserves.
Gold has an inverse correlation with the US Dollar and US Treasuries, which are both major reserve and safe-haven assets. When the Dollar depreciates, Gold tends to rise, enabling investors and central banks to diversify their assets in turbulent times. Gold is also inversely correlated with risk assets. A rally in the stock market tends to weaken Gold price, while sell-offs in riskier markets tend to favor the precious metal.
The price can move due to a wide range of factors. Geopolitical instability or fears of a deep recession can quickly make Gold price escalate due to its safe-haven status. As a yield-less asset, Gold tends to rise with lower interest rates, while higher cost of money usually weighs down on the yellow metal. Still, most moves depend on how the US Dollar (USD) behaves as the asset is priced in dollars (XAU/USD). A strong Dollar tends to keep the price of Gold controlled, whereas a weaker Dollar is likely to push Gold prices up.
That being said, the market will do what the market will do, and technical analysis is only good for so much. After all, if it all worked 100% of the time, then people would all be wealthy trading in the Forex markets. That being said though, it does suggest that there is a lot of selling pressure above, so I think the upside at this point in time is probably somewhat limited.
Furthermore, there are a lot of reasons to ask whether or not the risk appetite out there would continue to go higher. After all, even though we’ve had some movement between the Americans and the Chinese, the reality is that we are still in a “wait and see” mode.
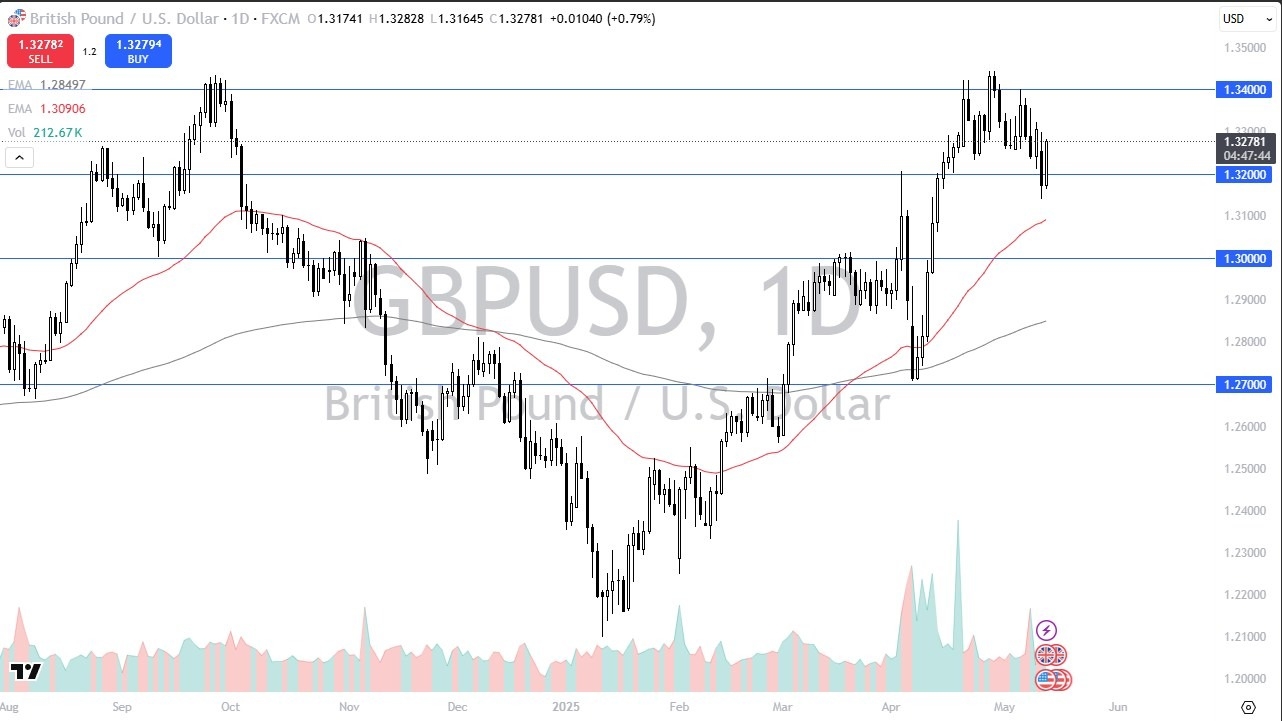
We have those 3 shooting stars on the weekly chart, but I also see a lot of resistance near the 1.34 level. This is an area that’s been important multiple times in the past, and therefore think you need to pay close attention to after all, longer-term charts can guide the way, as larger positions are certainly placed around these areas, but we also have to keep in mind that you must be flexible enough to take the other trade if you do in fact that signal.
For example, the market were to break above the 1.35 level, then it’s obvious that the sellers have been run over, and that the market should probably go higher. On a break lower from here, the 50 Day EMA sits right around the 1.31 level, and is rising. That could be a little bit of dynamic support, but ultimately, I think we can even drop all the way down to the 1.30 level.
Ready to trade the Forex GBP/USD analysis and predictions? Here are the best forex trading platforms UK to choose from.
Christopher Lewis has been trading Forex and has over 20 years experience in financial markets. Chris has been a regular contributor to Daily Forex since the early days of the site. He writes about Forex for several online publications, including FX Empire, Investing.com, and his own site, aptly named The Trader Guy. Chris favours technical analysis methods to identify his trades and likes to trade equity indices and commodities as well as Forex. He favours a longer-term trading style, and his trades often last for days or weeks.
Silver price fell 2% on Wednesday amid elevated US Treasury bond yields as investors seemed confident that the US Federal Reserve would not reduce interest rates. At the time of writing, the XAG/USD trades at $32.20, unchanged as the Asian session begins.
Silver price is set to consolidate within the $32.00 – $33.00 range, capped on the upside by the 50-day Simple Moving Average (SMA) at $32.73 and on the downside by the 100-day SMA at $31.91.
From a momentum standpoint, sellers are in charge, as the Relative Strength Index (RSI) portrays. However, price action dictates that bears must clear the $32.00 mark, followed by the 100-day SMA to aim for lower prices. In that outcome, XAG/USD’s next support would be the 200-day SMA at $31.30. A breach of the latter will expose the $31.00 figure, followed by the latest cycle low seen at $28.33, the April 7 low.
Conversely, if XAG/USD clears the 50-day SMA, the grey metal would be poised to test $33.00. Once surpassed, the next stop would be the April 24 swing high at $33.68 ahead of the $34.00 figure.
Silver is a precious metal highly traded among investors. It has been historically used as a store of value and a medium of exchange. Although less popular than Gold, traders may turn to Silver to diversify their investment portfolio, for its intrinsic value or as a potential hedge during high-inflation periods. Investors can buy physical Silver, in coins or in bars, or trade it through vehicles such as Exchange Traded Funds, which track its price on international markets.
Silver prices can move due to a wide range of factors. Geopolitical instability or fears of a deep recession can make Silver price escalate due to its safe-haven status, although to a lesser extent than Gold’s. As a yieldless asset, Silver tends to rise with lower interest rates. Its moves also depend on how the US Dollar (USD) behaves as the asset is priced in dollars (XAG/USD). A strong Dollar tends to keep the price of Silver at bay, whereas a weaker Dollar is likely to propel prices up. Other factors such as investment demand, mining supply – Silver is much more abundant than Gold – and recycling rates can also affect prices.
Silver is widely used in industry, particularly in sectors such as electronics or solar energy, as it has one of the highest electric conductivity of all metals – more than Copper and Gold. A surge in demand can increase prices, while a decline tends to lower them. Dynamics in the US, Chinese and Indian economies can also contribute to price swings: for the US and particularly China, their big industrial sectors use Silver in various processes; in India, consumers’ demand for the precious metal for jewellery also plays a key role in setting prices.
Silver prices tend to follow Gold’s moves. When Gold prices rise, Silver typically follows suit, as their status as safe-haven assets is similar. The Gold/Silver ratio, which shows the number of ounces of Silver needed to equal the value of one ounce of Gold, may help to determine the relative valuation between both metals. Some investors may consider a high ratio as an indicator that Silver is undervalued, or Gold is overvalued. On the contrary, a low ratio might suggest that Gold is undervalued relative to Silver.
Gold prices are down on Wednesday with the bright metal trading at its lowest since mid-April. The XAU/USD pair accelerated its slide during American trading hours, piercing the $3,200 mark, as investors keep moving away from safe-haven assets. Despite risk appetite receding on Wednesday, investors are less concerned about global growth and a potential United States (US) recession, given the de-escalation of trade tensions between the US and China.
Meanwhile, speculative interest kept digesting US inflation data. The slight uptick in the Consumer Price Index (CPI) in April reminded investors of the “hawkish” Federal Reserve’s stance. As a result, Wall Street trades mixed, with the Nasdaq Composite and the S&P 500 posting modest intraday advances and the Dow Jones Industrial Average (DJIA) down for a second consecutive day.
Data-wise, the macroeconomic calendar remained scarce, but Thursday will bring Australian monthly employment figures, an update on the United Kingdom (UK) Gross Domestic Product, and the US April Producer Price Index (PPI).
From a technical point of view, the daily chart for the XAU/USD pair shows it fell further below a now flat 20 Simple Moving Average (SMA), while technical indicators resumed their slides within negative levels, in line with another leg lower. The 100 and 200 SMAS keep advancing, yet are too far below the current level to be relevant.
In the near term, and according to the 4-hour chart, XAU/USD is bearish. The pair trades below all its moving averages, with the 20 SMA about to cross below the 200 SMA. The latter stands at $3,232, providing relevant resistance in the case of a recovery. Finally, technical indicators lack directional strength but hold within negative levels, reflecting the absence of buying interest.
Support levels: 3,173.80 3,158.40 3,142.65
Resistance levels: 3,198.20 3,215.80 3,232.10