The main category of Forex News.
You can use the search box below to find what you need.
[wd_asp id=1]
The main category of Forex News.
You can use the search box below to find what you need.
[wd_asp id=1]
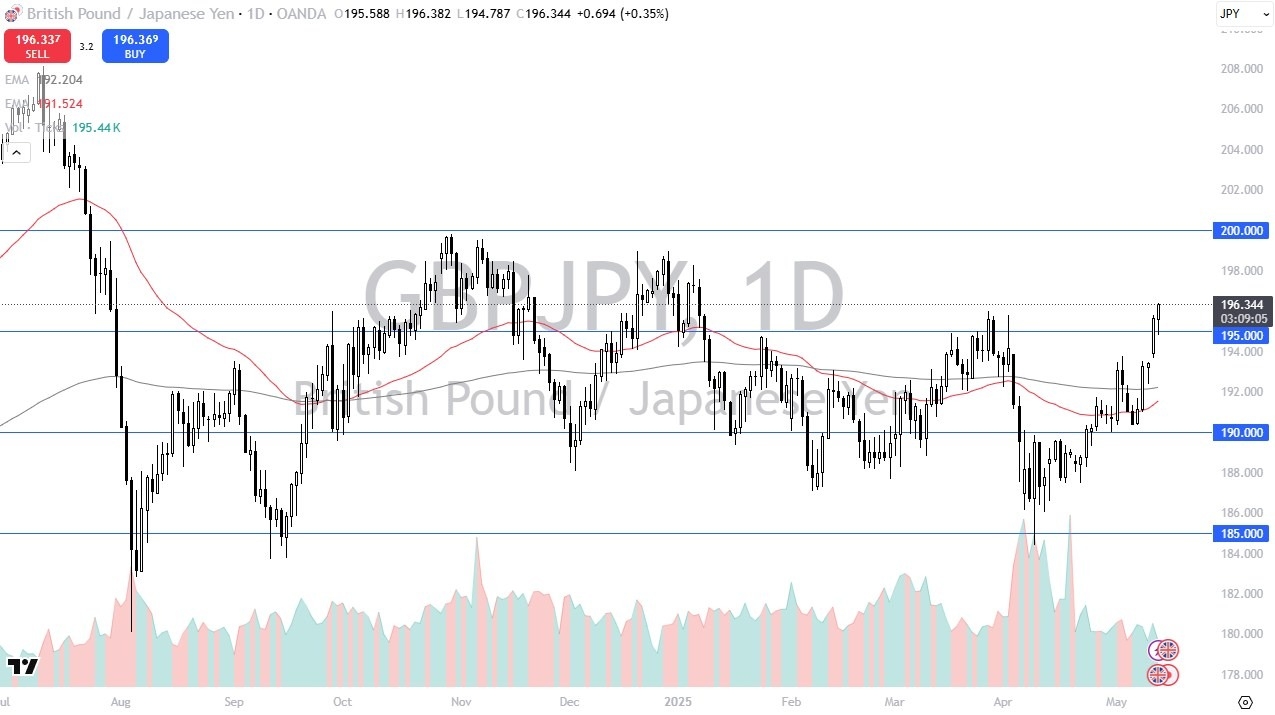
At the end of the session, we are closing, at least it looks like we will, at the very top of the range of the day. At this point, I suspect that if we continue to see more risk on behavior, the market will likely try to get to the 198 yen level, possibly even the 200 yen level. Short-term pullbacks, I think at this juncture continue to offer value. And you should keep in the back of your mind that commercial traders are net short of the Japanese yen in the futures market, which gives us an idea as to how the big money might be targeting this market.
But also, it’s worth noting that this is a market that pays you at the end of every day to hold on to it. So, there is a reason to pay close attention to that. The 200 yen level is probably a major ceiling, and I don’t necessarily think we break through that easily, but this is a chart that looks like it wants to try to go back there and test that area. Underneath, we have significant support near the 193.50 yen level, and then again at the 200 day EMA, which is close to the 192 yen level. Ultimately, I am bullish, and I do think that short-term pullbacks offer short-term buying opportunities.

Begin trading our daily forecasts and analysis. Here is a list of Forex brokers in Japan to work with.
Christopher Lewis has been trading Forex and has over 20 years experience in financial markets. Chris has been a regular contributor to Daily Forex since the early days of the site. He writes about Forex for several online publications, including FX Empire, Investing.com, and his own site, aptly named The Trader Guy. Chris favours technical analysis methods to identify his trades and likes to trade equity indices and commodities as well as Forex. He favours a longer-term trading style, and his trades often last for days or weeks.
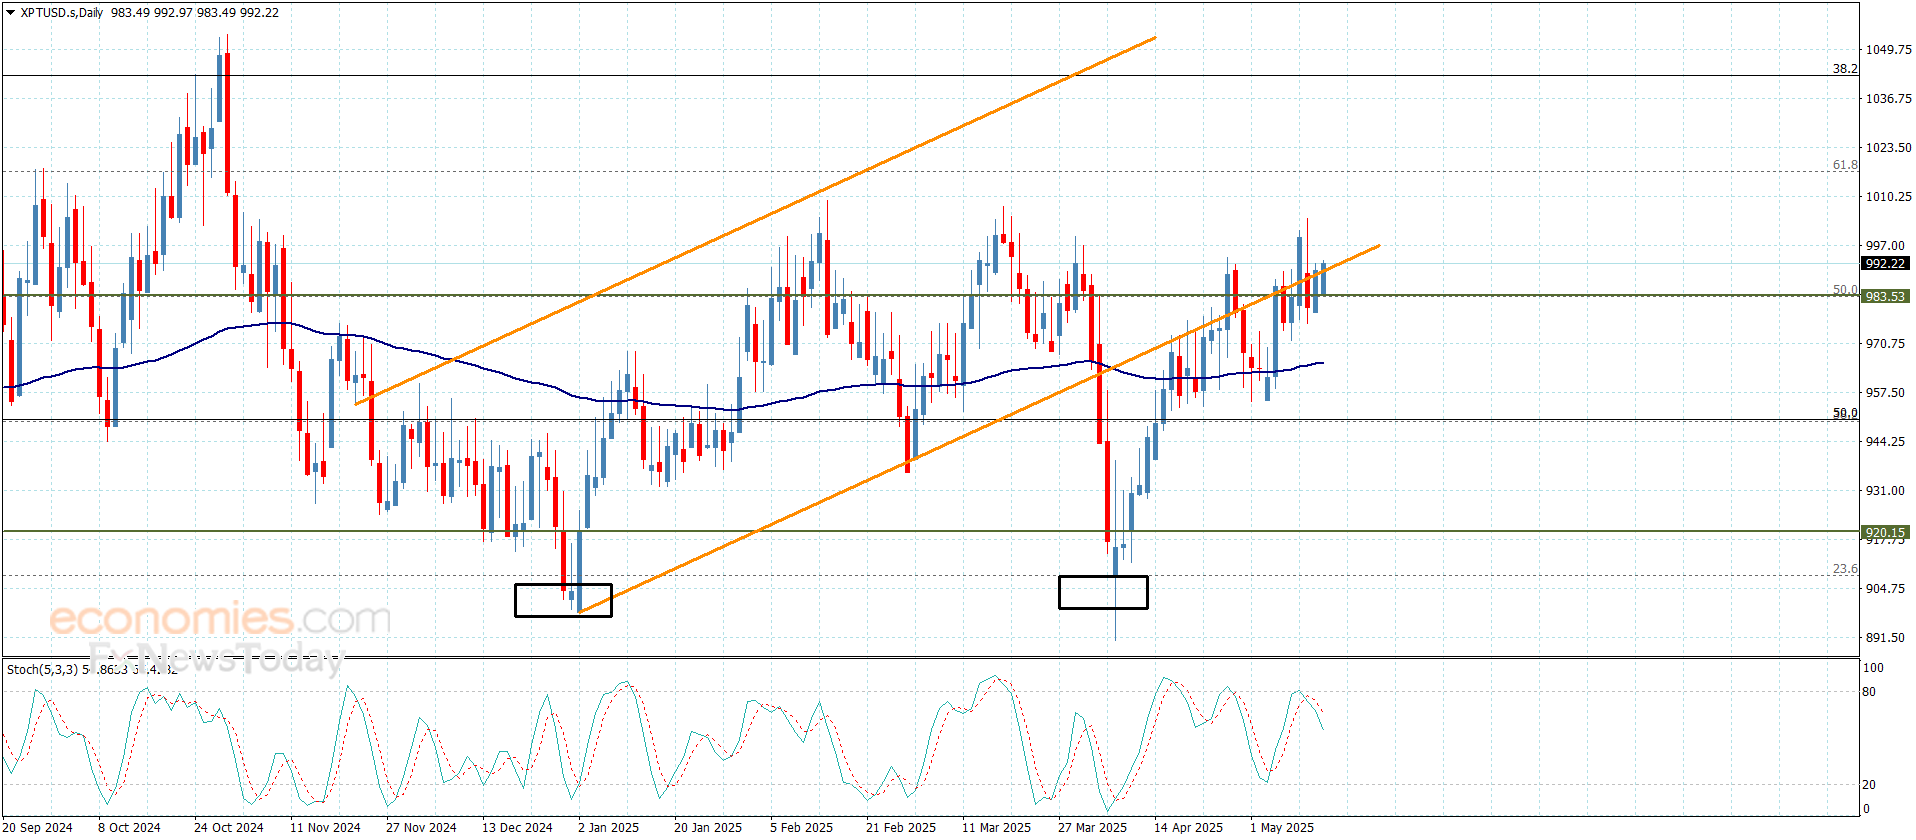
Platinum price forced to provide slow sideways trading, due to the continuation of the main indicators’ contradiction, to keep its fluctuation near the $991.00 level, while the continuation of forming sold barrier at $1005.00 level will increase the chances for activating the negative track, to attack the moving average 55 at $965.00, then press on the support at $950.00.
While regaining the bullish bias requires forming a strong bullish rally, to surpass 61.8% Fibonacci correction level at to confirm its readiness to record new gains that begin at $1027.00, to confirm its readiness to record new gains that begin at $ 1027.00 and $1040.00.
The expected trading range for today is between $965.00 and $ 1000.00
Trend forecast: Bearish
Do you need help in trading decisions? Do you want to learn how to start trading?
Join Economies.com VIP Club and benefit from over 15 years of market analysis expertise and get:
Special Offer: Subscribe to the Economies.com VIP channel and get also a free subscription to a trusted trading signals channel provided by Best Trading Signal.
Platinum price forced to provide slow sideways trading, due to the continuation of the main indicators’ contradiction, to keep its fluctuation near the $991.00 level, while the continuation of forming sold barrier at $1005.00 level will increase the chances for activating the negative track, to attack the moving average 55 at $965.00, then press on the support at $950.00.
While regaining the bullish bias requires forming a strong bullish rally, to surpass 61.8% Fibonacci correction level at to confirm its readiness to record new gains that begin at $1027.00, to confirm its readiness to record new gains that begin at $ 1027.00 and $1040.00.
The expected trading range for today is between $965.00 and $ 1000.00
Trend forecast: Bearish
Do you need help in trading decisions? Do you want to learn how to start trading?
Join Economies.com VIP Club and benefit from over 15 years of market analysis expertise and get:
Special Offer: Subscribe to the Economies.com VIP channel and get also a free subscription to a trusted trading signals channel provided by Best Trading Signal.
Platinum price forced to provide slow sideways trading, due to the continuation of the main indicators’ contradiction, to keep its fluctuation near the $991.00 level, while the continuation of forming sold barrier at $1005.00 level will increase the chances for activating the negative track, to attack the moving average 55 at $965.00, then press on the support at $950.00.
While regaining the bullish bias requires forming a strong bullish rally, to surpass 61.8% Fibonacci correction level at to confirm its readiness to record new gains that begin at $1027.00, to confirm its readiness to record new gains that begin at $ 1027.00 and $1040.00.
The expected trading range for today is between $965.00 and $ 1000.00
Trend forecast: Bearish
Do you need help in trading decisions? Do you want to learn how to start trading?
Join Economies.com VIP Club and benefit from over 15 years of market analysis expertise and get:
Special Offer: Subscribe to the Economies.com VIP channel and get also a free subscription to a trusted trading signals channel provided by Best Trading Signal.
The Gold price (XAU/USD) trades in negative territory around $3,245 during the early Asian session on Wednesday. Improved risk appetite in the financial markets due to a tariff deal between the United States (US) and China weighs on the yellow metal, a safe-haven asset. Traders will focus on the Fedspeak later on Wednesday.
The US and China, the world’s two largest economies, agreed to reduce tariffs on each other after two days of negotiations in Geneva, Switzerland. The US lowered tariffs on Chinese imports to 30% from 145%, while China cut tariffs on US imports to 10% from 125%. These positive developments boost market sentiment and undermine the precious metal.
Additionally, easing tensions between India and Pakistan also weighed on the Gold price. The ceasefire remained intact in Jammu and Kashmir and across border towns overnight, following India’s Prime Minister Narendra Modi’s stern message to terrorists and Pakistan. Modi said on Monday that India will not tolerate any “nuclear blackmail.” He added that operations against Pakistan have only been paused, and the future will depend on their behavior.
“Gold and silver showed a heavy selloff at the start of the new week amid a trade deal between the US and China in Switzerland. The dollar index and the US bond yields jumped after the announcement of trade deals. The Indo-Pak ceasefire over the weekend also eases safe-haven buying for precious metals,” Manoj Kumar Jain of Prithvifinmart Commodity Research observed.
Nonetheless, any signs of escalation between India and Pakistan, along with the economic uncertainty triggered by US President Donald Trump’s tariff policies, could boost the safe-haven flows, benefiting the Gold price.
Gold has played a key role in human’s history as it has been widely used as a store of value and medium of exchange. Currently, apart from its shine and usage for jewelry, the precious metal is widely seen as a safe-haven asset, meaning that it is considered a good investment during turbulent times. Gold is also widely seen as a hedge against inflation and against depreciating currencies as it doesn’t rely on any specific issuer or government.
Central banks are the biggest Gold holders. In their aim to support their currencies in turbulent times, central banks tend to diversify their reserves and buy Gold to improve the perceived strength of the economy and the currency. High Gold reserves can be a source of trust for a country’s solvency. Central banks added 1,136 tonnes of Gold worth around $70 billion to their reserves in 2022, according to data from the World Gold Council. This is the highest yearly purchase since records began. Central banks from emerging economies such as China, India and Turkey are quickly increasing their Gold reserves.
Gold has an inverse correlation with the US Dollar and US Treasuries, which are both major reserve and safe-haven assets. When the Dollar depreciates, Gold tends to rise, enabling investors and central banks to diversify their assets in turbulent times. Gold is also inversely correlated with risk assets. A rally in the stock market tends to weaken Gold price, while sell-offs in riskier markets tend to favor the precious metal.
The price can move due to a wide range of factors. Geopolitical instability or fears of a deep recession can quickly make Gold price escalate due to its safe-haven status. As a yield-less asset, Gold tends to rise with lower interest rates, while higher cost of money usually weighs down on the yellow metal. Still, most moves depend on how the US Dollar (USD) behaves as the asset is priced in dollars (XAU/USD). A strong Dollar tends to keep the price of Gold controlled, whereas a weaker Dollar is likely to push Gold prices up.
Silver price edged up 0.95% on Tuesday as the Greenback finished the session below the 101.00 figure, according to the US Dollar Index (DXY), which tracks the performance of the buck’s value against a basket of six currencies. At the time of writing, as the Asian session begins, XAG/USD trades at $32.92, registering modest gains near the $33.00 figure.
The Silver technical outlook suggests that further consolidation lies ahead, with stir resistance found at the psychological $33.00 figure. However, momentum indicators like the Relative Strength Index (RSI), despite remaining bullish, turned flattish as indecision sinks on traders.
For a bullish resumption, buyers need to reclaim $33.00 and clear the latest swing high reached on May 7 at $33.25. Once surpassed, $33.50 emerges as next resistance, followed by the April 28 high of $33.68. A breach of the latter will expose $34.00.
Conversely, if XAG/USD drifts below the 50-day Simple Moving Average (SMA) of $32.75, a move towards the 100-day SMA at $31.89 is likely. On further weakness, the bulls’ following line of defense would be the 200-day SMA at $31.28.
Silver is a precious metal highly traded among investors. It has been historically used as a store of value and a medium of exchange. Although less popular than Gold, traders may turn to Silver to diversify their investment portfolio, for its intrinsic value or as a potential hedge during high-inflation periods. Investors can buy physical Silver, in coins or in bars, or trade it through vehicles such as Exchange Traded Funds, which track its price on international markets.
Silver prices can move due to a wide range of factors. Geopolitical instability or fears of a deep recession can make Silver price escalate due to its safe-haven status, although to a lesser extent than Gold’s. As a yieldless asset, Silver tends to rise with lower interest rates. Its moves also depend on how the US Dollar (USD) behaves as the asset is priced in dollars (XAG/USD). A strong Dollar tends to keep the price of Silver at bay, whereas a weaker Dollar is likely to propel prices up. Other factors such as investment demand, mining supply – Silver is much more abundant than Gold – and recycling rates can also affect prices.
Silver is widely used in industry, particularly in sectors such as electronics or solar energy, as it has one of the highest electric conductivity of all metals – more than Copper and Gold. A surge in demand can increase prices, while a decline tends to lower them. Dynamics in the US, Chinese and Indian economies can also contribute to price swings: for the US and particularly China, their big industrial sectors use Silver in various processes; in India, consumers’ demand for the precious metal for jewellery also plays a key role in setting prices.
Silver prices tend to follow Gold’s moves. When Gold prices rise, Silver typically follows suit, as their status as safe-haven assets is similar. The Gold/Silver ratio, which shows the number of ounces of Silver needed to equal the value of one ounce of Gold, may help to determine the relative valuation between both metals. Some investors may consider a high ratio as an indicator that Silver is undervalued, or Gold is overvalued. On the contrary, a low ratio might suggest that Gold is undervalued relative to Silver.
May 13, 2025 – Written by Tim Boyer
STORY LINK GBP/USD Forecast: Pound Climbs vs Dollar on Soft US Inflation Data
The Pound US Dollar exchange rate gained ground on Tuesday as the US released its latest inflation reading.
At the time of writing, GBP/USD was trading at approximately $1.3245, up roughly 0.5% from the start of Tuesday’s session.
The US Dollar (USD) came under pressure on Tuesday following the publication of a softer-than-expected US inflation print.
April’s consumer price index (CPI) showed headline inflation easing to 2.3%, down from 2.4%, marking the lowest rate in more than four years and falling short of forecasts for a steady reading.
The unexpected decline prompted traders to reassess the Federal Reserve’s policy trajectory, dragging the ‘Greenback’ lower.
Adding to the downside, a generally upbeat market mood saw investors shy away from the safe-haven currency, intensifying the USD’s losses.
The Pound (GBP) faced early pressure on Tuesday after disappointing UK labour market figures dented investor confidence.

According to the latest ONS (Office for National Statistics) report, unemployment climbed to 4.5% in March, reaching its highest level since summer 2021, while wage growth (excluding bonuses) cooled more than anticipated, slipping from 5.9% to 5.6%.
The figures fell short of forecasts and raised fresh concerns about the strength of the UK jobs market.
Despite the initial downturn, Sterling found firmer footing later in the session, particularly against safe-haven currencies like the US Dollar.
A risk-on mood helped offset earlier losses, with the Pound’s sensitivity to risk sentiment offering it modest support into the afternoon.
In the absence of fresh economic data from either side of the Atlantic, the spotlight is now on central bank commentary to drive movement in the GBP/USD exchange rate.
Following the Bank of England’s (BoE) hawkish commentary at its most recent policy meeting, further optimistic signals could offer the Pound additional support during Wednesday’s European session.
For the US Dollar, if the Federal Reserve responds to Tuesday’s cooler-than-forecast inflation figures with dovish signals, the US Dollar may come under renewed pressure as the week unfolds.

International Money Transfer? Ask our resident FX expert a money transfer question or try John’s new, free, no-obligation personal service! ,where he helps every step of the way,
ensuring you get the best exchange rates on your currency requirements.
TAGS: Pound Dollar Forecasts
Resistance was seen near recent highs that are marked by several indicators that converged around a price zone. If the price of natural gas was going to pullback further from recent highs, now would be the time to do it. It is important to recognize that since the April 24 swing low of $2.86, there have been only two previous pullbacks of one day each. Anything more than one day pullback would be a change in that pattern and possibly an indication of a slowdown in bullish momentum.
As of yesterday’s high, of $3.84, the price of natural gas had risen by $0.98 or 34.4% in only 12 days. Since a significant potential resistance zone has been reached a deeper bearish pullback would not be a surprise. If an advance above this week’s high is to be sustained, a period of consolidation or larger pullback could provide preparation time for demand to build.
The 38.2% Fibonacci retracement is at $3.47 and provides an initial downside target. And it can be considered along with a prior pullback low of $3.42. That low is part of the price structure of the near-term uptrend. Therefore, it has some significance, particularly if it fails to hold as support. The potentially significant support area around the 20-Day MA is now at $3.37 and is the next lower target if $3.42 fails to hold.
For a look at all of today’s economic events, check out our economic calendar.
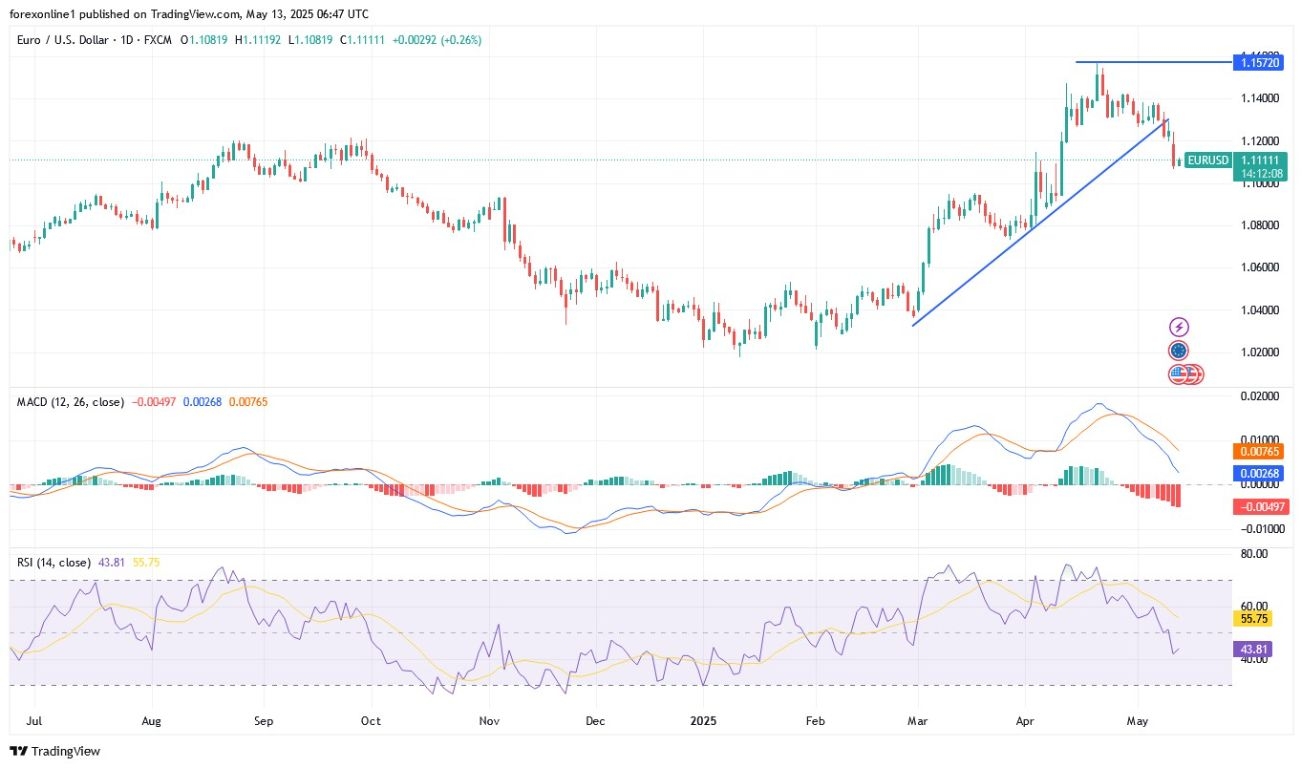
Ahead of the important US inflation figures announcement today, the EUR/USD currency pair is facing selling pressures that pushed it towards the 1.1065 support level, the lowest for the pair in a month, before stabilizing around the 1.1086 level at the start of trading today, Tuesday. Across licensed trading company platforms, selling pressure on EUR/USD increased amidst easing trade tensions between Washington and Beijing. Recently, the United States and China agreed to reduce tariffs for 90 days following talks in Geneva, representing a significant de-escalation in the trade war that erupted last month.
Under the US/China agreement, US tariffs on Chinese goods will decrease from 145% to 30%, while Chinese tariffs on US imports will decrease from 125% to 10%. In other geopolitical developments, Ukrainian President Zelensky announced his readiness to meet Russian President Putin in Turkey next Thursday, while the fragile ceasefire between India and Pakistan continued.
Overall, according to Forex market trading, this news revived risk appetite, but this time it favoured the US dollar over the Euro, as traders prepared to reassess Federal Reserve policy expectations. Analysts anticipate that Federal Reserve officials will adjust their interest rate forecasts in light of receding inflation risks following the easing of trade tensions.
Be cautious. Increasing market optimism about resolving the global trade dispute will increase the US dollar’s gains and put the Euro under stronger downward pressure.
Regarding the monetary policy of global central banks, money markets now price the European Central Bank’s deposit facility rate at 1.75% by the end of the year – returning to levels last seen in mid-April, before the ECB hinted at a possible interest rate cut to counter the potential economic repercussions of US tariffs. As of April 25, 2025, financial markets were expecting an interest rate below 1.55%, rising to 1.67% by late Friday.
The most prominent bearish scenario for EUR/USD in Forex market trading is that bear control over the Euro/Dollar direction will strengthen by moving towards and below the psychological support level of 1.1000. Adding to the strength of the downward shift is the 14-day Relative Strength Index (RSI) moving strongly below the midline, with room and time to move towards stronger bearish levels before reaching the oversold zone. Following a similar path, but lagging, the MACD indicator lines are closer to the midline, increasing the chances of the current bearish shift for the EUR/USD pair.
According to the performance on the daily chart, the move of EUR/USD towards the 1.10 support will support a move towards the next stronger support levels of 1.0945 and 1.0880, respectively.
The expected bullish scenario for EUR/USD will not have an opportunity without the bulls returning the currency pair towards the resistance levels of 1.1285 and 1.1370 again; otherwise, the bearish shift for EUR/USD will remain stronger. The recent selling of EUR/USD will be influenced today by the announcement of the German ZEW Sentiment Index reading at 12:00 PM Egypt time, amidst expectations of a strong improvement in the index readings. Later the same day, the US Consumer Price Index (CPI) reading will be announced at 3:30 PM Egypt time, keeping in mind that the CPI results will affect market expectations for the future policies of the US Federal Reserve.
Ready to trade our Forex daily forecast? We’ve shortlisted the best forex broker list for you to check out.
Spot Gold consolidates losses on Tuesday, holding above the $3,200 mark yet unable to recover the ground lost on Monday. Financial markets retain the positive mood triggered by news of de-escalating trade tensions between the United States (US) and China, as both countries agreed to reduced tariffs on each other for 90 days.
Other than that, the US released the April Consumer Price Index (CPI), which rose by 2.3% compared to a year earlier, easing from the previous 2.4%. The core annual reading, in the meantime, remained unchanged at 2.8%. Finally, the monthly CPI was up 0.2%, above the previous -0.1% but below the 0.3% anticipated by market players.
The upbeat mood weighed on the Greenback, leading to a modest XAU/USD advance. Meanwhile, Wall Street trades mixed. The Dow Jones Industrial Average is down roughly 0.40%, still positive for the week after adding over 1,000 points on Monday. The Nasdaq Composite and the S&P 500 post intraday gains, with the latter turning positive for the year.
XAU/USD hovers around $3,250, and the daily chart shows a limited upward potential. The pair keeps developing below a flat 20 Simple Moving Average (SMA), providing dynamic resistance at around $3,316.70. The 100 and 200 SMAs maintain their upward slopes far below the current level, suggesting bulls have not yet given up. Finally, technical indicators stand in neutral territory, with the Relative Strength Index (RSI) indicator consolidating at around 50, failing to provide clear directional clues.
In the near term, and according to the 4-hour chart, a mildly bullish 200 SMA at around $3.225.40 provides support for a second consecutive day, yet at the same time, the 20 SMA accelerated south above the current level and after crossing below a flat 100 SMA, in line with increased selling interest. Technical indicators, in the meantime, consolidate within negative levels, also supporting a bearish extension, particularly if the pair finally breaks below the mentioned 200 SMA.
Support levels: 3,241.90 3,225.40 3,212.85
Resistance levels: 3,265.40 3,281.60 3,305.65