The main category of Forex News.
You can use the search box below to find what you need.
[wd_asp id=1]
The main category of Forex News.
You can use the search box below to find what you need.
[wd_asp id=1]
The US dollar has skyrocketed against the Japanese yen, although it does seem to be finding a little bit of trouble around the 148 yen level. But nonetheless, remember, people get paid to hold this currency pair. So not only were we forming a bottoming pattern around the 140 yen level, but you were collecting swap along the way. Now that some of the trade tensions seem to be disappearing, it makes perfect sense that this pair would rally.
This pair does tend to rally with risk appetite and risk appetite, according to the stock markets at least, which has gone through the ceiling during the trading session. So, I expect an attempt to get back to the 200 day EMA before it’s all said and done, with the occasional pullback offering buying opportunities.
The US dollar has strengthened against the Australian dollar a bit, as the Aussie initially tried to rally in celebration of perhaps Chinese growth due to the trade deal, only to turn around and fall as the US dollar has strengthened against almost everything. At this point, I’m watching the 0.635 zero level because if we break significantly below there, we are going much lower.
On the other hand, if we turn around and take out the 0.65 level to the upside on a daily close, then I think the Aussie has a chance of going all the way to 0.67 followed by 0.69. Remember though, the Australian dollar is highly levered to China, so we’ll have to see how that plays out.
For a look at all of today’s economic events, check out our economic calendar.
Natural gas futures are trading around $3.734, approaching the upper boundary of a well-defined ascending channel. The price recently pulled back from the $3.825 resistance level, a critical barrier that has capped gains in recent sessions. This level represents a key psychological zone for traders, with a potential breakout setting the stage for a move toward $3.926, followed by the significant $4.020 resistance.
On the downside, immediate support lies at $3.722, aligning closely with the lower trendline of the ascending channel. A break below this level could expose natural gas to further downside toward the $3.626 support, followed by the 50-day EMA at $3.644, which acts as a critical support for the ongoing uptrend.
Natural gas is testing the upper boundary of its ascending channel, with a break above $3.825 potentially signaling a continuation toward $3.926. However, a pullback below $3.722 could risk a deeper correction, targeting the $3.626 area.
Meanwhile, the GBP exchange rate is trading with positive momentum and is expected to continue its gains this week. Also, its gains come on the back of news that the United States and China have made progress towards a new trade agreement in weekend talks held in Geneva. This progress is crucial in boosting global investor confidence, which is a major driver for the British Pound. According to the latest developments, Chinese Vice Premier He Lifeng stated that the talks represent an “important first step” towards reaching a new trade agreement. He added, “Once announced, it will be good news for the world.”
Overall, the signs of progress were not expected so quickly, given the significant deterioration in relations between the United States and China following President Donald Trump’s imposition of large tariffs. Investors welcomed the progress made on Monday, which led to a rise in global stock markets amid “risk-on” trading.

We still advise buying the Pound Sterling against the US dollar from every downward level, but without risk and while monitoring the factors affecting the performance of the currency pair.
Looking at the economic calendar, the United Kingdom releases highly important wage and employment data on Tuesday, which often triggers volatility. Wages are expected to remain high, preventing the Bank of England from accelerating the pace of interest rate cuts. The Bank provided a more cautious-than-expected assessment of its performance in the May Monetary Policy Report last week, defying expectations that it might have paved the way for another interest rate cut in June.
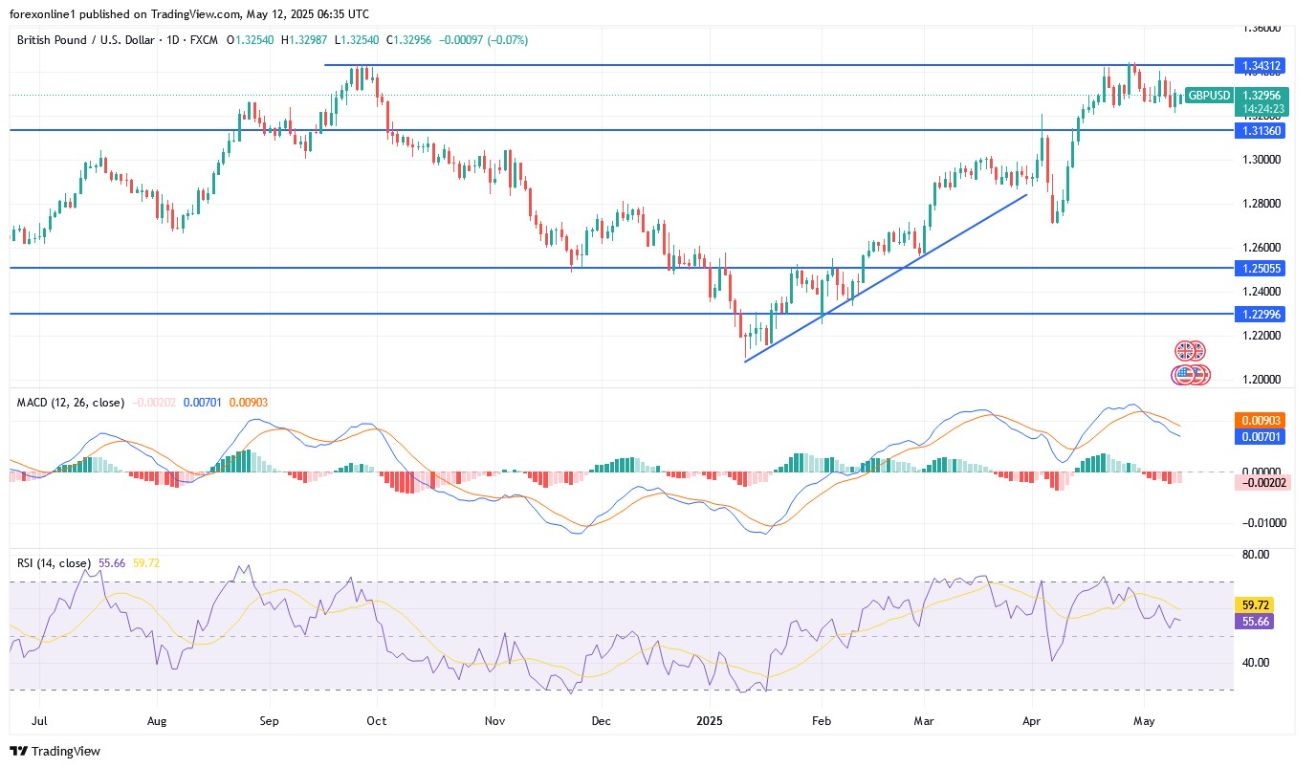
As clearly shown on the performance of the GBP/USD currency pair on the daily timeframe chart, the situation is neutral, with a balance between bear and bull control over the direction. Despite the recent selling, the 14-day Relative Strength Index (RSI) has not reached the midline, giving hope for sustained upward movement. However, the MACD indicator for the 12.26 closing is leaning downwards. Bear control over the Sterling against the US dollar will strengthen if it moves towards the support levels of 1.3190 and 1.3080, respectively. Conversely, over the same time frame, the 1.3400 resistance will remain the most important for bulls to control and prepare for stronger upward breakouts.
Decisively, we expect the pound to remain stable against the US dollar until markets and investors react to the announcement of US inflation figures, which will impact expectations for the future policies of the US Federal Reserve.
Ready to trade our daily Forex GBP/USD analysis? We’ve made this UK forex brokers list for you to check out.
Silver (XAG/USD) is trading around $32.91, facing similar pressure as traders digest the latest trade headlines. The metal remains under pressure despite geopolitical uncertainties, as a stronger dollar and rising risk appetite diminish its safe-haven appeal.
However, silver has managed to hold above the critical $32.75 support level, suggesting that buyers are still active at lower levels. According to the latest data, silver is down nearly 3% from its monthly high of $33.85, reflecting the broader shift toward riskier assets.
Looking ahead, traders will focus on US inflation data due this week, which could provide further direction for gold and silver. The Consumer Price Index (CPI) is expected to show a 4.1% year-over-year increase, a potential sign that inflation remains sticky despite recent Fed rate hikes.
Additionally, Fed Chair Jerome Powell’s speech on Thursday will be closely watched for insights into the central bank’s outlook on future rate cuts.
Gold faces near-term pressure, with a break below $3,259 potentially signaling a deeper correction toward $3,211, while silver must clear $33.25 to confirm an uptrend.
Over the past weekend, officials from both countries indicated progress, with US representatives praising an agreement aimed at reducing the trade deficit, while Chinese leaders described the outcome as an “important consensus.” Meanwhile, US Trade Secretary Howard Lutnick stated that the basic 10% tariff on other countries will “likely remain in place for the foreseeable future.” Investors also closely monitored the ongoing trade talks between the US and Japan, with Tokyo seeking to reach an agreement by June. Domestically, Japan recorded a current account surplus of 3.45 trillion yen in March, following a record surplus of 4.06 trillion yen in February.
Obviously, the upward shift in the USD/JPY pair requires an end to the trade dispute between the United States and global economies. Furthermore, failure to do so could lead to renewed selling of the currency pair.
During today’s trading and across stock trading company platforms, the Japanese Nikkei 225 stock index rose by 0.2% to reach 37,600 points, while the broader Topix index rose by 0.4% to reach 2,744 points, marking its highest level in six weeks. This increase came as the US indicated “tangible progress” in trade negotiations with China over the weekend in Switzerland. The US highlighted its efforts to reduce its trade deficit, while Chinese leaders affirmed reaching an “important consensus.”
However, US Trade Secretary Howard Lutnick indicated that the basic 10% tariffs on other countries are expected to remain in place “for the foreseeable future.” Investors also monitored the ongoing trade negotiations between the US and Japan, with Tokyo aiming to finalize a potential agreement by June. According to trading, gains were led by the shares of major companies included in the index, including Kawasaki Heavy Industries (up 3.9%), Disco Corp (2.5%), Fujikura (1.8%), Advantest (4%), and IHI Corp (1%).
According to an official announcement today, Japan’s services sector index fell to 42.6 points in April 2025, from 45.1 points in the previous month, marking its lowest level since February 2022 and the fourth consecutive month of decline. The household budget trends index in housing-related sectors decreased, but it increased in the food and beverage sector. The corporate trends index also declined, affected by the non-manufacturing sector’s decrease. Employment also saw a decline during this period. Meanwhile, the economic outlook index fell to 42.7 points in April, its lowest level in four years, from 45.2 points in March, reflecting increasing concerns about the impact of US trade policy and persistent cost pressures.
According to recent trading, the USD/JPY pair continues to trade above the 100-hour moving average by a few levels. Last Friday’s decline helped the currency pair recover from the overbought condition of the 14-hour Relative Strength Index. In the short term, bears will target selling moves towards the support level of 145.60, then to the support of 145.00, respectively. Conversely, bulls will look to capitalize on upward rebounds with gains to the resistance level of 146.30, then to the resistance of 146.85, respectively.
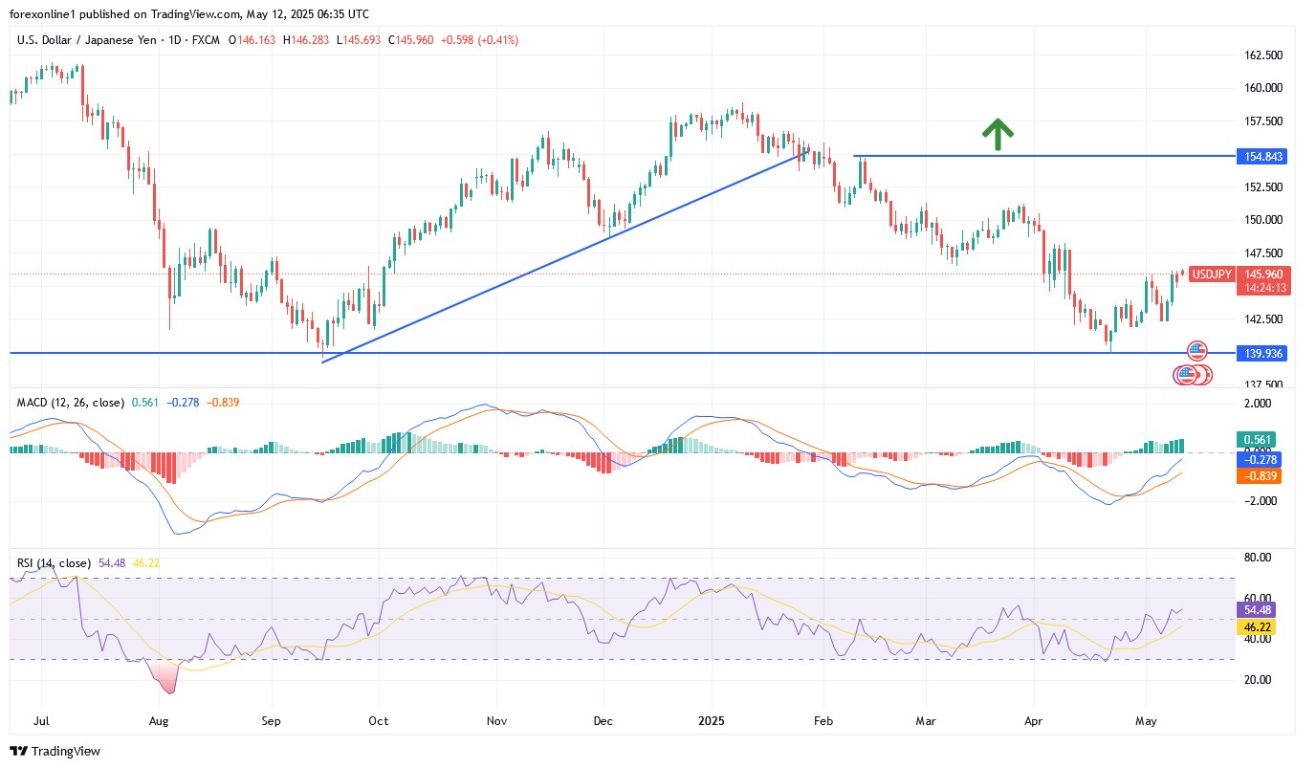
In the long term, according to the performance on the daily chart, the USD/JPY pair is trading within a descending channel. However, the 14-day Relative Strength Index recently rebounded to avoid moving into oversold levels. Therefore, bulls will target extended rebounds at the resistance level of 147.50, then to the psychological resistance of 150.00, respectively. Conversely, over the same time frame, bears will seek to capitalize on the current wave of declines to move towards the support level of 143.00, then to the psychological support of 140.00, respectively.
Want to trade our USD/JPY forex analysis and predictions? Here’s a list of forex brokers in Japan to check out.
Despite the last weak trading of the EURJPY pair, it success to settle above the breached barrier at 193.35 level represents a main factor for confirming the domination of the bullish track, to fluctuate near 193.85, attempting to ease the way towards more of the bullish waves.
Stochastic approach from 80 level will increase the chances of gathering the positive momentum, to keep waiting for recording the target near 164.20, then repeats the attempts of pressing on the resistance near 164.90, to form the next target of the near trading.
The expected trading range for today is between 163.30 and 164.90
Trend forecast: Bullish
Do you need help in trading decisions? Do you want to learn how to start trading?
Join Economies.com VIP Club and benefit from over 15 years of market analysis expertise and get:
Special Offer: Subscribe to the Economies.com VIP channel and get also a free subscription to a trusted trading signals channel provided by Best Trading Signal.
A downward price gap affected the EUR/USD currency pair at the start of trading this important week, with losses extending to the 1.1183 support level, the lowest for the pair in a month, before stabilizing around the 1.1220 level at the time of writing this analysis. The Forex market was affected at the beginning of the US inflation week by signals from trade talks between China and the United States. Trump confirmed “significant progress” in US-China trade talks – but a final agreement remains uncertain.
According to the movement of technical indicators, EUR/USD trading on the daily timeframe chart indicates the formation of a reverse descending channel, and the 1.1130 support will remain important for strong and continuous bear control over the currency pair’s direction. With the recent losses, the 14-day Relative Strength Index (RSI) strongly pushed to break the midline, confirming the bearish shift. It has more room for larger losses before reaching the oversold zone. At the same time, the MACD lines confirm the downward movement, with the blue line significantly preceding the orange line.
Keep in mind that the EUR/USD trend is entering a new downward phase, which will be confirmed soon. Monitor the factors influencing the forex market to find the best trading opportunities.
The EUR/USD currency pair is not anticipating any important economic data during today’s Monday trading session, neither from the Eurozone nor the United States. Accordingly, the currency pair will move within narrow ranges until confirmation of trade agreements between global economies to avoid wider trade wars that threaten the future of global economic recovery. On the economic front, US inflation figures will remain the most prominent focus for currency traders this week.
In this regard, US President Donald Trump enthusiastically tweeted about the recent trade discussions with China in Switzerland, describing them as “friendly but constructive” and noting “significant progress.” While this optimism from Trump can be viewed positively, leading market participants to anticipate positive outcomes for stocks and risk-sensitive currencies, investors and traders should exercise caution. On the one hand, Trump’s optimistic tone may reflect genuine achievements, which could lead to significant benefits for American companies and reduce trade tensions. If this development proves true with concrete details, it will have a significant positive impact on market sentiment. However, it can be reasonably assumed that a trade agreement has not yet been finalized, as such a crucial achievement would likely be accompanied by a definitive announcement or confirmation from other official channels.
Historically, optimistic statements from leaders – especially Trump – have sometimes preceded difficult negotiations that did not immediately lead to final agreements. Therefore, Trump’s message may primarily aim to shape positive market sentiment rather than indicate a completely finalized agreement.
Therefore, investors and traders in financial markets should anticipate further negotiations and detailed announcements from US and Chinese officials. Until a firm and solid agreement is reached, maintaining prudent risk management remains essential amid potentially volatile trade headlines.
Ready to trade our EUR/USD daily forecast? Here’s a list of some of the top forex brokers in Europe to check out.
Platinum price succeeded to confirm surpassing the barrier at $983.00, activating the suggested bullish rally, to achieve the initial target by reaching $1002.00, the stability of the price above the breached barrier is required for taking advantage of the main indicators positivity, to attempt to record new gains by its rally towards 61.8%Fibonacci correction level at $1017.00.
The price decline below $983.00 and providing negative close will cancel the bullish suggestion, which forces the price to suffer several losses by reaching $965.00, then press on the support at $950.00.
The expected trading range for today is between $990.00 and $1017.00
Trend forecast: Bullish
Do you need help in trading decisions? Do you want to learn how to start trading?
Join Economies.com VIP Club and benefit from over 15 years of market analysis expertise and get:
Special Offer: Subscribe to the Economies.com VIP channel and get also a free subscription to a trusted trading signals channel provided by Best Trading Signal.
Platinum price succeeded to confirm surpassing the barrier at $983.00, activating the suggested bullish rally, to achieve the initial target by reaching $1002.00, the stability of the price above the breached barrier is required for taking advantage of the main indicators positivity, to attempt to record new gains by its rally towards 61.8%Fibonacci correction level at $1017.00.
The price decline below $983.00 and providing negative close will cancel the bullish suggestion, which forces the price to suffer several losses by reaching $965.00, then press on the support at $950.00.
The expected trading range for today is between $990.00 and $1017.00
Trend forecast: Bullish
Do you need help in trading decisions? Do you want to learn how to start trading?
Join Economies.com VIP Club and benefit from over 15 years of market analysis expertise and get:
Special Offer: Subscribe to the Economies.com VIP channel and get also a free subscription to a trusted trading signals channel provided by Best Trading Signal.
Silver price (XAG/USD) is extending its gains for the third consecutive session, trading around $32.90 per troy ounce during Asian hours on Monday. The precious metal drew support from news that Canadian miner Pan American Silver will acquire MAG Silver Corp in a deal valuing the company at approximately $2.1 billion, according to Reuters.
The acquisition grants Pan American Silver access to MAG’s 44% stake in the high-grade Juanicipio Silver mine in Mexico, operated by Fresnillo, which owns the remaining 56%. The deal, unanimously approved by both companies’ boards, is expected to close in the second half of 2025.
Geopolitical tensions, meanwhile, continue to lend support to Silver. India warned Pakistan of potential retaliation over recent ceasefire violations, a claim denied by Pakistan’s military. Separately, Ukrainian President Volodymyr Zelenskyy expressed hope for a temporary ceasefire with Russia starting Monday, May 12, but Moscow rejected the proposal, calling instead for direct talks without preconditions.
However, gains in Silver may be capped by easing safe-haven demand amid growing optimism surrounding US-China trade relations. Over the weekend, both countries concluded productive discussions, with Beijing set to launch formal negotiations and Washington citing progress toward an agreement.
Further weighing on Silver, the Federal Reserve last week flagged inflation and labor market risks, with Chair Jerome Powell ruling out a preemptive rate cut in response to tariff-related economic concerns.
Silver is a precious metal highly traded among investors. It has been historically used as a store of value and a medium of exchange. Although less popular than Gold, traders may turn to Silver to diversify their investment portfolio, for its intrinsic value or as a potential hedge during high-inflation periods. Investors can buy physical Silver, in coins or in bars, or trade it through vehicles such as Exchange Traded Funds, which track its price on international markets.
Silver prices can move due to a wide range of factors. Geopolitical instability or fears of a deep recession can make Silver price escalate due to its safe-haven status, although to a lesser extent than Gold’s. As a yieldless asset, Silver tends to rise with lower interest rates. Its moves also depend on how the US Dollar (USD) behaves as the asset is priced in dollars (XAG/USD). A strong Dollar tends to keep the price of Silver at bay, whereas a weaker Dollar is likely to propel prices up. Other factors such as investment demand, mining supply – Silver is much more abundant than Gold – and recycling rates can also affect prices.
Silver is widely used in industry, particularly in sectors such as electronics or solar energy, as it has one of the highest electric conductivity of all metals – more than Copper and Gold. A surge in demand can increase prices, while a decline tends to lower them. Dynamics in the US, Chinese and Indian economies can also contribute to price swings: for the US and particularly China, their big industrial sectors use Silver in various processes; in India, consumers’ demand for the precious metal for jewellery also plays a key role in setting prices.
Silver prices tend to follow Gold’s moves. When Gold prices rise, Silver typically follows suit, as their status as safe-haven assets is similar. The Gold/Silver ratio, which shows the number of ounces of Silver needed to equal the value of one ounce of Gold, may help to determine the relative valuation between both metals. Some investors may consider a high ratio as an indicator that Silver is undervalued, or Gold is overvalued. On the contrary, a low ratio might suggest that Gold is undervalued relative to Silver.