The main category of Forex News.
You can use the search box below to find what you need.
[wd_asp id=1]
The main category of Forex News.
You can use the search box below to find what you need.
[wd_asp id=1]
Silver price (XAG/USD) plunges more than 1.5% to near $33.00 during North American trading hours on Friday. The white metal falls sharply from its three-week high of $33.70 posted earlier in the day. The asset weakens as investors have become increasingly confident that the United States (US) and China will make a deal sooner.
Hopes of a truce on a trade war between the world’s two largest powerhouses have increased as China has stated that it is considering suspending additional tariffs on imports of medical equipment and some industrial chemicals from the US, Bloomberg reported.
Investors see the scenario as favorable for the global economic outlook. Theoretically, improving global economic prospects diminish the demand of safe-haven assets, such as Silver.
Meanwhile, the US Dollar (USD) has bounced back after a sharp corrective move on Thursday. The US Dollar Index (DXY), which tracks the Greenback’s value against six major currencies, recovers to near 99.75.
However, contradictory statements from US President Donald Trump and China over whether both nations have come on the table or not for negotiating trade deals are expected to keep investors on the sidelines. Trump has been stating that discussion between Washington and Beijing on trade are going well, however, China has denied these remarks, saying that there has not been any “economic and trade negotiations between China and the US”.
Silver price falls sharply after posting a fresh three-week high around $33.70. However, the near-term outlook of the white metal remains bullish as it holds the 20-day Exponential Moving Average (EMA), which trades around $32.60.
The 14-day Relative Strength Index (RSI) struggles to break above 60.00. A fresh bullish momentum would emerge if the RSI will break above that level.
Looking up, the March 28 high of $34.60 will act as key resistance for the metal. On the downside, the April 11 low of $30.90 will be the key support zone.
Silver is a precious metal highly traded among investors. It has been historically used as a store of value and a medium of exchange. Although less popular than Gold, traders may turn to Silver to diversify their investment portfolio, for its intrinsic value or as a potential hedge during high-inflation periods. Investors can buy physical Silver, in coins or in bars, or trade it through vehicles such as Exchange Traded Funds, which track its price on international markets.
Silver prices can move due to a wide range of factors. Geopolitical instability or fears of a deep recession can make Silver price escalate due to its safe-haven status, although to a lesser extent than Gold’s. As a yieldless asset, Silver tends to rise with lower interest rates. Its moves also depend on how the US Dollar (USD) behaves as the asset is priced in dollars (XAG/USD). A strong Dollar tends to keep the price of Silver at bay, whereas a weaker Dollar is likely to propel prices up. Other factors such as investment demand, mining supply – Silver is much more abundant than Gold – and recycling rates can also affect prices.
Silver is widely used in industry, particularly in sectors such as electronics or solar energy, as it has one of the highest electric conductivity of all metals – more than Copper and Gold. A surge in demand can increase prices, while a decline tends to lower them. Dynamics in the US, Chinese and Indian economies can also contribute to price swings: for the US and particularly China, their big industrial sectors use Silver in various processes; in India, consumers’ demand for the precious metal for jewellery also plays a key role in setting prices.
Silver prices tend to follow Gold’s moves. When Gold prices rise, Silver typically follows suit, as their status as safe-haven assets is similar. The Gold/Silver ratio, which shows the number of ounces of Silver needed to equal the value of one ounce of Gold, may help to determine the relative valuation between both metals. Some investors may consider a high ratio as an indicator that Silver is undervalued, or Gold is overvalued. On the contrary, a low ratio might suggest that Gold is undervalued relative to Silver.
April 25, 2025 – Written by Tim Boyer
STORY LINK Pound to Dollar FX Forecast: GBPUSD “Trend Remains Bullish”
The Pound to Dollar rate found support below 1.3300 on Friday and traded around 1.3320.
UK equities were able to make further gains, potentially advancing for the 10th successive session which would be the strongest run for over five years.
Scotiabank commented on GBP/USD; “the trend remains bullish, given the sequence of higher lows and higher highs. The RSI is softening but still in bullish territory. Near-term price action appears to have settled within a range roughly bound between support in the low 1.32s and resistance above 1.3400.”
According to Credit Agricole; “GBP is starting to look expensive vs the USD. An important question for FX investors is whether the upcoming UK data releases and global developments could trigger a reversal of recent market trends in the near term.”
US data releases will also be under close scrutiny in the near term given that markets want to see whether tariffs and uncertainty have triggered an impact in the real economy.
Scotiabank commented; “Hard data reports have held up relatively well—perhaps reflecting a burst of activity before tariffs really bite—but optimism on the US economic outlook has been replaced with growing recession concerns.”
Friday’s release reported that there was a small recovery in the April University of Michigan (UoM) consumer confidence index to 52.2 from the flash reading of 50.8, but still below the March reading of 57.0. The revision was due to gains in current conditions while expectations made only a marginal recovery.

UoM surveys of Consumers Director Joanne Hsu commented; “Consumer sentiment fell for the fourth straight month, plunging 8% from March. While the April decline in current conditions was modest, the expectations index plummeted with drop-offs in personal finances as well as business conditions. Expectations have fallen a precipitous 32% since January, the steepest three-month percentage decline seen since the 1990 recession.”
ING commented; “As to the dollar more broadly, it could find a little support as trade tensions calm a little. The next big chapter here will be whether all this volatility has hit real world decisions – especially in the US jobs market. There is plenty of US jobs data released next week and any deterioration here could trigger another round of dollar losses.”
Danske Bank maintains a negative dollar stance; “Longer term, structural challenges like US political shifts, the trade war, and capital rotation away from US assets suggest significant USD downside.”
UK retail sales volumes increased 0.4% for March after a revised 0.7% gain the previous month and compared with consensus forecasts of a 0.3% decline.
According to Scotiabank; “The release is unlikely to influence policymakers ahead of the May 8 BoE rate decision, given the well communicated bias to further accommodation. Markets are pricing in 27bpts of easing for the meeting.”

International Money Transfer? Ask our resident FX expert a money transfer question or try John’s new, free, no-obligation personal service! ,where he helps every step of the way,
ensuring you get the best exchange rates on your currency requirements.
TAGS: Pound Dollar Forecasts
April 25, 2025 – Written by Tim Boyer
STORY LINK Euro to Dollar Forecast: US Equities “Could Drag EUR/USD to 1.1250”
The US Dollar has made some headway on Friday with gains against the Euro and across all other majors amid hopes that the US Administration is backing away from the more destabilising policy stance.
According to Scotiabank; “Technicals remain bullish given the clear sequence of higher lows and higher highs. The near-term range is roughly bound between support in the upper 1.12s and resistance around 1.1550.”
ING commented; “What we would say is that some further modest advance in US equities could drag EUR/USD back to the 1.1250 area.”
ING added; “it may be there – 1.1250 – where all the ‘structural’ dollar sellers could re-emerge if you believe Washington’s destruction of the rules-based international order has permanently damaged the dollar’s status as the leading reserve currency.”
Overall risk appetite has continued to settle on Friday amid hopes that the US can make headway on trade deals and, potentially, lower the temperature with China to some extent.
Recently, the dollar has tended to benefit when risk conditions improve.
ING commented; “Over recent weeks we had mentioned that an extreme 5-6% risk premium in the dollar could see EUR/USD briefly trade 1.15/16 – which we saw on Monday – but that risk premium is now starting to come out of the dollar as the mood music on trade improves and the President has backed Fed Chair Jerome Powell.”
There is still a high degree of uncertainty across the board, especially given White House spin.
MUFG remained cautious; “Even if reports are correct that there will be some easing of tariff rates, a hit to US growth is still coming that will ensure volatility levels remain higher, equity markets are pressured to the downside and the global backdrop remains unfavourable for any sustained move higher.”
According to Scotiabank; “Trade hopes spring eternal for markets but it is far from clear that there are grounds for any real optimism at this point. China is playing the long game and the position the US has left itself in suggests few will be rushing to make any concrete trade deals any time soon.”
Geo-political considerations will also be monitored closely with markets monitoring the Russia-Ukraine war developments closely.
The US is pushing for a rapid move towards a deal and any evidence of a credible ceasefire could underpin the Euro, but there are still major barriers to a deal.
As far as data is concerned, there was a small recovery in the April University of Michigan consumer confidence index to 52.2 from the flash reading of 50.8, but still below the March reading of 57.0.
The ECB policy stance has remained dovish with council member Holzmann stating that a 50 basis-point cut was possible for June.
Markets have now fully priced in a 25 basis-point cut at that meeting.
As far as the Federal Reserve is concerned, markets are pricing in a 60% chance of a June rate cut. Cleveland Fed President Hanmmack stated that a June cut was possible if there was clear and convincing data.
International Money Transfer? Ask our resident FX expert a money transfer question or try John’s new, free, no-obligation personal service! ,where he helps every step of the way,
ensuring you get the best exchange rates on your currency requirements.
TAGS: Euro Dollar Forecasts
Technically, there has been limited damage done to the bull trend so far, but there are initial signs that at least an interim high may have been reached and therefore a deeper or longer correction may have begun. The recent rapid rise in the slope of the trend is one example of how the gold rally may have reached exhaustion now that a one-day bearish signal has been confirmed. Trend indicators such as rising support trendlines and the increasing spread between the 200-Day MA (blue), 50-Day MA (orange), and 20-Day MA (purple), reflect the growing bullish momentum.
A decline below today’s low of $3,287 will give a bearish signal and put this week’s low at risk of failing. However, the first key support zone looks to be from $3,246 to $3,228, consisting of a prior trend high and 50% retracement, respectively. The top blue rising trend channel line previously represented resistance and now support since it was exceeded two weeks ago is also around that price area. Subsequently, a decline below the 50% retracement level puts gold in a position to test the next lower potential support zone around a prior trend high and 61.8% Fibonacci retracement level at $3,164.
For a look at all of today’s economic events, check out our economic calendar.
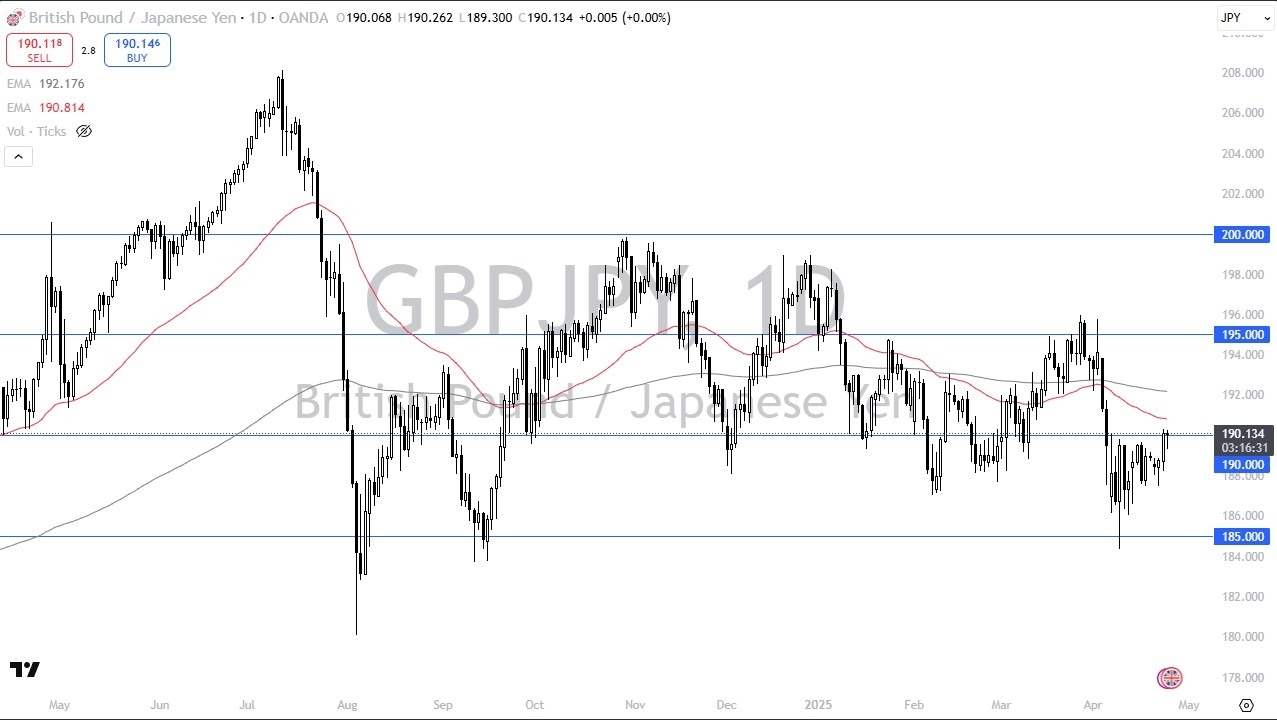
The Bank of Japan can do very little to tighten monetary policy, so the interest rate differential will continue to be quite large between these 2 currencies. If that is going to be the case, then it makes sense that the British pound continues to see success against the Japanese yen. The pair is notorious for being very volatile, and if we suddenly get a lot of risk on behavior around the world, I think that bodes quite well for higher pricing.

The technical analysis for this GBP/JPY pair is becoming more and more bullish each day, and the fact that we could not hang on to a selloff during the trading session tells me that this is a pair that is likely to continue higher given enough time. This doesn’t necessarily mean that we need to be extraordinarily explosive to the upside, but I think it does suggest that we are going higher regardless.
Short-term pullbacks continue to look like they are being bought into, with the ¥188 level being a short-term support level, as we have seen the market take off from there. The fact that we are starting to show more aggressive momentum to the upside on short-term chart suggest that we have more distance to cover in this pair, and therefore I don’t have any interest in trying to short this market, but I do think that it’s only a matter of time before we try to reach that ¥192 level.
Begin trading our daily forecasts and analysis. Here is a list of Forex brokers in Japan to work with.
The daily chart suggests ample room for additional downside movement, with the next significant support level marked at $2.199. Immediate resistance is seen at the 61.8% short-term retracement level of $2.995. A break above this could spark short-covering activity, but upside momentum would likely stall near the 50% retracement at $3.361. Until a clear reversal forms, price action remains vulnerable to further selling.
Thursday’s EIA report fueled selling after a much larger-than-expected storage build. Inventories for the week ended April 18 surged by +88 Bcf, sharply above the consensus estimate of +75 Bcf and the five-year average build of +58 Bcf. This sizable increase came even as total stocks remain -20.2% lower year-over-year and -2.3% below the five-year seasonal average, underscoring tight overall supply but overshadowed by the near-term bearish build.
Strong wind and solar generation were cited as major factors behind the weak drawdown in natural gas inventories. As renewable output expands, natural gas demand for power generation continues to face intermittent headwinds, particularly during mild weather periods. This dynamic weighed heavily on sentiment after the bearish EIA miss.
Weather forecasts through April 30 project near-ideal conditions across most of the U.S., with highs ranging from the 60s to 80s, and localized 90s across the southern states. With only light to very light national demand expected, near-term fundamentals offer little support to prices. Mild conditions reduce both heating and cooling loads, directly limiting natural gas consumption.
Given the combination of bearish EIA data, weak weather-driven demand, strong renewable generation, and bearish technical signals, the short-term outlook for natural gas remains bearish. Traders should watch the $2.906 technical level closely, but a failure to hold above it opens the door for a deeper correction toward $2.199 support.
More Information in our Economic Calendar.
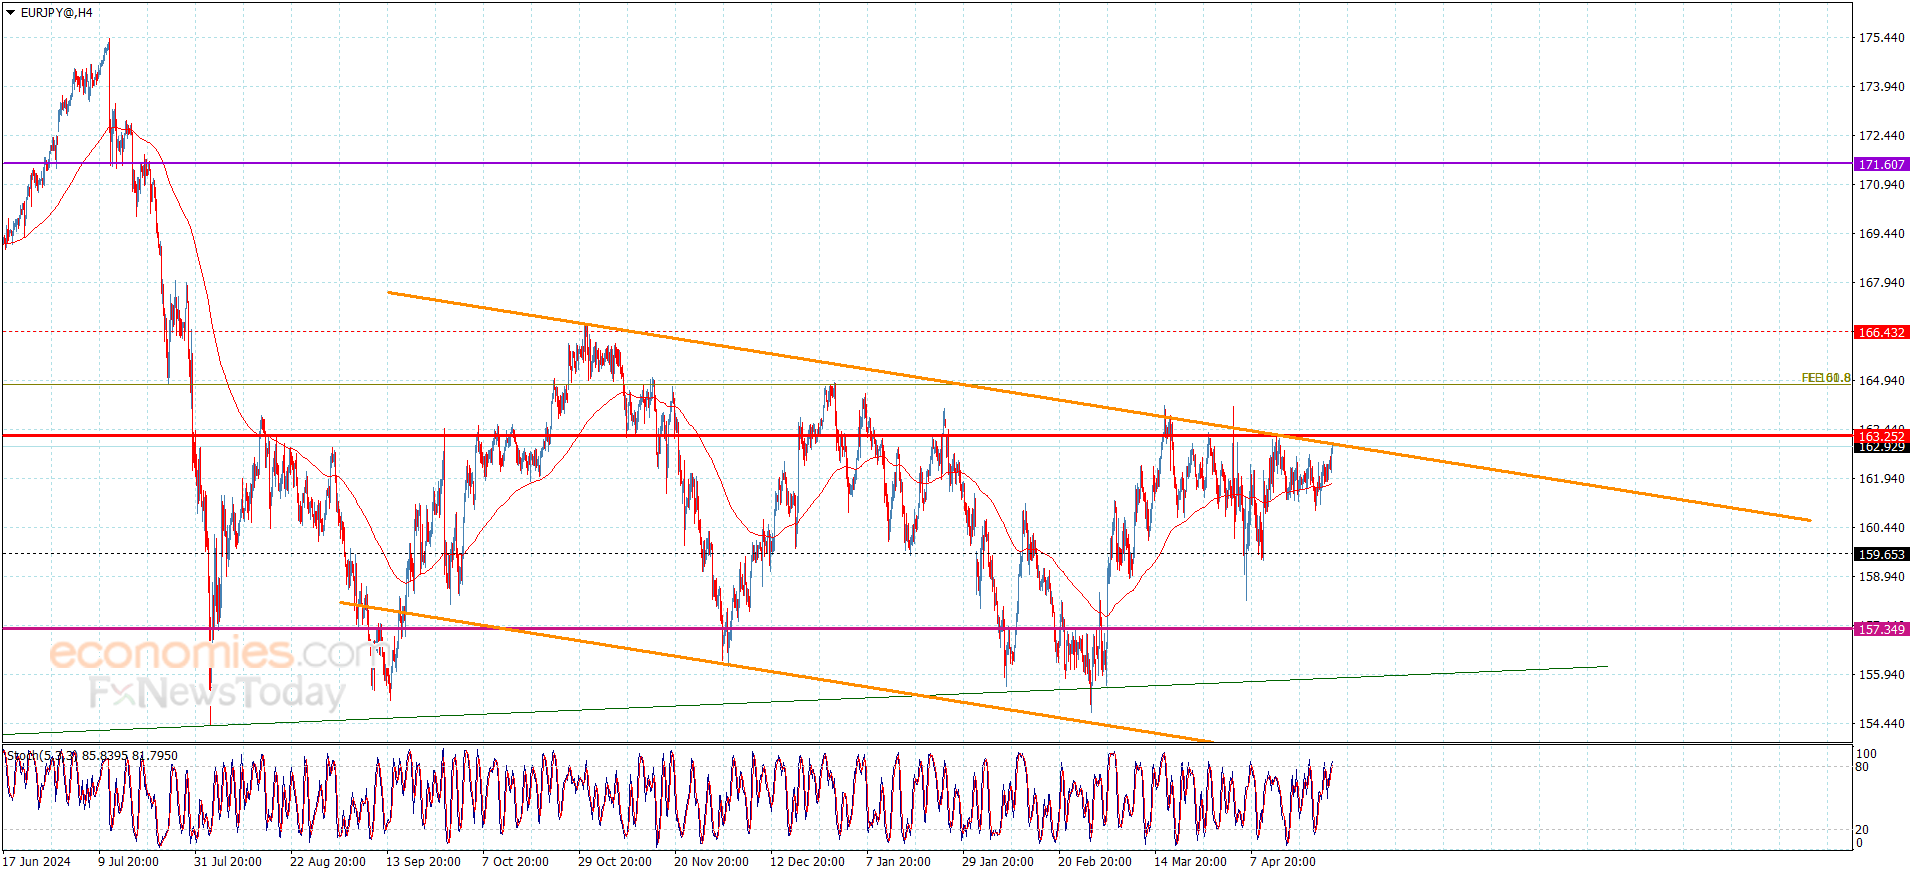
The EURJPY pair was affected by some of the positive pressures, due to the continuation of forming extra support at 161.60, and stochastic rally towards the 80 level, to notice reaching the resistance at 162.90.
We couldn’t confirm regaining the bullish bias unless surpassing the resistance and providing positive closes above 163.25 level, therefore, we will keep preferring the negative attempts in the current period, which might target the support at 161.60, while achieving the conditions of regaining the bullish bias will ease the mission of recording several gains that might begin at 164.20 and 164.90.
The expected trading range for today is between 161.60 and 163.00
Trend forecast: Bearish
Do you need help in trading decisions? Do you want to learn how to start trading?
Join Economies.com VIP Club and benefit from over 15 years of market analysis expertise and get:
Special Offer: Subscribe to the Economies.com VIP channel and get also a free subscription to a trusted trading signals channel provided by Best Trading Signal.
The EURJPY pair provided new negative closes below the moving average 55 at 161.20 level, which forces it to return to settle within the bearish channel’s levels, to begin targeting some of the negative stations by reaching 159.60.
The contradiction between the main indicators might force the price to form mixed waves, but the chances of activating the bearish track will remain valid, if the trading settled below the bearish channel’s resistance at 160.75, to expect forming an initial negative target at 158.90 level, reaching 157.40 in the near period trading.
The expected trading range for today is between 158.90 and 161.00
Trend forecast: Bearish
Do you need help in trading decisions? Do you want to learn how to start trading?
Join Economies.com VIP Club and benefit from over 15 years of market analysis expertise and get:
Special Offer: Subscribe to the Economies.com VIP channel and get also a free subscription to a trusted trading signals channel provided by Best Trading Signal.
GBP/USD stays on the back foot following Thursday’s rebound and trades slightly below 1.3300 in the European session on Friday. The renewed US Dollar (USD) strength makes it difficult for the pair to hold its ground as investors remain focused on latest developments surrounding the US-China trade relations.
The table below shows the percentage change of British Pound (GBP) against listed major currencies this week. British Pound was the weakest against the New Zealand Dollar.
| USD | EUR | GBP | JPY | CAD | AUD | NZD | CHF | |
|---|---|---|---|---|---|---|---|---|
| USD | 0.34% | -0.03% | 0.82% | 0.29% | -0.05% | -0.54% | 1.57% | |
| EUR | -0.34% | -0.52% | 0.46% | -0.09% | -0.57% | -0.90% | 1.21% | |
| GBP | 0.03% | 0.52% | 1.16% | 0.44% | -0.05% | -0.38% | 1.74% | |
| JPY | -0.82% | -0.46% | -1.16% | -0.53% | -1.00% | -1.24% | 0.77% | |
| CAD | -0.29% | 0.09% | -0.44% | 0.53% | -0.46% | -0.82% | 1.30% | |
| AUD | 0.05% | 0.57% | 0.05% | 1.00% | 0.46% | -0.32% | 1.79% | |
| NZD | 0.54% | 0.90% | 0.38% | 1.24% | 0.82% | 0.32% | 2.15% | |
| CHF | -1.57% | -1.21% | -1.74% | -0.77% | -1.30% | -1.79% | -2.15% |
The heat map shows percentage changes of major currencies against each other. The base currency is picked from the left column, while the quote currency is picked from the top row. For example, if you pick the British Pound from the left column and move along the horizontal line to the US Dollar, the percentage change displayed in the box will represent GBP (base)/USD (quote).
US President Donald Trump said late Thursday that a meeting between Chinese and US officials took place earlier in the day. During the Asian trading hours, Bloomberg reported that China was considering suspending its 125% tariff on some US imports, including medical equipment and ethane, and officials were having discussions about waiving tariffs on plane leases.
Although China’s Foreign Ministry denied the news about US and China engaging in negotiations, investors remain optimistic about a further de-escalation of tensions. Hence, the USD Index stays in positive territory above 99.60 after losing 0.5% on Thursday.
The US economic calendar will feature the University of Michigan’s revision of the April Consumer Sentiment Index, which is unlikely to trigger a market reaction. In case market mood remains upbeat heading into the weekend, GBP/USD could have a hard time gaining traction. At the time of press, US stock index futures were up between 0.1% and 0.5% on the day, pointing to a bullish opening in Wall Street.
The Relative Strength Index (RSI) indicator on the 4-hour chart moves sideways near 50, suggesting that the pair is struggling to gather directional momentum.
GBP/USD faces a critical support level at 1.3250, where the Fibonacci 23.6% retracement of the latest uptrend is located. If this support fails, additional losses toward 1.3200 (static level) and 1.3150 (Fibonacci 38.2% retracement) could be seen. On the upside, 1.3300 (static level, 20-period Simple Moving Average (SMA), 50-period SMA) aligns as first resistance ahead of 1.3340 (static level) and 1.3400-1.3410 (round level, static level).
The Pound Sterling (GBP) is the oldest currency in the world (886 AD) and the official currency of the United Kingdom. It is the fourth most traded unit for foreign exchange (FX) in the world, accounting for 12% of all transactions, averaging $630 billion a day, according to 2022 data.
Its key trading pairs are GBP/USD, also known as ‘Cable’, which accounts for 11% of FX, GBP/JPY, or the ‘Dragon’ as it is known by traders (3%), and EUR/GBP (2%). The Pound Sterling is issued by the Bank of England (BoE).
The single most important factor influencing the value of the Pound Sterling is monetary policy decided by the Bank of England. The BoE bases its decisions on whether it has achieved its primary goal of “price stability” – a steady inflation rate of around 2%. Its primary tool for achieving this is the adjustment of interest rates.
When inflation is too high, the BoE will try to rein it in by raising interest rates, making it more expensive for people and businesses to access credit. This is generally positive for GBP, as higher interest rates make the UK a more attractive place for global investors to park their money.
When inflation falls too low it is a sign economic growth is slowing. In this scenario, the BoE will consider lowering interest rates to cheapen credit so businesses will borrow more to invest in growth-generating projects.
Data releases gauge the health of the economy and can impact the value of the Pound Sterling. Indicators such as GDP, Manufacturing and Services PMIs, and employment can all influence the direction of the GBP.
A strong economy is good for Sterling. Not only does it attract more foreign investment but it may encourage the BoE to put up interest rates, which will directly strengthen GBP. Otherwise, if economic data is weak, the Pound Sterling is likely to fall.
Another significant data release for the Pound Sterling is the Trade Balance. This indicator measures the difference between what a country earns from its exports and what it spends on imports over a given period.
If a country produces highly sought-after exports, its currency will benefit purely from the extra demand created from foreign buyers seeking to purchase these goods. Therefore, a positive net Trade Balance strengthens a currency and vice versa for a negative balance.
Gold price declined in its last intraday trading, to surpass the support of its EMA50, its positive chances with the emergence of the negative signals on the (RSI), to lean on a minor bullish bias line on the short-term basis, accompanied by its stability at the key support level at$3,290.
Therefore, the stability of the support at $3,290 makes our expectations prefer moving upside in the gold price’s upcoming intraday trading, to target the resistance $3,400, while breaking this support will change our overview to the negativity to target the support level at$3,200.
The expected trading range for today is between $3,255 support and $3,365 resistance
Today’s forecast: Neutral
Do you need help in trading decisions? Do you want to learn how to start trading?
Join Economies.com VIP Club and benefit from over 15 years of market analysis expertise and get:
Special Offer: Subscribe to the Economies.com VIP channel and get also a free subscription to a trusted trading signals channel provided by Best Trading Signal.