The main category of Forex News.
You can use the search box below to find what you need.
[wd_asp id=1]
The main category of Forex News.
You can use the search box below to find what you need.
[wd_asp id=1]
Gold price declined in its last intraday trading, to surpass the support of its EMA50, its positive chances with the emergence of the negative signals on the (RSI), to lean on a minor bullish bias line on the short-term basis, accompanied by its stability at the key support level at$3,290.
Therefore, the stability of the support at $3,290 makes our expectations prefer moving upside in the gold price’s upcoming intraday trading, to target the resistance $3,400, while breaking this support will change our overview to the negativity to target the support level at$3,200.
The expected trading range for today is between $3,255 support and $3,365 resistance
Today’s forecast: Neutral
Do you need help in trading decisions? Do you want to learn how to start trading?
Join Economies.com VIP Club and benefit from over 15 years of market analysis expertise and get:
Special Offer: Subscribe to the Economies.com VIP channel and get also a free subscription to a trusted trading signals channel provided by Best Trading Signal.
The USD/JPY price analysis indicates accelerating price pressures in Japan, which may prompt the Bank of Japan to raise rates. However, policymakers remain concerned about the economic impacts of Trump’s tariffs. Meanwhile, easing trade tensions between China and the US supported the dollar.
-Are you interested in learning about the forex indicators? Click here for details-
The yen strengthened briefly on Friday after data revealed that inflation in Tokyo beat estimates. The CPI increased by 3.4%, above forecasts of a 3.2% increase. Moreover, it recorded a massive jump from the previous reading of 2.4%. Accelerating inflation aligns with the BoJ’s recent message of more rate hikes. However, Trump’s tariffs have created uncertainty about the timing of the timing of the next move.
On the other hand, the dollar regained its appeal as trade tensions between China and the US eased. Both countries appear ready to lower tariffs and begin negotiations. The US has said it can lower tariffs on Chinese goods to 50%. Meanwhile, China is ready to exempt some US goods from tariffs. A deal to end the trade war would boost the dollar and ease economic worries. Meanwhile, the yen might lose its safe-haven appeal and drop.
Traders do not expect any high-impact economic releases from the US or Japan. Therefore, they will keep watching trade war developments.

On the technical side, the USD/JPY price has broken out of its bearish channel. Immediately after the breakout, the price pulled back to retest the channel resistance and is now climbing higher. The channel breakout indicates a bullish shift in sentiment. The price now trades above the 30-SMA, and the RSI is above 50. Therefore, the bullish bias is strong.
–Are you interested in learning more about British Trade Platform Review? Check our detailed guide-
Bears had a strong lead, maintaining a downtrend, with the price mostly below the 30-SMA. However, they could not go past the 140.01 support level. Consequently, bulls took over by pushing the price above the SMA and past the channel resistance.
Given the strong bullish bias, USD/JPY could soon retest the 145.02 resistance level. A break above this level will confirm a new uptrend.
Looking to trade forex now? Invest at eToro!
75% of retail investor accounts lose money when trading CFDs with this provider. You should consider whether you can afford to take the high risk of losing your money.
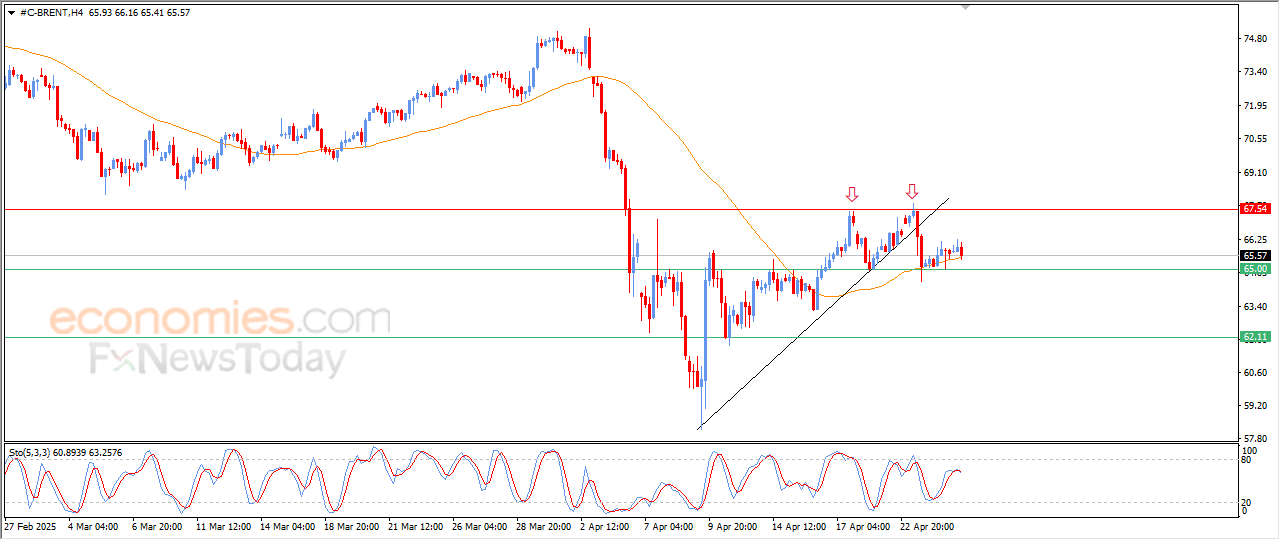
Crude oil prices rose slightly in its recent intraday trading, taking advantage of the temporary positive momentum that is caused by its stability above EMA50, to compensate for some of its previous losses.
Despite this intraday rise, the negative pressures remain valid, due to the price affection by the formed negative rising wedge pattern on the short- term basis, besides the emergence of the negative overlapping signals on (RSI), after entering overbought areas, which reinforces the possibilities of renewing the selling pressures.
Therefore, our expectations suggest (crude oil) decline in its upcoming intraday trading, if it remains stable below $63.20, to target the support at $61.50, preparing to break below it.
The expected trading range is between $64.40 support and $66.90 resistance.
Today’s forecast: Bearish
Do you need help in trading decisions? Do you want to learn how to start trading?
Join Economies.com VIP Club and benefit from over 15 years of market analysis expertise and get:
Special Offer: Subscribe to the Economies.com VIP channel and get also a free subscription to a trusted trading signals channel provided by Best Trading Signal.
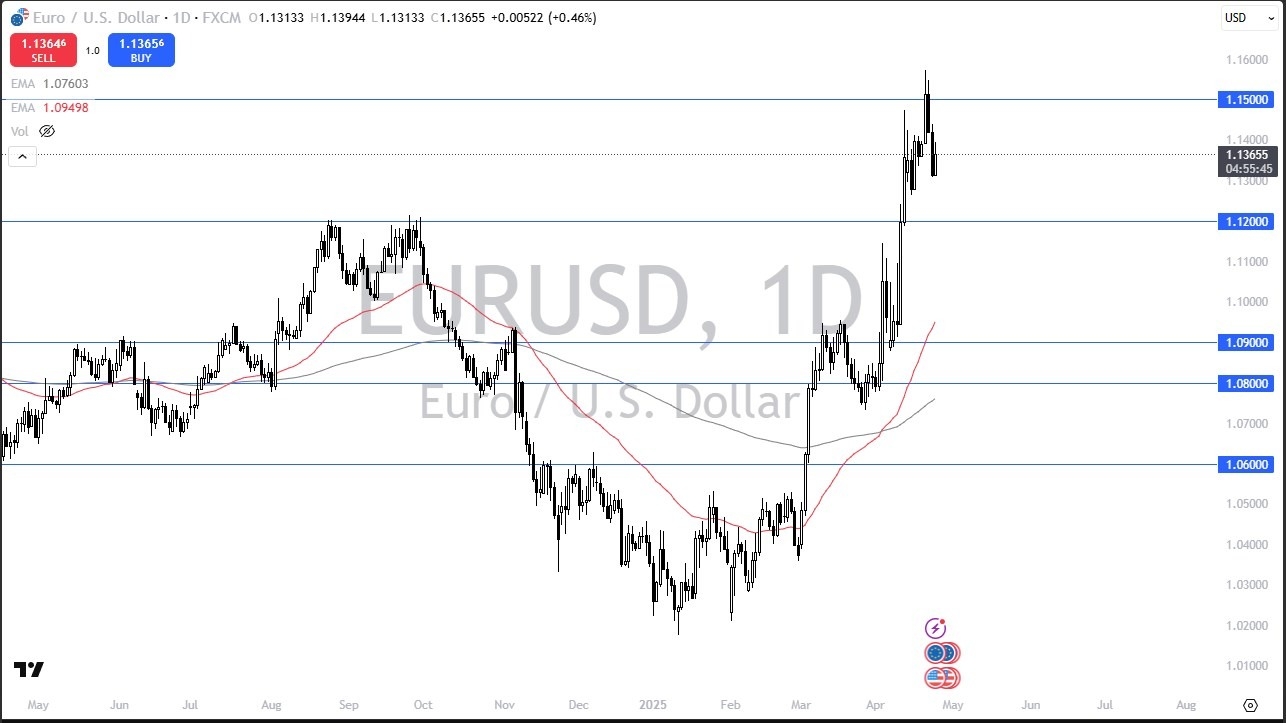
I do think that the range could be between 1.12 and 1.15, but that of course remains to be seen. We’ll just have to wait to see how that plays out. I certainly think that it’s hard to short this pair, although the US dollar is most certainly oversold. This is true not only here, but many other currency pairs as well.

The reality is this is a market that will continue to be very noisy and front and center in the sense that the trade talks between the United States and Europe haven’t progressed yet. If and when they do, it’ll be interesting to see how that plays out here, mainly due to the fact that Germany is pulling out of a recession and there is talk at least of the United States heading into one. So interesting days we live in right now.
I think ultimately you have a situation where traders will look at this through the prism of perhaps trying to take advantage of a range in the short term. But if we were to break down below the 1.12 level, that could change a lot of things for a lot of people. We’ll just have to wait and see. I’m pretty neutral at the moment. I do think that we’ve got some work to do. If nothing else, we’ve got to work off some of this excess fraud.
Ready to trade our EUR/USD daily forecast? Here’s a list of some of the top forex brokers in Europe to check out.
Silver (XAG/USD) edges lower after testing the three-week top during the Asian session on Friday and currently trades around the mid-$33.00s, down 0.30% for the day. The technical setup, however, warrants caution before positioning for any meaningful depreciating move.
This week’s breakout above the $33.00 round figure, representing the top end of a multi-day-old range and the 61.8% Fibonacci retracement level of the March-April downfall, was seen as a key trigger for bullish traders. Moreover, oscillators on the daily chart have been gaining positive traction and are still far from being in the overbought territory. This, in turn, suggests that the path of least resistance for the XAG/USD is to the upside.
Hence, any subsequent slide might still be seen as a buying opportunity near the $33.00 hurdle breakpoint, now turned support. A convincing break below the said handle might prompt some technical selling and drag the XAG/USD further toward the $32.40 support en route to the $32.10-$32.00 area. Some follow-through selling will suggest that the recent recovery from the $28.00 mark, or the year-to-date low, has run out of steam.
On the flip side, the $33.70 area now seems to have emerged as an immediate hurdle, above which the XAG/USD could aim to reclaim the $34.00 mark. The momentum could extend further towards the $34.30 intermediate resistance en route to the next relevant barrier near the $34.55-$34.60 region, or the highest level since October 2024 touched last month. The white metal could eventually aim to conquer the $35.00 psychological mark.
Silver is a precious metal highly traded among investors. It has been historically used as a store of value and a medium of exchange. Although less popular than Gold, traders may turn to Silver to diversify their investment portfolio, for its intrinsic value or as a potential hedge during high-inflation periods. Investors can buy physical Silver, in coins or in bars, or trade it through vehicles such as Exchange Traded Funds, which track its price on international markets.
Silver prices can move due to a wide range of factors. Geopolitical instability or fears of a deep recession can make Silver price escalate due to its safe-haven status, although to a lesser extent than Gold’s. As a yieldless asset, Silver tends to rise with lower interest rates. Its moves also depend on how the US Dollar (USD) behaves as the asset is priced in dollars (XAG/USD). A strong Dollar tends to keep the price of Silver at bay, whereas a weaker Dollar is likely to propel prices up. Other factors such as investment demand, mining supply – Silver is much more abundant than Gold – and recycling rates can also affect prices.
Silver is widely used in industry, particularly in sectors such as electronics or solar energy, as it has one of the highest electric conductivity of all metals – more than Copper and Gold. A surge in demand can increase prices, while a decline tends to lower them. Dynamics in the US, Chinese and Indian economies can also contribute to price swings: for the US and particularly China, their big industrial sectors use Silver in various processes; in India, consumers’ demand for the precious metal for jewellery also plays a key role in setting prices.
Silver prices tend to follow Gold’s moves. When Gold prices rise, Silver typically follows suit, as their status as safe-haven assets is similar. The Gold/Silver ratio, which shows the number of ounces of Silver needed to equal the value of one ounce of Gold, may help to determine the relative valuation between both metals. Some investors may consider a high ratio as an indicator that Silver is undervalued, or Gold is overvalued. On the contrary, a low ratio might suggest that Gold is undervalued relative to Silver.
Gold price rose in its recent intraday trading, taking advantage of the bullish trend domination on the short-term basis, where the price moves along minor positive line, reinforcing its gains by a clear support from its stability above EMA50.
The positive momentum was supported by the continuation of the positive signals emergence on the (RSI), which confirms the strength of the current pressures towards the upside.
Therefore, the positive scenario remains preferred as long as the price settled above $3,290 support, to target the main resistance at $3,400, if the price managed to surpass this resistance we might witness recording new highs.
The expected trading range is between $3,290 support and $3,400 resistance.
Today’s forecast: Bullish
Do you need help in trading decisions? Do you want to learn how to start trading?
Join Economies.com VIP Club and benefit from over 15 years of market analysis expertise and get:
Special Offer: Subscribe to the Economies.com VIP channel and get also a free subscription to a trusted trading signals channel provided by Best Trading Signal.
Gold price holds Thursday’s rebound, defending weekly gains near $3,350 early Friday. Gold buyers catch a breather, taking stock of the trade developments globally after US President Donald Trump’s tariffs whiplash.
This Friday, the US Dollar (USD) sees fresh signs of life as risk sentiment remains upbeat on optimism for trade deals. Reuters reported that the Trump administration seems to be progressing in early trade talks with Asian allies South Korea and Japan.
On Thursday, Seoul’s delegation said that both sides aim to craft a trade package before the pause on reciprocal tariffs is lifted in July. Meanwhile, Japanese Finance Minister Kato Katsunobu held talks with US Treasury Secretary Scott Bessent in Washington on Thursday, noting that Bessent did not raise the Yen’s level in bilateral talks.
In evidence of further progress, Japan’s chief negotiator, Economy Minister Ryosei Akazawa, will hold a second round of trade talks with Bessent next week.
Receding recession fears, following encouraging earnings reports from American tech giants, offer some respite to the beleaguered US Dollar. Shares of Google parent Alphabet jumped over 3% in after-hours after its first-quarter earnings beat analysts’ expectations.
The resurgent US Dollar demand and trade deal hopes heading into the weekend limit the Gold price upswing. The US Federal Reserve (Fed) officials’ cautious stance on revising the policy, as they continue to assess the impact of Trump’s tariffs on the economy and inflation prospects, acts as a headwind for the recent upswing in Gold price.
However, Gold buyers remain hopeful amid a lack of certainty on the US-China trade talks front.
Looking ahead, traders will pay close attention to any trade-related headlines from the White House or US President Trump for fresh cues on the Gold price action. The end-of-the-week flows will also emerge as one of the forces behind the Gold and the US Dollar movement later in the day.
The short-term technical outlook for the Gold price remains constructive as the 14-day Relative Strength Index (RSI) holds firm above the midline, currently near 65.
Gold price must find acceptance above the $3,400 threshold for resuming the uptrend toward the record highs of $3,500. Further up, the rising trendline resistance at $3,583 will come into play.
If the upside loses traction, a 21-day Simple Moving Average (SMA) test at $3,175 will be inevitable on a sustained move below Wednesday’s low of $3,260.
The line in the sand for Gold buyers is seen at the $3,200 barrier.
Gold has played a key role in human’s history as it has been widely used as a store of value and medium of exchange. Currently, apart from its shine and usage for jewelry, the precious metal is widely seen as a safe-haven asset, meaning that it is considered a good investment during turbulent times. Gold is also widely seen as a hedge against inflation and against depreciating currencies as it doesn’t rely on any specific issuer or government.
Central banks are the biggest Gold holders. In their aim to support their currencies in turbulent times, central banks tend to diversify their reserves and buy Gold to improve the perceived strength of the economy and the currency. High Gold reserves can be a source of trust for a country’s solvency. Central banks added 1,136 tonnes of Gold worth around $70 billion to their reserves in 2022, according to data from the World Gold Council. This is the highest yearly purchase since records began. Central banks from emerging economies such as China, India and Turkey are quickly increasing their Gold reserves.
Gold has an inverse correlation with the US Dollar and US Treasuries, which are both major reserve and safe-haven assets. When the Dollar depreciates, Gold tends to rise, enabling investors and central banks to diversify their assets in turbulent times. Gold is also inversely correlated with risk assets. A rally in the stock market tends to weaken Gold price, while sell-offs in riskier markets tend to favor the precious metal.
The price can move due to a wide range of factors. Geopolitical instability or fears of a deep recession can quickly make Gold price escalate due to its safe-haven status. As a yield-less asset, Gold tends to rise with lower interest rates, while higher cost of money usually weighs down on the yellow metal. Still, most moves depend on how the US Dollar (USD) behaves as the asset is priced in dollars (XAU/USD). A strong Dollar tends to keep the price of Gold controlled, whereas a weaker Dollar is likely to push Gold prices up.
EUR/JPY extends its gains for the third successive session, trading around 162.80 during the Asian hours on Friday. Technical analysis of the daily chart shows the currency cross consolidating within an ascending channel, reinforcing a bullish outlook.
Moreover, the 14-day Relative Strength Index (RSI) holds above the 50 mark, reinforcing the bullish bias. The currency cross also trades above the nine-day Exponential Moving Average (EMA), indicating solid short-term momentum and the potential for continued upside.
On the upside, the EUR/JPY cross may face initial resistance at the “pullback resistance” near the 164.50 level. If this is surpassed, the next significant obstacle is at 166.69, which marks a nine-month high last seen in October 2024. A break above this level could open the doors for the currency cross to explore the region around the upper boundary of the ascending channel near the 169.00 level.
The EUR/JPY cross could encounter initial support at the nine-day EMA around 162.20, followed by the 50-day EMA at 161.34. A break below these levels might weaken the short- and medium-term price momentum, potentially applying downward pressure to test the lower boundary of the ascending channel at 160.50. A further decline could bring the currency cross to its two-month low of 155.59, recorded on March 4, followed by 154.41, its lowest level since December 2023.
The table below shows the percentage change of Euro (EUR) against listed major currencies today. Euro was the strongest against the Japanese Yen.
| USD | EUR | GBP | JPY | CAD | AUD | NZD | CHF | |
|---|---|---|---|---|---|---|---|---|
| USD | 0.52% | 0.41% | 0.73% | 0.14% | 0.02% | 0.22% | 0.63% | |
| EUR | -0.52% | -0.12% | 0.23% | -0.40% | -0.50% | -0.29% | 0.10% | |
| GBP | -0.41% | 0.12% | 0.34% | -0.27% | -0.38% | -0.19% | 0.18% | |
| JPY | -0.73% | -0.23% | -0.34% | -0.59% | -0.73% | -0.55% | -0.16% | |
| CAD | -0.14% | 0.40% | 0.27% | 0.59% | -0.21% | 0.07% | 0.46% | |
| AUD | -0.02% | 0.50% | 0.38% | 0.73% | 0.21% | 0.21% | 0.58% | |
| NZD | -0.22% | 0.29% | 0.19% | 0.55% | -0.07% | -0.21% | 0.37% | |
| CHF | -0.63% | -0.10% | -0.18% | 0.16% | -0.46% | -0.58% | -0.37% |
The heat map shows percentage changes of major currencies against each other. The base currency is picked from the left column, while the quote currency is picked from the top row. For example, if you pick the Euro from the left column and move along the horizontal line to the US Dollar, the percentage change displayed in the box will represent EUR (base)/USD (quote).
Silver finished Thursday’s session virtually unchanged, yet it remains near weekly highs of $33.65, with traders poised to push the grey metal higher.
An improvement in risk appetite was sponsored by a de-escalation of US President Donald Trump’s tariffs on China, which weighed on silver prices. However, China’s Commerce Ministry Spokesman urged the US to lift all duties on Chinese imports “if it really wants to solve the problem.”
Precious metals remain underpinned by the fall of US Treasury yields. This consequently weakened the Greenback, which, according to the US Dollar Index (DXY), dropped 0.50% down to 99.28.
US economic data showed the labor market remains solid following the release of the latest Initial Jobless Claims figures, which came in aligned with estimates. US Durable Goods Orders smashed forecasts of 2% in March and grew 9.2% Month over Month due to a jump in transportation orders.
A myriad of Fed speakers led by Governor Waller grabbed the headlines. Waller said that it is unlikely to know the impact of tariffs in July, adding that the second half of 2025 will bring more clarity. Cleveland Fed Beth Hammack said that uncertainty is weighing on businesses, and if data warrants it, the Fed’s next move could be in June.
Amid this backdrop, Silver could remain trading near the week’s high but buyers need to clear key resistance levels. the first ceiling would be $34.00, followed by the current year-to-date (YTD) high of $34.58. Once those two levels are taken out, traders could target the $35.00 mark.
Conversely, if XAG/USD falls below $33.00, sellers will be tempted to test the 50-day Simple Moving Average (SMA) at $32.63. Once cleared, the next support would be $32.00.
Silver is a precious metal highly traded among investors. It has been historically used as a store of value and a medium of exchange. Although less popular than Gold, traders may turn to Silver to diversify their investment portfolio, for its intrinsic value or as a potential hedge during high-inflation periods. Investors can buy physical Silver, in coins or in bars, or trade it through vehicles such as Exchange Traded Funds, which track its price on international markets.
Silver prices can move due to a wide range of factors. Geopolitical instability or fears of a deep recession can make Silver price escalate due to its safe-haven status, although to a lesser extent than Gold’s. As a yieldless asset, Silver tends to rise with lower interest rates. Its moves also depend on how the US Dollar (USD) behaves as the asset is priced in dollars (XAG/USD). A strong Dollar tends to keep the price of Silver at bay, whereas a weaker Dollar is likely to propel prices up. Other factors such as investment demand, mining supply – Silver is much more abundant than Gold – and recycling rates can also affect prices.
Silver is widely used in industry, particularly in sectors such as electronics or solar energy, as it has one of the highest electric conductivity of all metals – more than Copper and Gold. A surge in demand can increase prices, while a decline tends to lower them. Dynamics in the US, Chinese and Indian economies can also contribute to price swings: for the US and particularly China, their big industrial sectors use Silver in various processes; in India, consumers’ demand for the precious metal for jewellery also plays a key role in setting prices.
Silver prices tend to follow Gold’s moves. When Gold prices rise, Silver typically follows suit, as their status as safe-haven assets is similar. The Gold/Silver ratio, which shows the number of ounces of Silver needed to equal the value of one ounce of Gold, may help to determine the relative valuation between both metals. Some investors may consider a high ratio as an indicator that Silver is undervalued, or Gold is overvalued. On the contrary, a low ratio might suggest that Gold is undervalued relative to Silver.
Today, Thursday, crude oil consolidated forming an inside day with a high of $63.73 and low at $62.40. There are a couple indications of weakness provided from the day. Notice that the day’s range is in the lower half of Wednesday’s range, and at the time of this writing, crude oil is trading below the halfway point of the range and looks likely to close in a similar relatively bearish position. Moreover, the high for the day found resistance at a significant price level from May 2023 (dashed horizontal). That was the lowest traded price for crude oil until the recent sharp fall.
A decline below today’s low provides the next sign of weakening, while a deeper bearish retracement is signaled on a drop below Wednesday’s low of $61.94. Notice that there is also a small rising trend line across the bottom of recent price action. That line will already be broken if Wednesday’s low is triggered. If the decline is triggered there are two key areas to watch for support. The first is at a recent interim swing low of $60.40 and the 50% retracement at $60.27. Then, further down is a range from $59.08 to $58.86, defined by the 61.8% Fibonacci retracement and prior daily support, respectively.
There is one more day to the week with crude oil set to establish a second consecutive higher weekly high and higher weekly low. It reflects short term strength. But bearish price action following this week’s high puts crude oil in a position to end lower for the period and likely below last week’s high of $64.72. Therefore, the upside weekly breakout would not be confirmed on that time frame.
For a look at all of today’s economic events, check out our economic calendar.