The main category of Forex News.
You can use the search box below to find what you need.
[wd_asp id=1]
The main category of Forex News.
You can use the search box below to find what you need.
[wd_asp id=1]
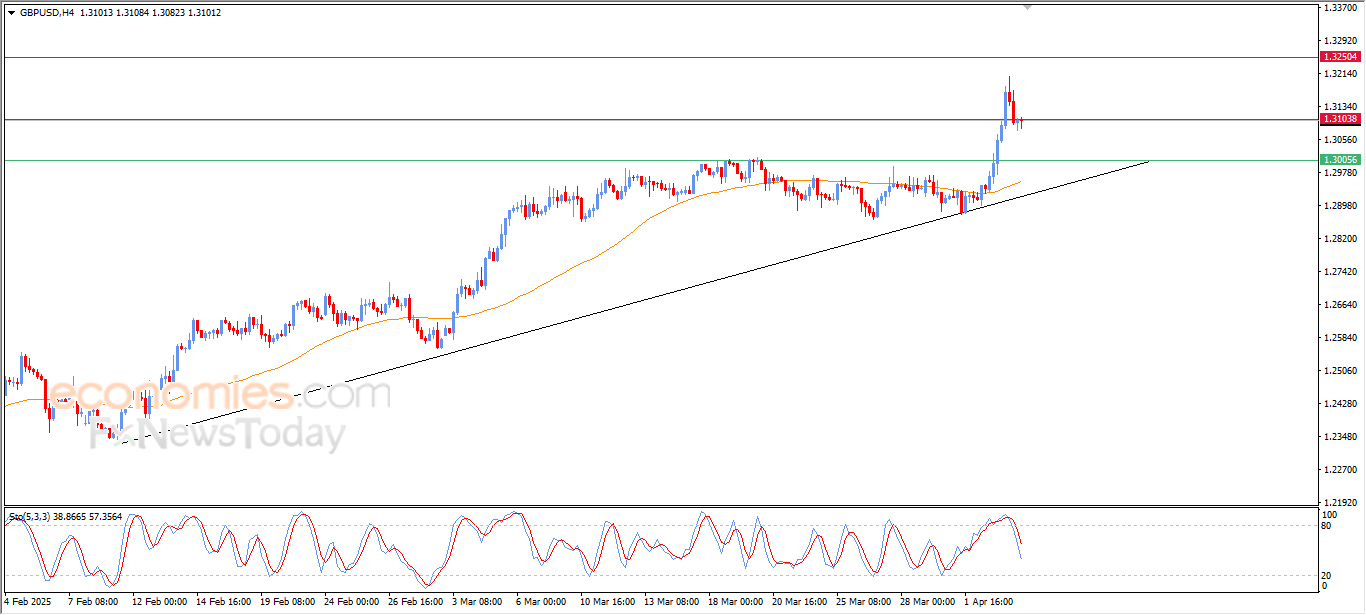
GBP/USD climbed above 1.3200 for the first time since early October on Thursday but erased a portion of its daily gains later in the American session. The pair stays under bearish pressure in the European session on Friday and trades below 1.3000.
The table below shows the percentage change of British Pound (GBP) against listed major currencies this week. British Pound was the strongest against the Australian Dollar.
| USD | EUR | GBP | JPY | CAD | AUD | NZD | CHF | |
|---|---|---|---|---|---|---|---|---|
| USD | -1.52% | -0.35% | -2.30% | -1.23% | 1.32% | 0.51% | -2.84% | |
| EUR | 1.52% | 1.30% | -0.76% | 0.34% | 2.97% | 2.11% | -1.29% | |
| GBP | 0.35% | -1.30% | -2.05% | -0.90% | 1.65% | 0.83% | -2.50% | |
| JPY | 2.30% | 0.76% | 2.05% | 1.09% | 3.75% | 2.92% | -0.63% | |
| CAD | 1.23% | -0.34% | 0.90% | -1.09% | 2.61% | 1.77% | -1.62% | |
| AUD | -1.32% | -2.97% | -1.65% | -3.75% | -2.61% | -0.81% | -4.12% | |
| NZD | -0.51% | -2.11% | -0.83% | -2.92% | -1.77% | 0.81% | -3.33% | |
| CHF | 2.84% | 1.29% | 2.50% | 0.63% | 1.62% | 4.12% | 3.33% |
The heat map shows percentage changes of major currencies against each other. The base currency is picked from the left column, while the quote currency is picked from the top row. For example, if you pick the British Pound from the left column and move along the horizontal line to the US Dollar, the percentage change displayed in the box will represent GBP (base)/USD (quote).
The broad-based selling pressure surrounding the US Dollar (USD) fuelled GBP/USD rally on Thursday. US President Donald Trump’s aggressive tariffs fed into fears of an economic downturn in the US, forcing the USD to weaken against its peers.
As markets remain risk-averse on Friday, GBP/USD finds it difficult to hold its ground. At the time of press, the UK’s FTSE 100 Index was down nearly 1.5% on the day and US stock index futures were losing between 0.3% and 0.9%.
Later in the day, the US economic calendar will feature the March employment report, which will feature Nonfarm Payrolls (NFP), Unemployment Rate and wage inflation figures.
Markets forecast an increase of 135,000 in NFP in March. A significant negative surprise, with an NFP reading at or below 100,000, could weigh on the USD and help GBP/USD find support. Conversely, an NFP print of 160,000 or higher could have the opposite impact on the pair’s action with the immediate reaction.
Ahead of the weekend, Federal Reserve (Fed) Chairman Jerome Powell will speak on the US economic outlook at the annual conference for the Society for Advancing Business Editing and Writing. Powell will also attend a moderated panel discussion afterward.
In case Powell voices his concerns over the growth outlook, citing the new tariff regime, the USD could come under renewed selling pressure. On the other hand, the USD could end the week on a bullish note if Powell puts more emphasis on the upside risks to inflation outlook and reiterates their willingness to remain patient with regard to further policy easing.
According to the CME FedWatch Tool, investors are currently pricing in about a 32% probability of a 25 basis points Fed rate cut in May. The market positioning suggests that the USD has room on the upside if Powell’s remarks revive expectations for a policy hold at the next meeting.
The Relative Strength Index (RSI) indicator on the 4-hour chart dropped below 50, reflecting a bearish tilt in the short-term outlook.
On the downside, 1.2960 (100-period Simple Moving Average (SMA), 50-period SMA) aligns as first support before 1.2935 (lower limit of the ascending channel) and 1.2900 (static level, round level).
In case GBP/USD reclaims 1.3000 (round level, static level), technical buyers could take action. In this scenario, 1.3080 (mid-point of the ascending channel) and 1.3100 (round level, static level) could be seen as next resistance levels.
Tariffs are customs duties levied on certain merchandise imports or a category of products. Tariffs are designed to help local producers and manufacturers be more competitive in the market by providing a price advantage over similar goods that can be imported. Tariffs are widely used as tools of protectionism, along with trade barriers and import quotas.
Although tariffs and taxes both generate government revenue to fund public goods and services, they have several distinctions. Tariffs are prepaid at the port of entry, while taxes are paid at the time of purchase. Taxes are imposed on individual taxpayers and businesses, while tariffs are paid by importers.
There are two schools of thought among economists regarding the usage of tariffs. While some argue that tariffs are necessary to protect domestic industries and address trade imbalances, others see them as a harmful tool that could potentially drive prices higher over the long term and lead to a damaging trade war by encouraging tit-for-tat tariffs.
During the run-up to the presidential election in November 2024, Donald Trump made it clear that he intends to use tariffs to support the US economy and American producers. In 2024, Mexico, China and Canada accounted for 42% of total US imports. In this period, Mexico stood out as the top exporter with $466.6 billion, according to the US Census Bureau. Hence, Trump wants to focus on these three nations when imposing tariffs. He also plans to use the revenue generated through tariffs to lower personal income taxes.
Copper price gave in to negative pressures and fell below the stable support of $4.8100, and hesitantly approached $4.7400, delaying any attempts at rising even as the price remains within an ascending channel.
As the $5.000 forms as a barrier and negative signals emerge from the Stochastic, the price will likely head towards $4.6500 then $4.5600.
Expected trading range today is between $4.6500 and $4.9500.
Today’s price forecast: Bearish
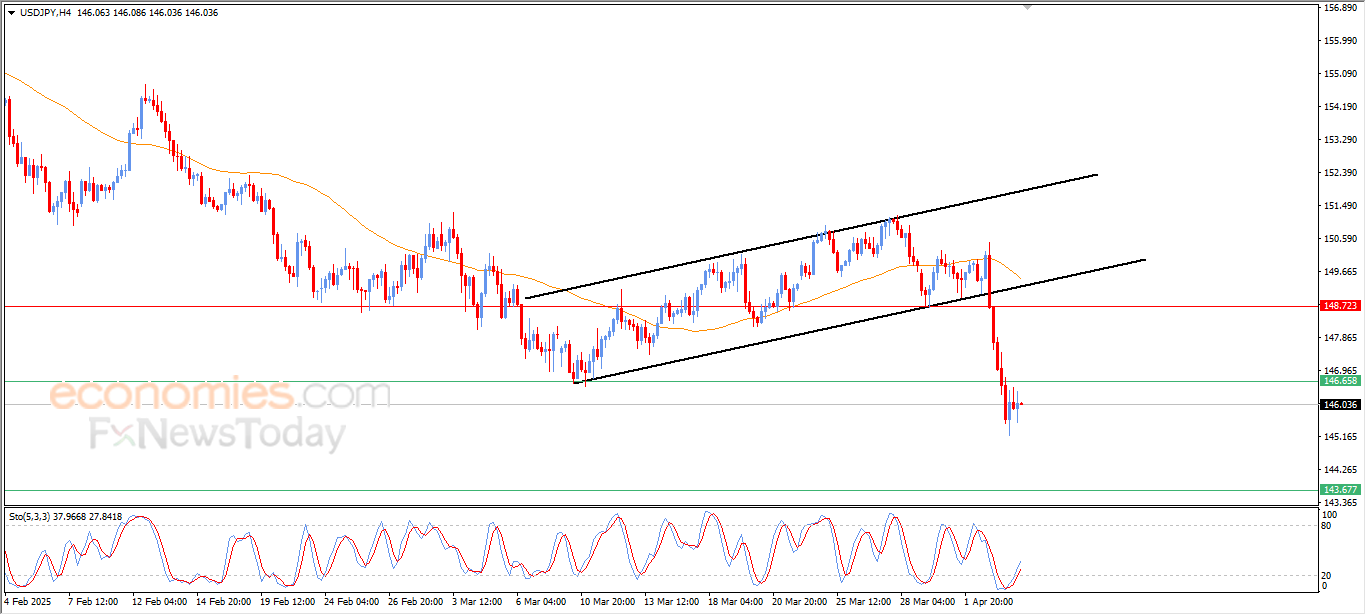
USD/JPY edged higher in latest intraday trading while trying to recoup some recent losses, as the price also tried to vent off oversold saturation in the Stochastic with positive signals emerging from it.
It comes as the price settles below the pivotal support of 146.65 that was breached yesterday, while hurt by exiting an ascending correctional price channel previously, with the dominance of the main downward trend.
To get our more detailed analysis and 100% accurate signals provided by Best Trading Signal, subscribe to Economies.com VIP Club through the link below!
North America Platinum Prices Movement Last Quarter:
Platinum Prices in United States:
The U.S. platinum prices recorded a sharp surge during the fourth quarter, standing at 995 USD/MT in the last quarter of 2024, owing to a mix of robust industry consumption and supply-side constraints. The Platinum Price rise was mainly triggered by increased use in healthcare and electronics industries, where producers accelerated purchases to compensate for growing customer demands. Seasonal stockpiling before the holiday season also placed upward pressure on the Platinum Price Index.
Moreover, supply disruption due to logistical issues and increasing raw material prices further aided the price surge. Although there was a minor slowdown in manufacturing activity in the closing stages of the quarter, upbeat market mood sustained the Platinum Price Trend. In the future, the Platinum Price Forecast is positive, indicating sustained demand and constrained supply conditions.
Get the Real-Time Prices Analysis: https://www.imarcgroup.com/platinum-pricing-report/requestsample
Note: The analysis can be tailored to align with the customer’s specific needs.
Factors Affecting Platinum Prices and Demand:
Several predominant factors influence Platinum prices and demand, such as industrial consumption, supply shortages, and global economic stability. Platinum is extensively utilized in the automobile, healthcare, and electronics industries, which makes its demand follow the production output of these industries. Supply shortfalls typically ensue from disturbances in the primary mining areas, particularly South Africa and Russia, causing prices to rise.
Also, changes in investor sentiment, currency movements, and geopolitical tensions can affect the Platinum Price Index. Environmental controls and the move towards cleaner technologies also increasingly influence the Platinum Price Trend and upcoming Platinum Price Forecast.
Speak to An Analyst: https://www.imarcgroup.com/request?type=report&id=23767&flag=C
Key Coverage:
• Market Analysis
• Market Breakup by Region
• Demand Supply Analysis by Type
• Demand Supply Analysis by Application
• Demand Supply Analysis of Raw Materials
• Price Analysis
o Spot Prices by Major Ports
o Price Breakup
o Price Trends by Region
o Factors influencing the Price Trends
• Market Drivers, Restraints, and Opportunities
• Competitive Landscape
• Recent Developments
• Global Event Analysis
How IMARC Pricing Database Can Help
The latest IMARC Group study, “Platinum Prices, Trend, Chart, Demand, Market Analysis, News, Historical and Forecast Data 2025 Edition,” presents a detailed analysis of Platinum price trend, offering key insights into global Platinum market dynamics. This report includes comprehensive price charts, which trace historical data and highlights major shifts in the market.
The analysis delves into the factors driving these trends, including raw material costs, production fluctuations, and geopolitical influences. Moreover, the report examines Platinum demand, illustrating how consumer behaviour and industrial needs affect overall market dynamics. By exploring the intricate relationship between supply and demand, the prices report uncovers critical factors influencing current and future prices.
About Us:
IMARC Group is a global management consulting firm that provides a comprehensive suite of services to support market entry and expansion efforts. The company offers detailed market assessments, feasibility studies, regulatory approvals and licensing support, and pricing analysis, including spot pricing and regional price trends. Its expertise spans demand-supply analysis alongside regional insights covering Asia-Pacific, Europe, North America, Latin America, and the Middle East and Africa. IMARC also specializes in competitive landscape evaluations, profiling key market players, and conducting research into market drivers, restraints, and opportunities. IMARC’s data-driven approach helps businesses navigate complex markets with precision and confidence.
Contact us:
IMARC Group
134 N 4th St. Brooklyn, NY 11249, USA
Email: sales@imarcgroup.com
Tel No: (D) +91 120 433 0800
United States: +1-631-791-1145
This release was published on openPR.
USD/JPY edged higher in latest intraday trading while trying to recoup some recent losses, as the price also tried to vent off oversold saturation in the Stochastic with positive signals emerging from it.
It comes as the price settles below the pivotal support of 146.65 that was breached yesterday, while hurt by exiting an ascending correctional price channel previously, with the dominance of the main downward trend.
To get our more detailed analysis and 100% accurate signals provided by Best Trading Signal, subscribe to Economies.com VIP Club through the link below!
US crude oil price fell in latest intraday trading after managing to vent off oversold saturation that was apparent in the Stochastic, with negative signals emerging from it, while the price was hurt by exiting an ascending correctional price channel yesterday, which contained its short-term movement, with ongoing negative pressure due to trading below the 50-candle SMA.
To get our more detailed analysis and 100% accurate signals provided by Best Trading Signal, subscribe to Economies.com VIP Club through the link below!
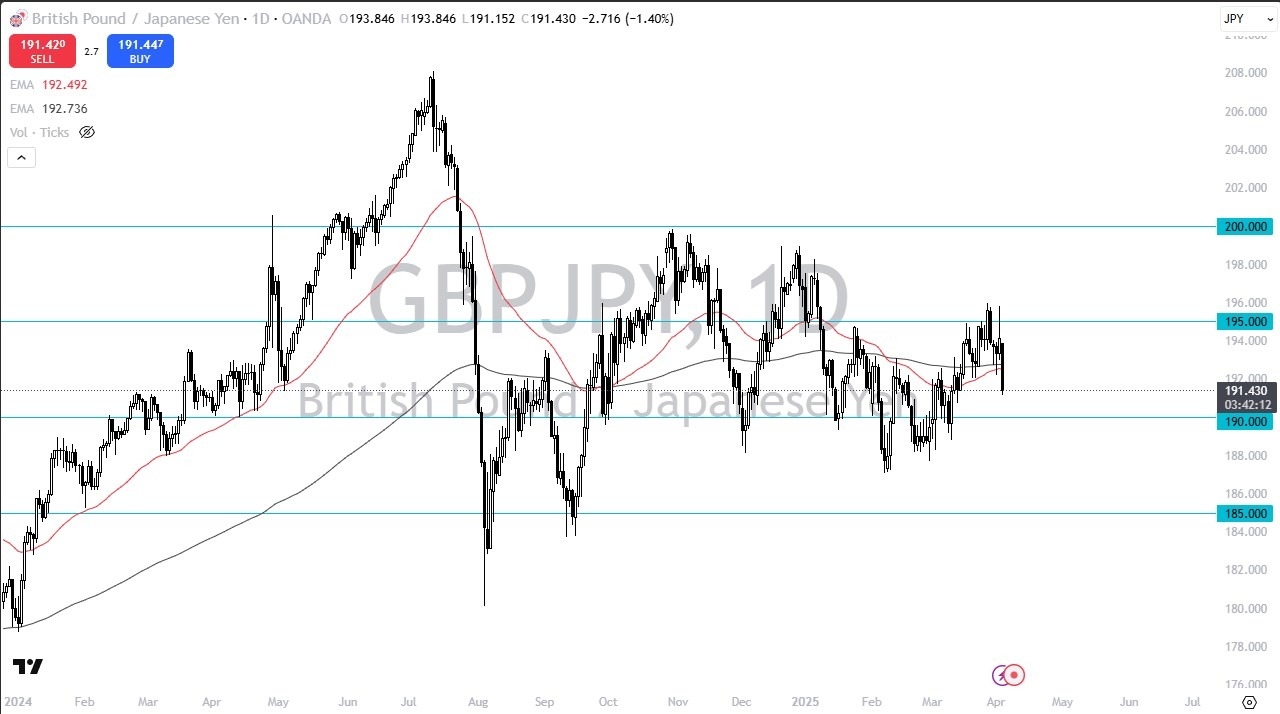
What will be interesting to see is how the market behaves after we’ve had time to digest all of the news, which of course has been very rapidly released. The Americans have slept massive tariffs on most of the rest of the world, and how certain countries behave will have a major outsized influence on how the markets behave. For example, some of the bigger ones like China and the European Union obviously will be crucial, but there are other countries that will also be moving, both of these groups will more likely than not move this pair, if for no other reason than the fact that the GBP/JPY pair tends to move based on risk appetite more than anything else.

During the trading session on Friday, we will get the employment numbers coming out of the United States, which almost always causes quite a bit of volatility as far as risk appetite is concerned. Because of this, it’s very likely that we will continue to see a lot of noisy behavior, and if it’s more of a “risk off day”, then the Japanese yen will continue to strengthen. The ¥190 level is an area that you need to be watching very closely, as it is a large, round, psychologically significant figure, and of course an area that traders will be paying close attention to for any signs of a bounce.
The ¥195 level above is going to be important as well, and if we can break above there then it would be a very bullish sign. That being said, we are nowhere near doing that, so I think more likely than not, we start bouncing around in a bit of a bounce.
Begin trading our daily forecasts and analysis. Here is a list of Forex brokers in Japan to work with.
Nonetheless, given the wide trading range for this week, crude oil could trade within the range for some time. The high-to-low price range for the week is $66.17 to $72.49 currently, which reflects a decline of $6.32 or 9.6%. Of course, there is also a chance that crude oil could drop below today’s low and head towards long-term support around $65.40. That was a 22-month low for crude oil. Given the strong bearish weekly reversal signal today, it is looking more likely that the price of crude oil eventually resolves to the downside. It has been largely consolidating for almost two years.
Price levels to watch during a bounce for potential resistance start with a $68.37 to $68.53 price range, consisting of previous resistance and the 20-Day MA, respectively. That price range is followed by a range from $68.82 to $69.07. The price range starts with an interim swing low and ends with a minor swing low at $69.07 from Monday.
Despite a very sharp decline today, crude oil respected the deep 88.6% Fibonacci retracement level at $66.20 as the low for the day was $66.17. That ratio is the square root of 78.6%, another important ratio, which is the square root of the golden ratio, 61.8%. This could mean that a temporary floor for the price of crude oil may have been established. It also further validates the usefulness of Fibonacci and harmonic ratios regarding price patterns in crude oil.
For a look at all of today’s economic events, check out our economic calendar.
USD/JPY edged higher in latest intraday trading while trying to recoup some recent losses, as the price also tried to vent off oversold saturation in the Stochastic with positive signals emerging from it.
It comes as the price settles below the pivotal support of 146.65 that was breached yesterday, while hurt by exiting an ascending correctional price channel previously, with the dominance of the main downward trend.
To get our more detailed analysis and 100% accurate signals provided by Best Trading Signal, subscribe to Economies.com VIP Club through the link below!
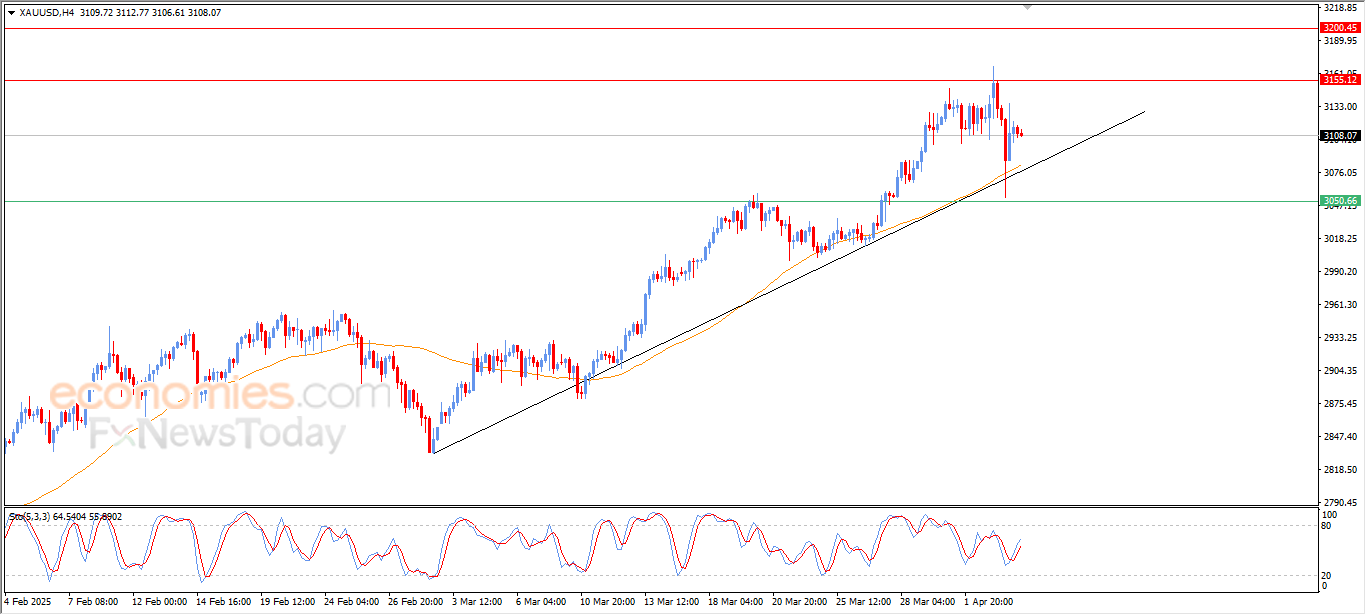
Gold price (XAU/USD) recovers some lost ground to near $3,115 during the late American session on Thursday after facing some profit-taking in the previous session. Escalating concerns over a global trade war and ongoing geopolitical risks boost the Gold price, a traditional safe-haven asset.
The precious metal trims losses after falling over 2% from an all-time high, as a broader market selloff triggered by US President Donald Trump’s reciprocal tariffs policy infected Gold traders. Traders attributed gold’s dip to profit-taking and investors selling some of their bullion holdings to cover losses in other asset classes.
However, the downside for the yellow metal might be capped amid the fears that Trump’s tariffs could dampen economic growth. The heightened uncertainty could boost the safe-haven flows, benefiting the Gold price. “As the market sold-off on the deleveraging pressures, the market was looking for buying opportunities on the dip,” said Peter Grant, vice president and senior metals strategist at Zaner Metals.
All eyes will be on the US March employment data on Friday, including Nonfarm Payrolls (NFP), Unemployment Rate and Average Hourly Earnings. In case of the stronger-than-expected outcome, this could lift the Greenback and cap the upside for the USD-denominated commodity price. Additionally, Federal Reserve (Fed) Chair Jerome Powell, Michael Barr, and Christopher Waller are set to speak later on the same day.
Gold has played a key role in human’s history as it has been widely used as a store of value and medium of exchange. Currently, apart from its shine and usage for jewelry, the precious metal is widely seen as a safe-haven asset, meaning that it is considered a good investment during turbulent times. Gold is also widely seen as a hedge against inflation and against depreciating currencies as it doesn’t rely on any specific issuer or government.
Central banks are the biggest Gold holders. In their aim to support their currencies in turbulent times, central banks tend to diversify their reserves and buy Gold to improve the perceived strength of the economy and the currency. High Gold reserves can be a source of trust for a country’s solvency. Central banks added 1,136 tonnes of Gold worth around $70 billion to their reserves in 2022, according to data from the World Gold Council. This is the highest yearly purchase since records began. Central banks from emerging economies such as China, India and Turkey are quickly increasing their Gold reserves.
Gold has an inverse correlation with the US Dollar and US Treasuries, which are both major reserve and safe-haven assets. When the Dollar depreciates, Gold tends to rise, enabling investors and central banks to diversify their assets in turbulent times. Gold is also inversely correlated with risk assets. A rally in the stock market tends to weaken Gold price, while sell-offs in riskier markets tend to favor the precious metal.
The price can move due to a wide range of factors. Geopolitical instability or fears of a deep recession can quickly make Gold price escalate due to its safe-haven status. As a yield-less asset, Gold tends to rise with lower interest rates, while higher cost of money usually weighs down on the yellow metal. Still, most moves depend on how the US Dollar (USD) behaves as the asset is priced in dollars (XAU/USD). A strong Dollar tends to keep the price of Gold controlled, whereas a weaker Dollar is likely to push Gold prices up.