The main category of Forex News.
You can use the search box below to find what you need.
[wd_asp id=1]
The main category of Forex News.
You can use the search box below to find what you need.
[wd_asp id=1]
April WTI crude oil (CLJ25) today is up +0.21 (+0.31%), and April RBOB gasoline (RBJ25) is up +0.236 (+1.10%).
Crude oil prices today climbed to a 1-1/2 week high and are mildly higher. Today’s dollar weakness is bullish for crude prices. Crude is also climbing on heightened geopolitical risks in the Middle East that could lead to a disruption of crude supplies from the region after the US launched strikes against Houthi Rebels in Yemen for attacking shipping in the Red Sea. Gains in crude are limited by hopes for a ceasefire in Ukraine, with President Trump set to speak with Russian President Putin this week as Mr. Trump pushes for an end to the three-year conflict.
Commodity Bulletin: From crude oil to coffee, this FREE newsletter is for industry pros and rookies alike
Crude prices are finding support today from rising tensions in the Middle East, which could lead to disruption of supplies from the region. The US launched weekend strikes on Yemen’s Houthi rebels, and Defense Secretary Hegseth said strikes will be “unrelenting” until the group stops attacking vessels in the Red Sea.
Today’s global economic news was mixed for crude prices. On the positive side, China Feb industrial production rose +5.9% year-to-date, stronger than expectations of +5.3% year-to-date. Also, China Feb retail sales rose +4.0% year-to-date, stronger than expectations of +3.8% year-to-date. Conversely, US Feb retail sales rose +0.2% m/m, weaker than expectations of +0.6% m/m. Also, the US Mar Empire manufacturing survey of general business conditions fell -25.7 to a 14-month low of -20.0, weaker than expectations of -1.9. In addition, the US Mar NAHB housing market index unexpectedly fell -3 to a 7-month low of 39, weaker than expectations of no change at 42.
A bearish factor for crude was Sunday’s action by Goldman Sachs to cut its year-end WTI crude price forecast to $67 a barrel from $72 and lower its 2025 global oil demand forecast by 18% to 900,000 bpd, citing a slowing global economy from tariffs and the OPEC+ plan to increase production.
On the bearish side of oil prices, the markets remain concerned that US tariffs and retaliatory tariffs will curb global growth and undercut energy demand.
Ramped-up Russian oil exports are negative for crude prices after data compiled by Bloomberg from analytics firm Vortexa showed Russian Feb oil products exports reached a 1-year high of 2.5 million bpd.
Crude prices were undercut when OPEC+ said on March 3 that it would restart some halted crude output in April, adding 138,000 bpd to global supplies. That is the first of a series of monthly hikes to reverse the 2-year-long production cut, which will gradually restore a total of 2.2 million bpd. OPEC+ had previously planned to restore production between January and late 2025, but now that production cut won’t be fully restored until September 2026. OPEC Feb crude production rose +320,000 bpd to a 14-month high of 27.35 million bpd.
In a supportive factor for crude oil prices, the US on January 10 imposed new sanctions on Russia’s oil industry that could curb global oil supplies. The measures targeted Gazprom Neft and Surgutneftgas, which exported about 970,000 bpd of Russian crude in the first 10 months of 2024, accounting for about 30% of its tanker flow, according to Bloomberg data. The US also targeted insurers and traders linked to hundreds of tanker cargoes. Weekly vessel-tracking data from Bloomberg showed Russian crude exports fell by -45,000 bpd to 3.48 million bpd in the week to March 9.
Crude oil demand in China has weakened and is a bearish factor for oil prices. According to Chinese customs data, China’s 2024 crude imports fell -1.9% y/y to 553 MMT. China is the world’s biggest crude importer.
A decline in crude oil held worldwide on tankers is bullish for oil prices. Vortexa reported today that crude oil stored on tankers that have been stationary for at least seven days fell by -20% w/w to 60.89 million bbl in the week ended March 14.
Last Wednesday’s EIA report showed that (1) US crude oil inventories as of March 7 were -5.1% below the seasonal 5-year average, (2) gasoline inventories were +1.3% above the seasonal 5-year average, and (3) distillate inventories were -4.8% below the 5-year seasonal average. US crude oil production in the week ending March 7 rose +0.5% w/w to 13.575 million bpd, modestly below the record high of 13.631 million bpd from the week of December 6.
Baker Hughes reported last Friday that active US oil rigs in the week ending March 14 rose +1 rig to 487 rigs, mildly above the 3-year low of 472 rigs posted on January 24. The number of US oil rigs has fallen over the past two years from the 4-1/2 year high of 627 rigs posted in December 2022.
On the date of publication, Rich Asplund did not have (either directly or indirectly) positions in any of the securities mentioned in this article. All information and data in this article is solely for informational purposes. For more information please view the Barchart Disclosure Policyhere.
More news from Barchart
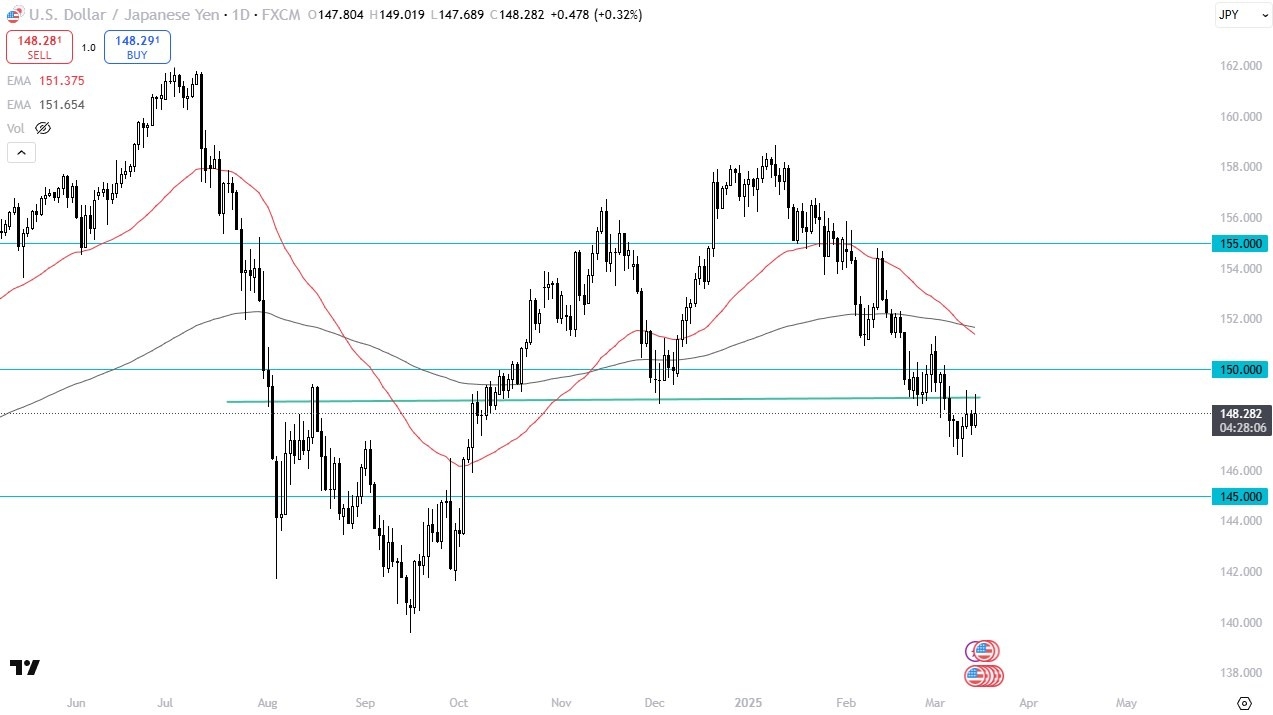
Looking at the weekly candlestick, I can see that it is a bit of a hammer and I’m seeing that across the board with the US dollar against most of its major currency competitors. next week could be interesting for the greenback. In this particular currency pair, I would need to see a daily close above 150 yen to get particularly interested in buying, but it is worth noting that the interest rate differential does favor the United States.

Furthermore, if there’s a little bit more of a risk on feel, then you could make the argument for this pair of rallying as well. Keep in mind that the Japanese yen tends to move in the same direction against most currencies. So, if this one rises, you might be able to find more juice with the British pound against the Japanese yen, or even the New Zealand dollar against the Japanese yen as an example. On the other hand, if we do fall from here, we could very well plunge towards the 145 yen level, which is
All things being equal, the next major support level underneath. I do think that you have a situation where traders are a little hesitant to get overly exposed one way or the other. So, I would like to see a little bit of follow through in one direction or the other in order to get a sizable position right now. think volatility is the one thing you can probably count on in a very choppy tight range.
Want to trade our USD/JPY forex analysis and predictions? Here’s a list of forex brokers in Japan to check out.
Intraday Trading:
Gold is currently trading within a narrow range of sideways movements at intraday levels.
It is aiming to build positive momentum that could help it surpass the psychological barrier at $3,000, a level it touched during last Friday’s session.
The price also managed to shake off the bullish exhaustion, as indicated by the RSI signals.
Next Price Target:
The next target is set at $3,055, according to the short-term symmetrical triangle pattern.
This target comes amid strong control by the primary uptrend and price trading in line with the trendline.
Positive Scenario:
The bullish scenario hinges on the price remaining above the support level at $2,950.
A break below this level could trigger downward pressure and potentially initiate a corrective wave that may take some time to unfold.
To get our more detailed analysis and 100% accurate signals provided by Best Trading Signal, subscribe to Economies.com VIP Club through the link below!
According to recent forex market trading, the euro rose against other major currencies in general, thanks to news of the German Green Party’s approval of Merz’s plans. German politicians had overcome a major hurdle by approving an unprecedented spending package proposed by new German Chancellor Friedrich Merz as part of a spending revolution. Overall, the Green Party’s approval means a solid majority in the Bundestag to pass the constitutional amendments needed to boost borrowing for infrastructure and defence investment.
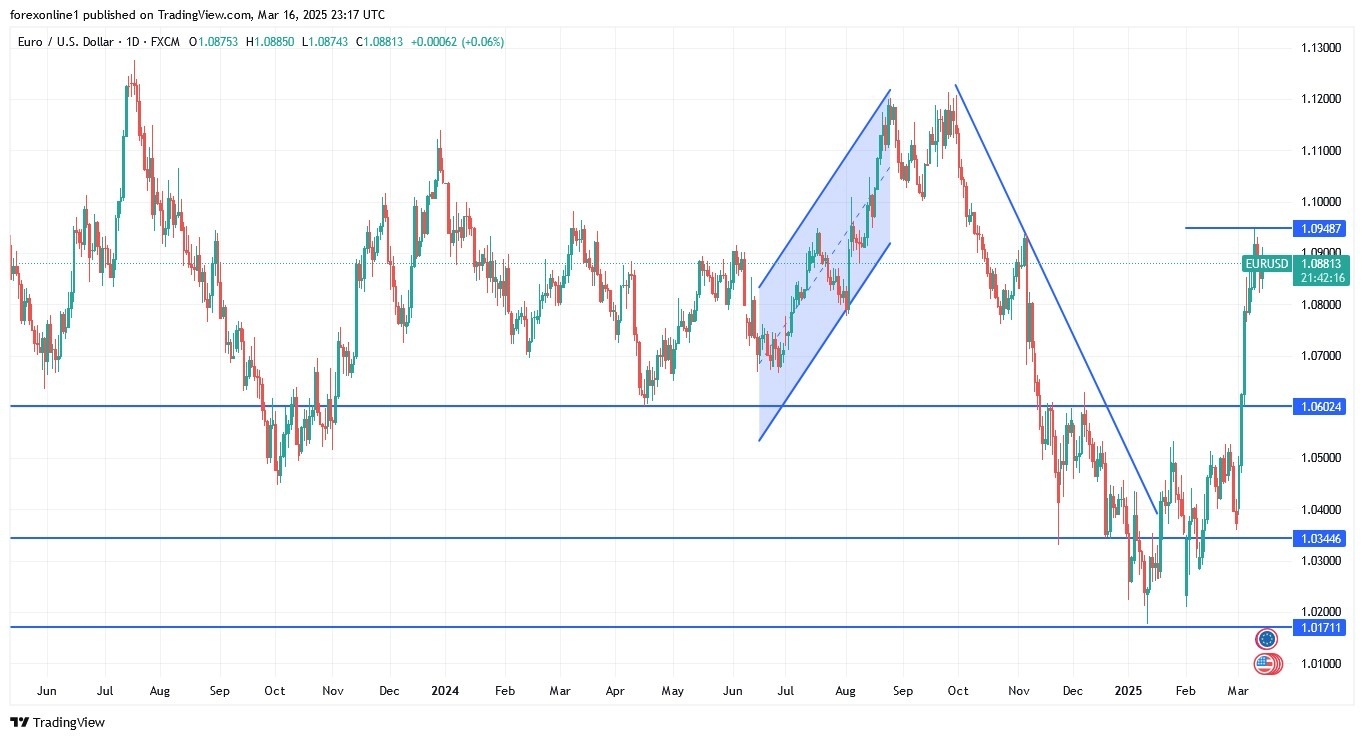
The German stimulus plan aims to allocate approximately 2% of GDP annually to infrastructure and defence spending over the next ten years. As a result, according to licensed trading platforms, the EUR/USD pair jumped back above the 1.09 resistance level, and German 10-year bond yields rose 5 basis points to 2.93.
For his part, German Chancellor Merz agreed to allocate approximately 10% of the €500 billion infrastructure spending package to environmental and climate investments, in an effort to win the support of his junior coalition partner. The euro’s performance was clearly sensitive to concerns about stalled negotiations. Overall, the constitutional amendment legislation must be passed in the current Bundestag, where the CDU/CSU, the SPD, and the Greens hold the required two-thirds majority. Economists believe these plans will allow Germany to invest up to €1 trillion over the next decade, providing a much-needed boost to Europe’s largest economy. They believe this will help lift all restrictions on economic activity. However, this type of spending takes time to plan and implement, meaning it won’t be effective until 2026.
Be cautious, EUR/USD gains, unless they gain new positive momentum, may be subject to profit-taking selloffs, and be cautious of the important events of this week.
In this regard, according to Forex market experts, DNB Markets raised its short-term Euro forecasts, citing a change in investor sentiment and increased optimism about the prospects of the European economy. However, the improved forecast target remains below the current level, reflecting the continued “optimistic” stance towards the US dollar. This upgrade is necessary to reflect the sharp rise in the Euro’s value, which saw its biggest rise since 2009. This rise is due to renewed confidence in European growth and the fading of US economic exceptionalism. DNB market experts added in a special note: “The news last week about a German ‘whatever it takes’ fiscal approach to infrastructure and defense has turned sentiment from pessimism to optimism.” However, the bank remains optimistic about the US dollar in the long term, maintaining its 12-month EUR/USD forecast at 1.06, and warning that recent US economic concerns may be exaggerated.
The bank now expects EUR/USD to reach 1.04 in three months, up from a previous forecast of 1.00. EUR/USD may break the 1.12 level – prepare! Morgan Stanley raises its targets, indicating a major shift in currency dynamics.
For its part, DNB Markets dismissed recent US economic growth concerns as overblown and continues to expect the Federal Reserve to raise interest rates in December, contrary to market expectations of a rate cut. While acknowledging the global uncertainty, the bank predicted the US dollar would regain strength as markets adjust to improved US economic fundamentals.
However, the Danish National Bank also highlighted a potential long-term shift in global capital flows, as investors reassess risks associated with US trade policies and international relations. The Danish National Bank warned that “if we are on the cusp of a structural shift in global savings, we are opening the door to a significant repricing of the US dollar beyond what we have already experienced.”
Despite this uncertainty, the bank emphasizes the strength of US economic fundamentals and believes that near-term market pricing is overreacting to geopolitical risks.
Based on recent trading on the daily chart above, the EUR/USD pair is still on an upward trajectory. Moreover, bulls may need to move towards the psychological resistance of 1.1000 to confirm control of the trend. Simultaneously, this peak will move technical indicators towards strong overbought levels. At the same time, and over the same timeframe, a move towards the support level of 1.0760 will be important for bears in the event of a breakout of the current ascending channel.
We expect the EUR/USD pair to remain within narrow ranges around its current trajectory until financial markets and investors react to the US Federal Reserve’s announcement, the Governor’s remarks, and a package of important US economic releases, in addition to the trajectory of Trump’s trade and political policies.
Ready to trade our daily Forex analysis? We’ve made a list of the best forex demo accounts worth trading with.
Intraday Trading:
Gold is currently trading within a narrow range of sideways movements at intraday levels.
It is aiming to build positive momentum that could help it surpass the psychological barrier at $3,000, a level it touched during last Friday’s session.
The price also managed to shake off the bullish exhaustion, as indicated by the RSI signals.
Next Price Target:
The next target is set at $3,055, according to the short-term symmetrical triangle pattern.
This target comes amid strong control by the primary uptrend and price trading in line with the trendline.
Positive Scenario:
The bullish scenario hinges on the price remaining above the support level at $2,950.
A break below this level could trigger downward pressure and potentially initiate a corrective wave that may take some time to unfold.
To get our more detailed analysis and 100% accurate signals provided by Best Trading Signal, subscribe to Economies.com VIP Club through the link below!
Intraday Trading:
Gold is currently trading within a narrow range of sideways movements at intraday levels.
It is aiming to build positive momentum that could help it surpass the psychological barrier at $3,000, a level it touched during last Friday’s session.
The price also managed to shake off the bullish exhaustion, as indicated by the RSI signals.
Next Price Target:
The next target is set at $3,055, according to the short-term symmetrical triangle pattern.
This target comes amid strong control by the primary uptrend and price trading in line with the trendline.
Positive Scenario:
The bullish scenario hinges on the price remaining above the support level at $2,950.
A break below this level could trigger downward pressure and potentially initiate a corrective wave that may take some time to unfold.
To get our more detailed analysis and 100% accurate signals provided by Best Trading Signal, subscribe to Economies.com VIP Club through the link below!
Although GBP/USD registered modest losses on Thursday and Friday, the pair managed to end the previous week in positive territory. Early Monday, the pair moves sideways at around 1.2950.
The table below shows the percentage change of British Pound (GBP) against listed major currencies last 7 days. British Pound was the strongest against the Japanese Yen.
| USD | EUR | GBP | JPY | CAD | AUD | NZD | CHF | |
|---|---|---|---|---|---|---|---|---|
| USD | -0.42% | -0.18% | 0.61% | -0.07% | -0.57% | -0.97% | 0.38% | |
| EUR | 0.42% | 0.21% | 1.04% | 0.36% | -0.06% | -0.57% | 0.68% | |
| GBP | 0.18% | -0.21% | 0.73% | 0.12% | -0.27% | -0.84% | 0.54% | |
| JPY | -0.61% | -1.04% | -0.73% | -0.67% | -1.10% | -1.64% | -0.16% | |
| CAD | 0.07% | -0.36% | -0.12% | 0.67% | -0.54% | -0.90% | 0.42% | |
| AUD | 0.57% | 0.06% | 0.27% | 1.10% | 0.54% | -0.51% | 0.79% | |
| NZD | 0.97% | 0.57% | 0.84% | 1.64% | 0.90% | 0.51% | 1.43% | |
| CHF | -0.38% | -0.68% | -0.54% | 0.16% | -0.42% | -0.79% | -1.43% |
The heat map shows percentage changes of major currencies against each other. The base currency is picked from the left column, while the quote currency is picked from the top row. For example, if you pick the British Pound from the left column and move along the horizontal line to the US Dollar, the percentage change displayed in the box will represent GBP (base)/USD (quote).
During the European trading hours, US stock index futures lose about 0.5% on the day, pointing to a cautious market stance. Nevertheless, GBP/USD’s downside remains supported for now, with investors refraining from taking large positions in anticipation of this week’s key macroeconomic events.
On Wednesday, the Federal Reserve (Fed) will release the interest rate decision and publish the revised Summary of Economic Projections (SEP), the so-called dot plot. On Thursday, the Bank of England (BoE) is expected to maintain its monetary policy settings following the March meeting.
Ahead of the Fed and the BoE announcements, the US economic calendar will feature Retail Sales data for February on Monday. Investors expect Retail Sales to grow by 0.7% on a monthly basis, following the 0.9% contraction reported in January. A big negative surprise in this data could weigh on the USD with the immediate reaction and help GBP/USD edge higher. A bearish action in Wall Street, however, could support the USD later in the day and make it difficult for the pair to gather bullish momentum.
GBP/USD remains within the upper half of the ascending regression channel and the Relative Strength Index (RSI) indicator on the 4-hour chart holds slightly above 50, reflecting a lack of seller interest.
On the downside, 1.2920 (50-period Simple Moving Average (SMA), mid-point of the ascending channel) aligns as immediate support before 1.2870 (static level) and 1.2790-1.2780 (100-period SMA, lower limit of the ascending channel).
Looking north, resistance could be spotted at 1.2970 (static level), 1.3000 (static level, round level) and 1.3060 (upper limit of the ascending channel).
The Pound Sterling (GBP) is the oldest currency in the world (886 AD) and the official currency of the United Kingdom. It is the fourth most traded unit for foreign exchange (FX) in the world, accounting for 12% of all transactions, averaging $630 billion a day, according to 2022 data. Its key trading pairs are GBP/USD, also known as ‘Cable’, which accounts for 11% of FX, GBP/JPY, or the ‘Dragon’ as it is known by traders (3%), and EUR/GBP (2%). The Pound Sterling is issued by the Bank of England (BoE).
The single most important factor influencing the value of the Pound Sterling is monetary policy decided by the Bank of England. The BoE bases its decisions on whether it has achieved its primary goal of “price stability” – a steady inflation rate of around 2%. Its primary tool for achieving this is the adjustment of interest rates. When inflation is too high, the BoE will try to rein it in by raising interest rates, making it more expensive for people and businesses to access credit. This is generally positive for GBP, as higher interest rates make the UK a more attractive place for global investors to park their money. When inflation falls too low it is a sign economic growth is slowing. In this scenario, the BoE will consider lowering interest rates to cheapen credit so businesses will borrow more to invest in growth-generating projects.
Data releases gauge the health of the economy and can impact the value of the Pound Sterling. Indicators such as GDP, Manufacturing and Services PMIs, and employment can all influence the direction of the GBP. A strong economy is good for Sterling. Not only does it attract more foreign investment but it may encourage the BoE to put up interest rates, which will directly strengthen GBP. Otherwise, if economic data is weak, the Pound Sterling is likely to fall.
Another significant data release for the Pound Sterling is the Trade Balance. This indicator measures the difference between what a country earns from its exports and what it spends on imports over a given period. If a country produces highly sought-after exports, its currency will benefit purely from the extra demand created from foreign buyers seeking to purchase these goods. Therefore, a positive net Trade Balance strengthens a currency and vice versa for a negative balance.
Important DisclaimersThe content provided on the website includes general news and publications, our personal analysis and opinions, and contents provided by third parties, which are intended for educational and research purposes only. It does not constitute, and should not be read as, any recommendation or advice to take any action whatsoever, including to make any investment or buy any product. When making any financial decision, you should perform your own due diligence checks, apply your own discretion and consult your competent advisors. The content of the website is not personally directed to you, and we does not take into account your financial situation or needs.The information contained in this website is not necessarily provided in real-time nor is it necessarily accurate. Prices provided herein may be provided by market makers and not by exchanges.Any trading or other financial decision you make shall be at your full responsibility, and you must not rely on any information provided through the website. FX Empire does not provide any warranty regarding any of the information contained in the website, and shall bear no responsibility for any trading losses you might incur as a result of using any information contained in the website.The website may include advertisements and other promotional contents, and FX Empire may receive compensation from third parties in connection with the content. FX Empire does not endorse any third party or recommends using any third party’s services, and does not assume responsibility for your use of any such third party’s website or services.FX Empire and its employees, officers, subsidiaries and associates, are not liable nor shall they be held liable for any loss or damage resulting from your use of the website or reliance on the information provided on this website.Risk DisclaimersThis website includes information about cryptocurrencies, contracts for difference (CFDs) and other financial instruments, and about brokers, exchanges and other entities trading in such instruments. Both cryptocurrencies and CFDs are complex instruments and come with a high risk of losing money. You should carefully consider whether you understand how these instruments work and whether you can afford to take the high risk of losing your money.FX Empire encourages you to perform your own research before making any investment decision, and to avoid investing in any financial instrument which you do not fully understand how it works and what are the risks involved.
The EUR/USD forecast shows optimism over Germany’s fiscal plans, likely boosting the Eurozone economy. As a result, the euro has held near its recent five-month peak. On the other hand, the dollar remains subdued amid fears of a US recession due to Trump’s trade policies.
-Are you interested in learning about the forex indicators? Click here for details-
On Friday, reports revealed that German parties had agreed to change the government’s borrowing limits. Therefore, the 500 billion euro fund proposal might come to life, boosting defense and infrastructure. This, in turn, will support the Eurozone economy and strengthen the euro.
Meanwhile, the dollar remained weak due to fears of the US recession and downbeat economic data. Trump’s aggressive trade policy changes have raised fears of a sharp slowdown in the US economy. Trump’s tariffs have ignited trade wars that will likely reduce trade in the global economy. Moreover, experts believe these duties will increase inflation, forcing central banks to keep interest rates elevated.
Therefore, policymakers will likely remain cautious despite soft inflation numbers. Notably, data on Friday revealed a sharp drop in consumer confidence. The lack of confidence in the economy proves investors are worried about the impact of Trump’s tariffs. At the same time, inflation expectations jumped.
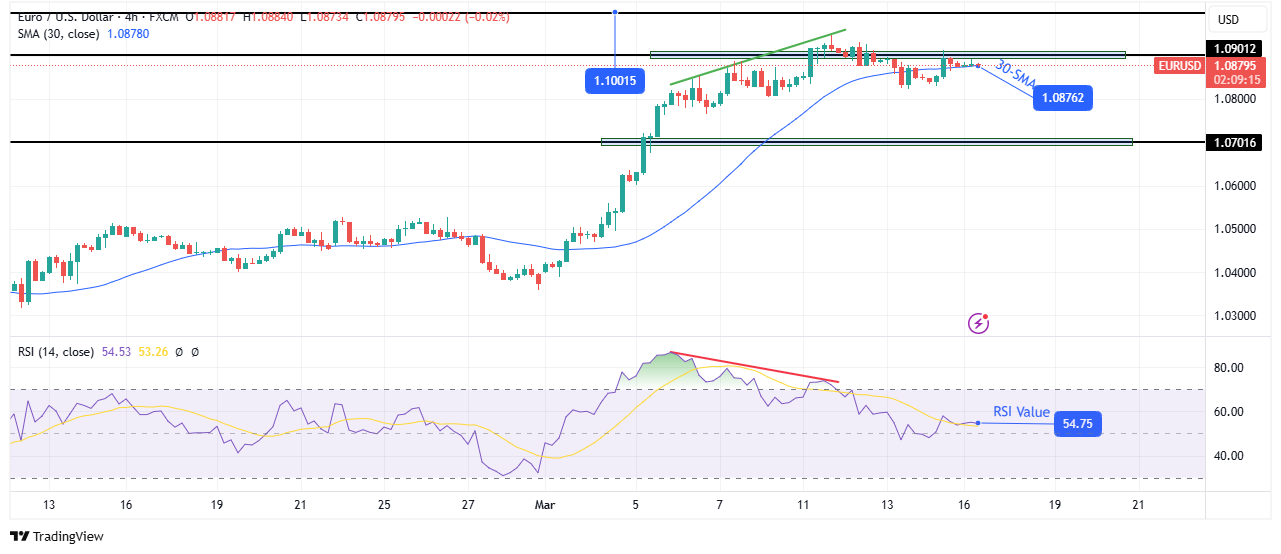
On the technical side, the EUR/USD price has recovered to retest the 1.0901 resistance level. As a result, it has broken back above the 30-SMA, showing bulls are struggling to keep control. At the same time, the RSI trades above 50, suggesting strong bullish momentum.
-Are you interested in learning about the best AI trading forex brokers? Click here for details-
Previously, the RSI had made a bearish divergence that signaled a likely reversal. This allowed bears to return and push the price below the 30-SMA. However, they have failed to make a significant swing below the SMA. If bulls regain momentum, the price will break above 1.0901 to seek new highs. This would allow EUR/USD to go beyond the 1.1001 key psychological level.
On the other hand, if bears are ready to take charge, the price will stay below 1.0901. Moreover, it might drop to retest the 1.0701 key level.
Looking to trade forex now? Invest at eToro!
68% of retail investor accounts lose money when trading CFDs with this provider. You should consider whether you can afford to take the high risk of losing your money.
The Silver price (XAG/USD) edges lower to around $33.80 after reaching its highest level since October 31, 2024, during the Asian trading hours on Monday. Nonetheless, the potential downside for the white metal seems limited due to the economic uncertainty over the impact of a global trade war and a softer Greenback.
The escalating trade war between the US and many of its largest trading partners has raised concerns about the impact on economies across the world. This, in turn, might boost the safe-haven asset like the Silver. Last week, US President Donald Trump threatened a 200% tariff on any alcohol coming to the US from the European Union (EU). Trump has also raised levies on Chinese imports into the US to at least 20%.
Additionally, supply deficits and growing industrial demand could act as strong tailwinds for the white metal. According to the global investment firm WisdomTree, investors hold a significant portion of it and expect higher prices to encourage sales. Industrial demand for silver has reached all-time highs, owing to its use in photovoltaic applications, 5G technology, and automotive electronics.
Silver traders will keep an eye on the US Retail Sales report for February, which is expected to grow by 0.7% MoM. In case of a stronger-than-expected outcome, this could lift the US Dollar (USD) and weigh on the USD-denominated commodity price in the near term.
Silver is a precious metal highly traded among investors. It has been historically used as a store of value and a medium of exchange. Although less popular than Gold, traders may turn to Silver to diversify their investment portfolio, for its intrinsic value or as a potential hedge during high-inflation periods. Investors can buy physical Silver, in coins or in bars, or trade it through vehicles such as Exchange Traded Funds, which track its price on international markets.
Silver prices can move due to a wide range of factors. Geopolitical instability or fears of a deep recession can make Silver price escalate due to its safe-haven status, although to a lesser extent than Gold’s. As a yieldless asset, Silver tends to rise with lower interest rates. Its moves also depend on how the US Dollar (USD) behaves as the asset is priced in dollars (XAG/USD). A strong Dollar tends to keep the price of Silver at bay, whereas a weaker Dollar is likely to propel prices up. Other factors such as investment demand, mining supply – Silver is much more abundant than Gold – and recycling rates can also affect prices.
Silver is widely used in industry, particularly in sectors such as electronics or solar energy, as it has one of the highest electric conductivity of all metals – more than Copper and Gold. A surge in demand can increase prices, while a decline tends to lower them. Dynamics in the US, Chinese and Indian economies can also contribute to price swings: for the US and particularly China, their big industrial sectors use Silver in various processes; in India, consumers’ demand for the precious metal for jewellery also plays a key role in setting prices.
Silver prices tend to follow Gold’s moves. When Gold prices rise, Silver typically follows suit, as their status as safe-haven assets is similar. The Gold/Silver ratio, which shows the number of ounces of Silver needed to equal the value of one ounce of Gold, may help to determine the relative valuation between both metals. Some investors may consider a high ratio as an indicator that Silver is undervalued, or Gold is overvalued. On the contrary, a low ratio might suggest that Gold is undervalued relative to Silver.