The main category of Forex News.
You can use the search box below to find what you need.
[wd_asp id=1]
The main category of Forex News.
You can use the search box below to find what you need.
[wd_asp id=1]
Gold price is trading better bid below the historic high of $3,005 reached last Friday. The upside potential in Gold price remains intact amid favorable fundamental and technical factors.
On the fundamental front, US President Donald Trump sparked global trade war and its impact on the US economic prospects, latest geopolitical tensions and the increased odds that the US Federal Reserve (Fed) will stick to its easing cycle continue to underpin the safe-haven appeal of the Gold price while remaining a drag on the US Dollar (USD).
Over the weekend, geopolitical tensions escalated between the US and Yemen after the US launched airstrikes on large-scale strikes on Yemen, targeting the Iran-backed militant group – Houthis. In response, Houthis attacked US vessels in the Red Sea, which Trump vowed to stop, warning that “hell will rain down” on the Houthis if they continue.
Meanwhile, Israeli military strikes killed at least 15 Palestinians in the Gaza Strip over the past 24 hours. Additionally, Trump’s envoy Steve Witkoff said on Sunday that he expected the US President to speak with Russian President Vladimir Putin this week after the Kremlin supported the 30-day cease-fire with Ukraine.
Gold price also find support from the latest measures launched by China on Sunday to boost consumption and raise incomes. China is the world’s top Gold consumer. Further, mostly upbeat Chinese activity data for the January and February period also helps keep Gold price afloat.
However, it remains to be seen if Gold price sees a fresh leg higher as the US Retail Sales data will likely provide fresh hints on the state of the US economy, driving the next direction in the USD.
That said, Gold traders will refrain from placing fresh bets on the bright metal ahead of Wednesday’s Fed policy announcements and the updated economic projections.
Gold price remains exposed to upside risks following the upside break of an ascending triangle formation last Thursday.
Gold buyers need acceptance above the $3,000 psychological barrier to extend the record rally toward the $3,050 mark.
The 14-day Relative Strength Index (RSI) sits just beneath the overbought region, which is currently near 67, keeping buyers hopeful.
Therefore, any retracement in Gold price will likely be considered a good dip buying opportunity.
On a corrective downside, Gold price could challenge the previous triangle resistance-turned-support at $2,956, below which the 21-day Simple Moving Average (SMA) at $2,923 will be tested.
The last line of defense for buyers is at the triangle support line, pegged at $2,906.
The Retail Sales data, released by the US Census Bureau on a monthly basis, measures the value in total receipts of retail and food stores in the United States. Retail Sales measure the change in the total value of goods sold at the retail level during a year. Retail Sales data is widely followed as an indicator of consumer spending, which is a major driver of the US economy. A result higher than expected is typically viewed as positive or bullish for the USD, whereas a lower than expected result is considered negative or bearish for the USD.
Next release: Mon Mar 17, 2025 12:30
Frequency: Monthly
Consensus: –
Previous: 4.2%
Source: US Census Bureau
Gold price (XAU/USD) remains strong near $2,985 after retracing from an all-time high of $3,005 during the early Asian session on Monday. The softer US Dollar (USD) and economic uncertainty over the impact of a global trade war provide some support to the precious metal. Traders await the US February Retail Sales data, which is due later on Monday.
The escalating trade war between the US and many of its major trading partners has rattled financial markets and prompted fears about the impact on economies across the world. On Thursday, US President Donald Trump threatened to impose a 200% tariff on wine, cognac and other alcohol imports from Europe.
This measure came in response to the EU plan to impose tariffs on American whiskey and other products in April, which itself is a reaction to Trump’s 25% duties on steel and aluminum imports that took effect on Wednesday.
Additionally, the softer Greenback after the weaker-than-expected US economic data contributes to the Gold’s upside. The preliminary reading of the University of Michigan (UoM) Consumer Sentiment Index showed that the index reached its lowest since November 2022, falling to 57.9 from 64.7 in the previous reading. This reading came in below the market consensus of 63.1.
The Houthis stated on Sunday that they launched an attack on the USS Harry S Truman aircraft carrier and its supporting vessels in the northern Red Sea, using 18 ballistic and cruise missiles as well as drones. “In a backdrop of geopolitical uncertainty and ongoing tariff changes, appetite for gold remains strong,” said Suki Cooper, a precious metals analyst at Standard Chartered.
However, any positive developments or easing fears of Russia and Ukraine conflicts might drag the Gold price lower. Last week, the United States and Ukraine decided to propose a 30-day ceasefire to Russia. Trump’s envoy Steve Witkoff said on Sunday that he expected Trump to speak with Russian President Vladimir Putin this week, saying that Putin “accepts the philosophy” of Trump’s ceasefire and peace terms.
Gold has played a key role in human’s history as it has been widely used as a store of value and medium of exchange. Currently, apart from its shine and usage for jewelry, the precious metal is widely seen as a safe-haven asset, meaning that it is considered a good investment during turbulent times. Gold is also widely seen as a hedge against inflation and against depreciating currencies as it doesn’t rely on any specific issuer or government.
Central banks are the biggest Gold holders. In their aim to support their currencies in turbulent times, central banks tend to diversify their reserves and buy Gold to improve the perceived strength of the economy and the currency. High Gold reserves can be a source of trust for a country’s solvency. Central banks added 1,136 tonnes of Gold worth around $70 billion to their reserves in 2022, according to data from the World Gold Council. This is the highest yearly purchase since records began. Central banks from emerging economies such as China, India and Turkey are quickly increasing their Gold reserves.
Gold has an inverse correlation with the US Dollar and US Treasuries, which are both major reserve and safe-haven assets. When the Dollar depreciates, Gold tends to rise, enabling investors and central banks to diversify their assets in turbulent times. Gold is also inversely correlated with risk assets. A rally in the stock market tends to weaken Gold price, while sell-offs in riskier markets tend to favor the precious metal.
The price can move due to a wide range of factors. Geopolitical instability or fears of a deep recession can quickly make Gold price escalate due to its safe-haven status. As a yield-less asset, Gold tends to rise with lower interest rates, while higher cost of money usually weighs down on the yellow metal. Still, most moves depend on how the US Dollar (USD) behaves as the asset is priced in dollars (XAU/USD). A strong Dollar tends to keep the price of Gold controlled, whereas a weaker Dollar is likely to push Gold prices up.
Goldman Sachs Group Inc has cut its oil price forecasts, citing weaker US growth due to tariffs and increased output from OPEC and its allies.
The bank now expects Brent crude to reach US$71 per barrel in December, down US$5 from its previous estimate, while US benchmark West Texas Intermediate (WTI) is projected at US$67. Analysts, including Daan Struyven, noted in a report dated Sunday that Brent will trade within a US$65 to US$80 range and average US$68 next year.
“The medium-term risks to our forecast remain to the downside given potential further tariff escalation and potentially longer OPEC+ production increases,” the analysts stated.
Goldman has also revised its forecast for oil demand growth this year, lowering it by 18% to 900,000 barrels per day due to a slowing US economy driven by higher tariffs. Additional supply from OPEC and its allies has also contributed to a more balanced market.
Brent crude was trading around US$71 on Monday, having declined roughly 14% from its peak in January.
Bloomberg
Barclays sees Brent Crude prices at $74 per barrel this year, down by $9 from its previous forecast, as it slashed its global demand growth estimate in mounting economic uncertainties.
“We turn neutral on oil prices relative to the curve and consensus, as we revise down our 2025 demand outlook 510,000 barrels per day due to soft high?-?frequency indicators and elevated economic uncertainty,” Barclays analysts wrote in a note on Friday carried by Reuters.
The UK-based bank now sees this year’s demand growth at 900,000 bpd.
But Barclays is not turning bearish on future oil prices as inventories around the world are still at low levels and some producers could slow supply growth due to softer prices.
“However, we do not turn bearish relative to the curve, as inventories are low and still declining, and risks to the supply outlook are also skewed to the downside, due to price-sensitive producers pulling back and geopolitical tensions,” the bank’s analysts wrote.
Barclays expects U.S. crude oil production to increase by the end of this year by just 200,000 bpd compared to the end of the fourth quarter of 2024.
The International Energy Agency (IEA) said in its monthly report on Thursday that its current balances suggest global oil supply may exceed demand by around 600,000 bpd this year.
“If OPEC+ extends the unwinding of output cuts beyond April without reining in supply from members currently overproducing versus their targets, another 400 kb/d could be added to the market,” the IEA said.
The Paris-based agency expects growth in global oil demand to be just over 1 million bpd this year, reaching 103.9 million bpd.
OPEC, however, sees robust oil demand growth this year and next, expecting consumption to rise by 1.4 million bpd in each of 2025 and 2026.
Early on Friday, Brent Crude prices were trading just above the $70 per barrel mark, marginally higher on the day, propped up by a new round of U.S. sanctions targeting Iran’s oil industry.
By Charles Kennedy for Oilprice.com
More Top Reads From Oilprice.com
Copper prices are influenced by a variety of factors, but they can be broadly categorised into the following five key drivers:
Copper is closely tied to economic growth, making it a reliable barometer for global health. Indicators such as GDP growth, industrial production, and manufacturing activity directly influence demand. Infrastructure projects, urbanisation, and the transition to renewable energy – like EVs and wind turbines – further fuel demand during periods of economic expansion.
Supply disruptions, such as labour strikes, declining ore grades, or natural disasters, can tighten the market and drive up prices. Major producers like Chile and Peru dominate global supply, meaning any instability in these regions significantly impacts copper availability and pricing.
Investor behaviour plays a major role in copper price fluctuations. Optimism about future demand, driven by trends like the energy transition, can create bullish momentum, while negative sentiment tied to economic slowdowns can cause prices to drop. Speculative activity in futures markets often amplifies these trends.
Geopolitical events, trade policies, and currency fluctuations significantly influence copper prices. Tensions between major economies, tariffs, and export restrictions can disrupt global trade flows, while a stronger US dollar often makes copper more expensive for non-dollar economies.
Monetary policies, particularly interest rate decisions, indirectly impact copper demand. Low interest rates encourage borrowing and investment in infrastructure, boosting demand. Conversely, rising interest rates or inflation can curb economic activity and reduce the need for industrial metals.
When it comes to copper’s historical performance, the brown metal has been a valuable resource for millennia, with its use dating back to ancient civilisations for tools, weapons, and currency. While no formal markets existed in early history, copper’s utility ensured its consistent demand.
In modern history, copper prices began to fluctuate with industrialisation. By the 1930s, copper traded at around $0.10 per pound during the Great Depression, following a steep decline from earlier highs. The post-World War II era saw steady growth in demand due to electrification and industrial expansion, with prices averaging between $0.30 and $0.60 per pound through the mid-20th century.
The 2000s marked a significant turning point. Copper prices surged from under $0.80 per pound in 2003 to nearly $4.00 by 2008, driven by China’s rapid industrialisation. However, the 2008 global financial crisis caused prices to plummet to around $1.40 per pound before rebounding quickly as infrastructure investment picked up. By 2011, copper reached over $4.50 per pound.
More recently, the energy transition and growing demand for electric vehicles (EVs) have sustained elevated copper prices. In May 2021, copper peaked at $4.80 per pound, fuelled by supply constraints and optimism around renewable energy projects. However, economic slowdowns in China, rising inflation, and monetary tightening have created price volatility. Over the past few years, copper prices have fluctuated between $3.50 and $4.50 per pound.
Today, copper remains a vital industrial asset, with its performance influenced by global economic activity, sustainability trends, and technological advancements. Its role in the green energy transition ensures its long-term significance, offering opportunities for traders to capitalise on price movements.
When approaching your copper trading strategy, it’s essential to recognise the opportunities and risks associated with this vital industrial metal. Copper’s role as an economic indicator and its importance in industries like construction, electronics, and renewable energy make it a dynamic asset to trade. Developing a robust trading strategy aligned with your goals, experience, and risk tolerance is critical for navigating its price volatility.
A well-planned trading strategy can help you open, manage, and close positions more effectively while minimising potential losses. Copper traders often combine technical analysis and fundamental insights to determine optimal entry and exit points.
Technical strategies for copper rely on chart indicators to track price movements, identify patterns, and generate buy or sell signals. For instance:
These tools allow traders to interpret historical price data. Remember that past performance is not a reliable indicator of future results
Price action trading focuses on analysing copper’s historical price movements to anticipate future trends. For example:
Copper’s liquidity and volatility make this strategy a potential choice for short-term traders.
Trend trading involves taking long-term positions based on the direction of copper’s price trend. Traders may choose to:
Go long during periods of rising prices, driven by factors such as increased demand for electric vehicles or renewable energy infrastructure.
Short copper during economic slowdowns or increased supply from major producers like Chile and Peru.
Fundamental factors, such as China’s economic performance or changes in mining output, play a critical role in this strategy.
News trading capitalises on market-moving events that influence copper prices. Examples include:
Geopolitical events: labour strikes in major copper-producing nations can tighten supply and push prices higher.
Economic data: strong manufacturing data from China often signals rising copper demand, leading to price increases.
Weather disruptions: natural disasters affecting mines can lead to supply constraints.
Staying updated on news and analysis is crucial for implementing this strategy effectively.
Range trading identifies support and resistance levels within which copper prices fluctuate. For instance, if copper is trading in a range of $3.50-$4.50:
Support level: prices near $3.50 per pound (an undervalued zone).
Resistance level: prices nearing $4.50 per pound (an overbought zone).
Using tools like Bollinger Bands, traders buy at support and sell at resistance, leveraging copper’s historical price behaviour.
Breakout trading targets opportunities when copper prices move outside of established ranges, signaling potential volatility. For example:
Breakouts often occur due to significant market catalysts, such as policy changes in China or major supply disruptions.
Fundamental trading in copper focuses on analysing supply-demand dynamics rather than relying solely on technical indicators. You can consider:
Going long on copper during periods of strong economic growth or increased infrastructure investment.
Shorting copper when global demand slows or mining output increases significantly.
This strategy requires a deep understanding of macroeconomic trends, particularly those tied to industrial production and the energy transition.
Diversify your strategies: instead of relying on a single approach, consider a mix of strategies based on market conditions. For instance, position trading might work well in a bullish market, while trend trading can be effective in volatile conditions.
Stay educated: regularly update your knowledge of market trends, economic indicators, and sector performance. Enrolling in commodity trading courses or following expert analysts can deepen your expertise.
Disclaimer: All figures included in the above examples are for illustrative purposes only and do not reflect actual market data or real account conditions.
Risk Disclosure: Trading in financial instruments and/or cryptocurrencies involves high risks including the risk of losing some, or all, of your investment amount, and may not be suitable for all investors. Prices of cryptocurrencies are extremely volatile and may be affected by external factors such as financial, regulatory or political events. Trading on margin increases the financial risks.
Before deciding to trade in financial instrument or cryptocurrencies you should be fully informed of the risks and costs associated with trading the financial markets, carefully consider your investment objectives, level of experience, and risk appetite, and seek professional advice where needed.
Fusion Media would like to remind you that the data contained in this website is not necessarily real-time nor accurate. The data and prices on the website are not necessarily provided by any market or exchange, but may be provided by market makers, and so prices may not be accurate and may differ from the actual price at any given market, meaning prices are indicative and not appropriate for trading purposes. Fusion Media and any provider of the data contained in this website will not accept liability for any loss or damage as a result of your trading, or your reliance on the information contained within this website.
It is prohibited to use, store, reproduce, display, modify, transmit or distribute the data contained in this website without the explicit prior written permission of Fusion Media and/or the data provider. All intellectual property rights are reserved by the providers and/or the exchange providing the data contained in this website.
Fusion Media may be compensated by the advertisers that appear on the website, based on your interaction with the advertisements or advertisers.
© 2007-2025 – Fusion Media Limited. All Rights Reserved.
Copper prices are influenced by a variety of factors, but they can be broadly categorised into the following five key drivers:
Copper is closely tied to economic growth, making it a reliable barometer for global health. Indicators such as GDP growth, industrial production, and manufacturing activity directly influence demand. Infrastructure projects, urbanisation, and the transition to renewable energy – like EVs and wind turbines – further fuel demand during periods of economic expansion.
Supply disruptions, such as labour strikes, declining ore grades, or natural disasters, can tighten the market and drive up prices. Major producers like Chile and Peru dominate global supply, meaning any instability in these regions significantly impacts copper availability and pricing.
Investor behaviour plays a major role in copper price fluctuations. Optimism about future demand, driven by trends like the energy transition, can create bullish momentum, while negative sentiment tied to economic slowdowns can cause prices to drop. Speculative activity in futures markets often amplifies these trends.
Geopolitical events, trade policies, and currency fluctuations significantly influence copper prices. Tensions between major economies, tariffs, and export restrictions can disrupt global trade flows, while a stronger US dollar often makes copper more expensive for non-dollar economies.
Monetary policies, particularly interest rate decisions, indirectly impact copper demand. Low interest rates encourage borrowing and investment in infrastructure, boosting demand. Conversely, rising interest rates or inflation can curb economic activity and reduce the need for industrial metals.
When it comes to copper’s historical performance, the brown metal has been a valuable resource for millennia, with its use dating back to ancient civilisations for tools, weapons, and currency. While no formal markets existed in early history, copper’s utility ensured its consistent demand.
In modern history, copper prices began to fluctuate with industrialisation. By the 1930s, copper traded at around $0.10 per pound during the Great Depression, following a steep decline from earlier highs. The post-World War II era saw steady growth in demand due to electrification and industrial expansion, with prices averaging between $0.30 and $0.60 per pound through the mid-20th century.
The 2000s marked a significant turning point. Copper prices surged from under $0.80 per pound in 2003 to nearly $4.00 by 2008, driven by China’s rapid industrialisation. However, the 2008 global financial crisis caused prices to plummet to around $1.40 per pound before rebounding quickly as infrastructure investment picked up. By 2011, copper reached over $4.50 per pound.
More recently, the energy transition and growing demand for electric vehicles (EVs) have sustained elevated copper prices. In May 2021, copper peaked at $4.80 per pound, fuelled by supply constraints and optimism around renewable energy projects. However, economic slowdowns in China, rising inflation, and monetary tightening have created price volatility. Over the past few years, copper prices have fluctuated between $3.50 and $4.50 per pound.
Today, copper remains a vital industrial asset, with its performance influenced by global economic activity, sustainability trends, and technological advancements. Its role in the green energy transition ensures its long-term significance, offering opportunities for traders to capitalise on price movements.
When approaching your copper trading strategy, it’s essential to recognise the opportunities and risks associated with this vital industrial metal. Copper’s role as an economic indicator and its importance in industries like construction, electronics, and renewable energy make it a dynamic asset to trade. Developing a robust trading strategy aligned with your goals, experience, and risk tolerance is critical for navigating its price volatility.
A well-planned trading strategy can help you open, manage, and close positions more effectively while minimising potential losses. Copper traders often combine technical analysis and fundamental insights to determine optimal entry and exit points.
Technical strategies for copper rely on chart indicators to track price movements, identify patterns, and generate buy or sell signals. For instance:
These tools allow traders to interpret historical price data. Remember that past performance is not a reliable indicator of future results
Price action trading focuses on analysing copper’s historical price movements to anticipate future trends. For example:
Copper’s liquidity and volatility make this strategy a potential choice for short-term traders.
Trend trading involves taking long-term positions based on the direction of copper’s price trend. Traders may choose to:
Go long during periods of rising prices, driven by factors such as increased demand for electric vehicles or renewable energy infrastructure.
Short copper during economic slowdowns or increased supply from major producers like Chile and Peru.
Fundamental factors, such as China’s economic performance or changes in mining output, play a critical role in this strategy.
News trading capitalises on market-moving events that influence copper prices. Examples include:
Geopolitical events: labour strikes in major copper-producing nations can tighten supply and push prices higher.
Economic data: strong manufacturing data from China often signals rising copper demand, leading to price increases.
Weather disruptions: natural disasters affecting mines can lead to supply constraints.
Staying updated on news and analysis is crucial for implementing this strategy effectively.
Range trading identifies support and resistance levels within which copper prices fluctuate. For instance, if copper is trading in a range of $3.50-$4.50:
Support level: prices near $3.50 per pound (an undervalued zone).
Resistance level: prices nearing $4.50 per pound (an overbought zone).
Using tools like Bollinger Bands, traders buy at support and sell at resistance, leveraging copper’s historical price behaviour.
Breakout trading targets opportunities when copper prices move outside of established ranges, signaling potential volatility. For example:
Breakouts often occur due to significant market catalysts, such as policy changes in China or major supply disruptions.
Fundamental trading in copper focuses on analysing supply-demand dynamics rather than relying solely on technical indicators. You can consider:
Going long on copper during periods of strong economic growth or increased infrastructure investment.
Shorting copper when global demand slows or mining output increases significantly.
This strategy requires a deep understanding of macroeconomic trends, particularly those tied to industrial production and the energy transition.
Diversify your strategies: instead of relying on a single approach, consider a mix of strategies based on market conditions. For instance, position trading might work well in a bullish market, while trend trading can be effective in volatile conditions.
Stay educated: regularly update your knowledge of market trends, economic indicators, and sector performance. Enrolling in commodity trading courses or following expert analysts can deepen your expertise.
Disclaimer: All figures included in the above examples are for illustrative purposes only and do not reflect actual market data or real account conditions.
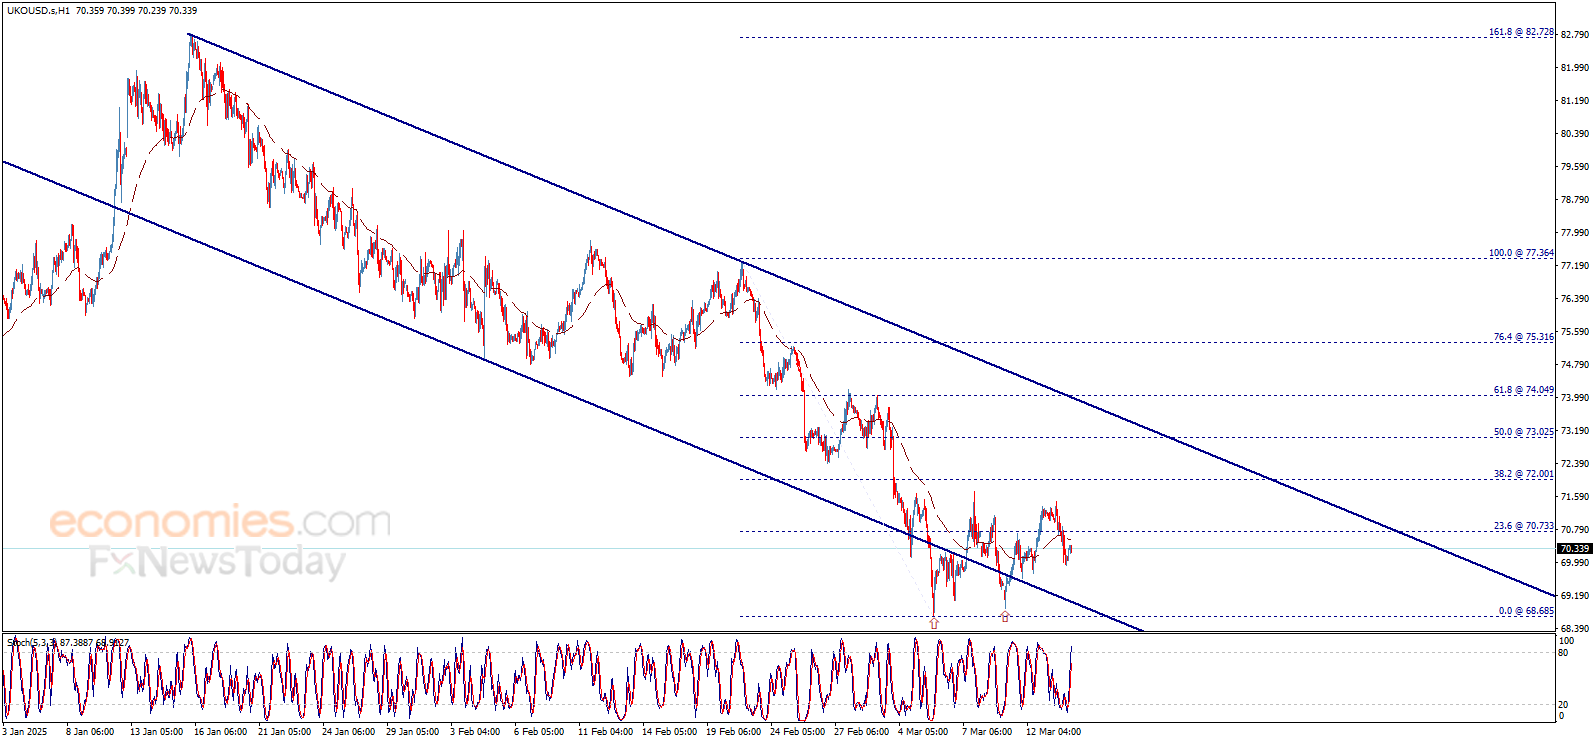
Brent oil price faced strong negative pressures in the previous sessions to break 70.75$ and settle below it, noticing that the price attempts to rise again, approaching the mentioned level, while stochastic loses its positive momentum clearly to enter the overbought areas.
To review the full report, and to get our more detailed analysis and 100% accurate signals provided by Best Trading Signal, subscribe to Economies.com VIP Club through the link below!
The USD/JPY weekly forecast turns positive as fears of the impact of Trump’s tariffs on Japan’s economy rise.
The USD/JPY price had a slightly bullish week as the dollar recovered with Treasury yields. Meanwhile, the yen gave up some gains as market participants worried about the impact of Trump’s tariffs on Japan.
-Are you interested in learning about the forex indicators? Click here for details-
Trump imposed a tariff on steel and aluminum imports, igniting trade wars with Canada and the Eurozone. This escalated fears of a global economic slowdown. As a result, traders sought safety in US Treasuries. Meanwhile, the tariff fears overshadowed a downbeat US inflation report.
On the other hand, the yen eased as market participants focused on the vulnerable export-reliant Japanese economy. Trump’s tariffs might hurt the economy.
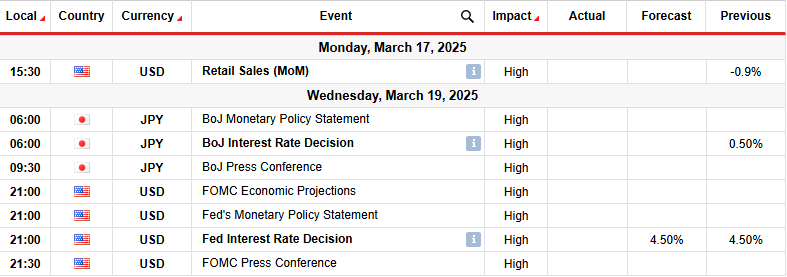
Next week, market participants will focus on monetary policy meetings by the Bank of Japan and the Fed. Moreover, the US will release its retail sales report, showing the state of consumer spending.
Economists believe both the Bank of Japan and the Fed will keep interest rates unchanged. However, BoJ policymakers might maintain a hawkish tone, signaling future hikes. Meanwhile, the Fed might remain cautious due to uncertainty regarding Trump’s tariffs.
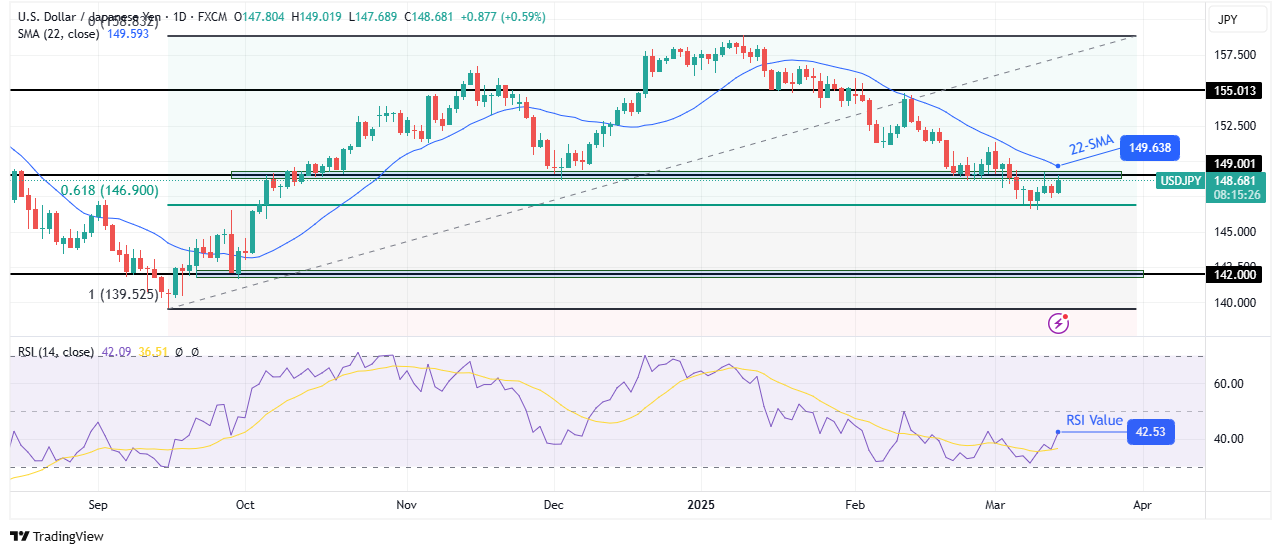
On the technical side, the USD/JPY price is climbing after meeting the 0.618 Fib retracement. However, the price is still below the 22-SMA. At the same time, the RSI trades below 50, supporting strong bearish momentum. Since the price broke below the 22-SMA, it has maintained its position below this line, indicating a strong downtrend. Furthermore, the price has consistently made lower highs and lows.
-Are you interested in learning about the best AI trading forex brokers? Click here for details-
The downtrend recently made a milestone move by breaking below the 149.00 support level. After the break, the price has risen to retest this level as resistance. If it holds firm, bears might resume the downtrend. However, the price would have to break below the 0.618 Fib retracement. This would allow USD/JPY to target the 142.00 support level.
On the other hand, if bears fail to break below the 0.618 Fib, bulls might push the price back above 149.00. A break above the SMA would signal a likely reversal.
Looking to trade forex now? Invest at eToro!
68% of retail investor accounts lose money when trading CFDs with this provider. You should consider whether you can afford to take the high risk of losing your money.