The main category of Forex News.
You can use the search box below to find what you need.
[wd_asp id=1]
The main category of Forex News.
You can use the search box below to find what you need.
[wd_asp id=1]
The EURJPY pair formed strong bullish rally yesterday, confirming its surrender to the domination of the bullish bias, to notice its fluctuation near the second target at 161.65, taking advantage of its stability above the MA55.
We expect to form additional support at 160.10, beside stochastic additional positive momentum, to continue forming the bullish waves and attempt to press on 162.40 resistance line, followed by monitoring its behavior due to the importance of this level to detect the next trend.
The expected trading range for today is between 160.80 and 162.40
Trend forecast: Bullish
Silver price (XAG/USD) climbs to near $33.00 in European trading hours on Wednesday, the highest level seen in more than two weeks. The white metal strengthens as deepening fears of a United States (US) economic slowdown have kept the US Dollar (USD) on the backfoot. The US Dollar Index (DXY), which gauges the Greenback’s value against six major currencies, is slightly higher but remains close to an over four-month low of 103.35.
Investors expect the US economy is exposed to a recession as the tariff policies of President Donald Trump could weigh on consumer demand in the near term, assuming that tariffs will be inflationary. Fears of a US recession escalated after comments from US Commerce Secretary Howard Lutnick in a CBS interview on Tuesday indicated that policies by the President are worthwhile despite fears that they could lead to a recession. The appeal of precious metals, such as Silver, increases when economic uncertainty heightens.
Growing US economic risks have fuelled expectations that the Federal Reserve (Fed) could cut interest rates sooner rather than later. According to the CME FedWatch tool, there is a 42% chance that the central bank will cut interest rates in May, significantly increased from 10.4% seen a month ago. For fresh guidance on the Fed’s monetary policy outlook, investors await the US Consumer Price Index (CPI) data for February, which will be published at 12:30 GMT.
Economists expect the year-on-year headline inflation data to have risen at a slower pace of 2.9%, compared to the 3% increase seen in January. In the same period, the core CPI – which excludes volatile food and energy prices – is estimated to have decelerated to 3.2% from the prior release of 3.3%.
On the geopolitical front, growing optimism over an end of war in Ukraine has failed to weigh on the Silver price. On Tuesday, Ukraine agreed to an immediate 30-day ceasefire in a meeting with US officials in Saudi Arabia. Meanwhile, Russia wants to speak with US President Trump before commenting on the acceptability of a temporary ceasefire.
Silver price trades in an Ascending Triangle chart pattern on a daily timeframe, which indicates indecisiveness among market participants. The horizontal resistance of the above-mentioned chart pattern is placed from the February 14 high of $33.40, while the upward-sloping border is placed from the December 31 low of $28.78.
The 20-day Exponential Moving Average (EMA) near $32.20, continues to support the Silver price.
The 14-day Relative Strength Index (RSI) climbs above 60.00. A bullish momentum would trigger if the RSI sustains above that level.
Looking down, the psychological level of $30.00 will act as key support for the Silver price. While, the October 22 high of $34.87 will be the major barrier.
Silver is a precious metal highly traded among investors. It has been historically used as a store of value and a medium of exchange. Although less popular than Gold, traders may turn to Silver to diversify their investment portfolio, for its intrinsic value or as a potential hedge during high-inflation periods. Investors can buy physical Silver, in coins or in bars, or trade it through vehicles such as Exchange Traded Funds, which track its price on international markets.
Silver prices can move due to a wide range of factors. Geopolitical instability or fears of a deep recession can make Silver price escalate due to its safe-haven status, although to a lesser extent than Gold’s. As a yieldless asset, Silver tends to rise with lower interest rates. Its moves also depend on how the US Dollar (USD) behaves as the asset is priced in dollars (XAG/USD). A strong Dollar tends to keep the price of Silver at bay, whereas a weaker Dollar is likely to propel prices up. Other factors such as investment demand, mining supply – Silver is much more abundant than Gold – and recycling rates can also affect prices.
Silver is widely used in industry, particularly in sectors such as electronics or solar energy, as it has one of the highest electric conductivity of all metals – more than Copper and Gold. A surge in demand can increase prices, while a decline tends to lower them. Dynamics in the US, Chinese and Indian economies can also contribute to price swings: for the US and particularly China, their big industrial sectors use Silver in various processes; in India, consumers’ demand for the precious metal for jewellery also plays a key role in setting prices.
Silver prices tend to follow Gold’s moves. When Gold prices rise, Silver typically follows suit, as their status as safe-haven assets is similar. The Gold/Silver ratio, which shows the number of ounces of Silver needed to equal the value of one ounce of Gold, may help to determine the relative valuation between both metals. Some investors may consider a high ratio as an indicator that Silver is undervalued, or Gold is overvalued. On the contrary, a low ratio might suggest that Gold is undervalued relative to Silver.
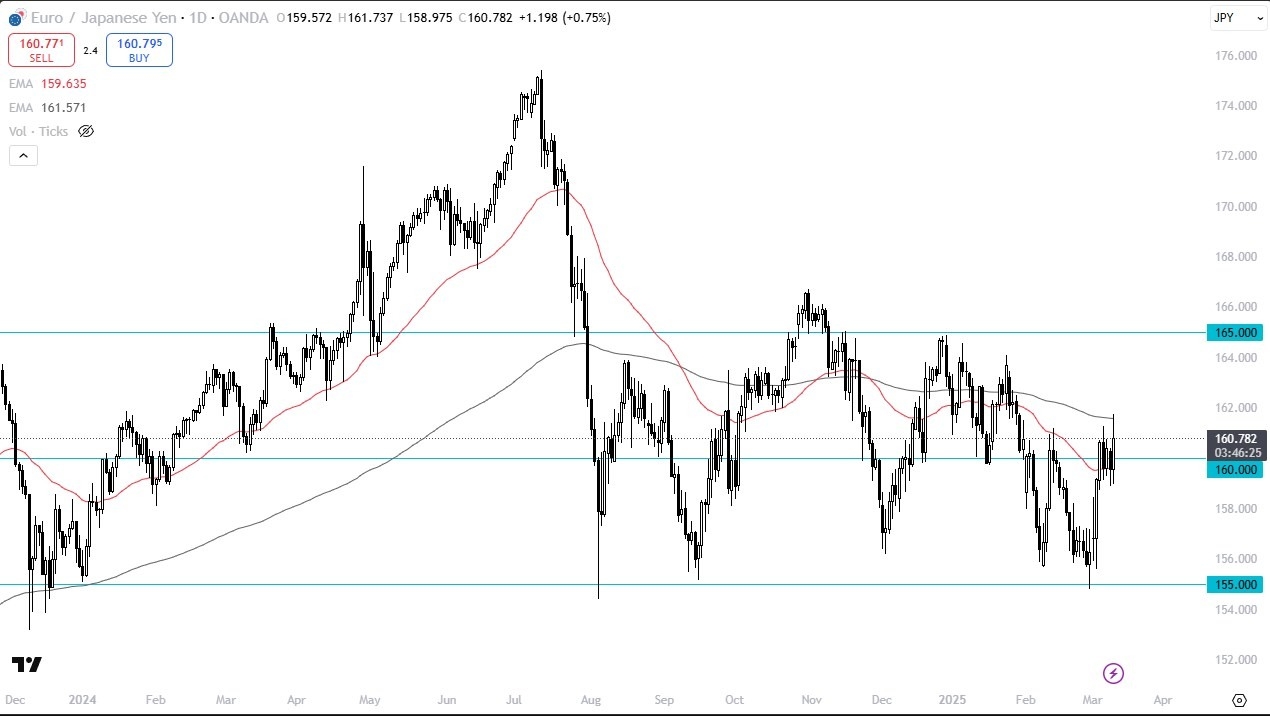
Short-term pullbacks, I think, continue to find buyers because of the interest rate differential and the fact that interest rates in Europe are rising via the bond market. That has a major influence on what happens with the euro itself. The Japanese yen, by contrast, has the Bank of Japan and its ultra-loose monetary policy, despite the fact that it’s probably going to raise interest rates one more time.

It’s also worth noting that the market has been banging around between the 50-day EMA and the 200-day EMA indicators, so there are a certain number of questions about whether or not we’re going to break out of this area. If we do break out, typically, that means you’re going to get some momentum. As things stand right now and also taking into account the size and strength of the candlesticks for the trading session on Tuesday, I do favor the upside.
I don’t like paying for a swap at the end of the day anyway, and generally, over the long term, that’s a loser. Short-term traders may continue to kick this thing back around these moving averages, but ultimately, I think you have a scenario where short-term dips probably bring in more buyers. I don’t have any interest in shorting. I don’t want to own the Japanese yen at this point.
Begin trading our daily forecasts and analysis. Here is a list of Forex brokers in Japan to work with.
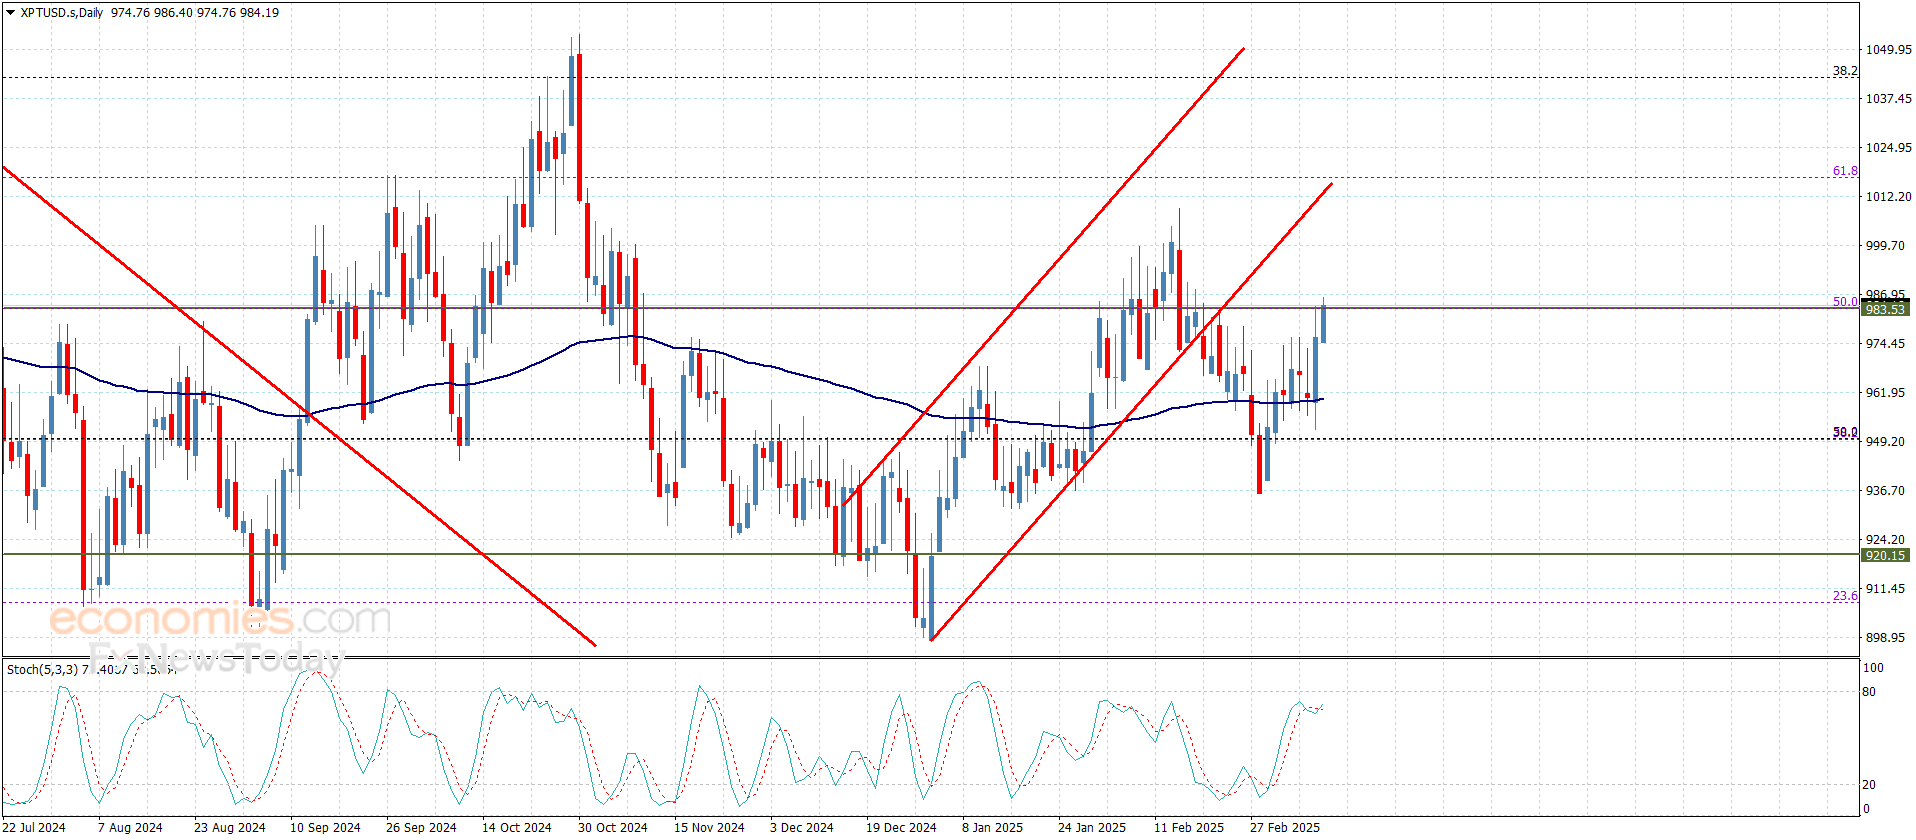
Gold price continues to fluctuate near 2920.00$ level, waiting to breach this level to confirm the continuation of the bullish wave and achieve more gains in the upcoming period, noticing that stochastic attempts to gain the positive momentum to support het chances of achieving the required breach.
To review the full report, and to get our more detailed analysis and 100% accurate signals provided by Best Trading Signal, subscribe to Economies.com VIP Club through the link below!
Gold price trades with caution above $2,900 early Wednesday as buyers take a breather weighing a global tariff war while gearing up for the highly-anticipated Consumer Price Index (CPI) from the United States (US) due later in the day.
A typical cautious environment prevails heading into the US consumer inflation data publication, leaving Gold price gyrating in a narrow range. The US Dollar (USD) sees a short-covering rebound as traders opt to cash in on their positions following the recent downward spiral.
The renewed uptick in the USD and the US Treasury bond yields appear to check the Gold price recovery. Still, buyers could jump back into the game if the US annual headline and core CPI figures come in softer-than-expected, prompting the US Federal Reserve’s (Fed) to proceed with interest rate cuts this year. In such a scenario, the Greenback and the US Treasury bond yields will likely face fresh supply, boosting the non-interest-bearing Gold price.
However, Gold price could reverse the previous rebound and head further south in case the inflation data surprises markets to the upside. Unexpectedly hot CPI data could add credence to the Fed’s cautious outlook on inflation and rate cuts, weighing negatively on the yieldless Gold price.
In the meantime, US President Donald Trump-led tit-for-tat tariffs remain in the spotlight, affecting risk tone and the traditional store of value, Gold price. White House staff confirmed on Tuesday that a global 25% tariff on all steel and aluminium imported into the US would take effect on Wednesday.
Meanwhile, US Trade Secretary Peter Navarro said that “April 2nd we begin the process with reciprocity.”
In response, Canada’s Energy Minister Jonathan Wilkinson warned that the country would impose non-tariff measures, including restrictions on oil exports to US if trade tensions with Washington intensify further.
Markets also eagerly await the US-Russia peace talks on the Ukraine conflict due later on Wednesday, especially after Ukrainian President Volodymyr Zelensky agreed late Tuesday to a 30-day ceasefire proposed by the US if Russia accepts the plan, per CNN News.
Trade war and geopolitical risks remain at the centre of the market’s attention, which leave any impact on Gold price from the US inflation data short-lived.
Gold price managed to close Tuesday above the 21-day Simple Moving Average (SMA), now at $2,910, offering buyers a fresh hope for more upside.
The 14-day Relative Strength Index (RSI) stays firm above 50, justifying the bullish potential.
Should buyers sustain above the 21-day SMA at $2,910 following the US inflation prints, the February 26 high of $2,930 will be next on their radars.
Further up, Gold price will target an all-time high of $2,956, followed by the $2,970 round level.
If the selling pressure creeps in on hot US CPI data, immediate support is seen at the previous day’s low of $2,880.
Failure to resist above that level will open the door to testing the $2,850 psychological barrier.
Additional declines will likely challenge the $2,835 static support area.
Inflationary or deflationary tendencies are measured by periodically summing the prices of a basket of representative goods and services and presenting the data as The Consumer Price Index (CPI). CPI data is compiled on a monthly basis and released by the US Department of Labor Statistics. The YoY reading compares the prices of goods in the reference month to the same month a year earlier.The CPI is a key indicator to measure inflation and changes in purchasing trends. Generally speaking, a high reading is seen as bullish for the US Dollar (USD), while a low reading is seen as bearish.
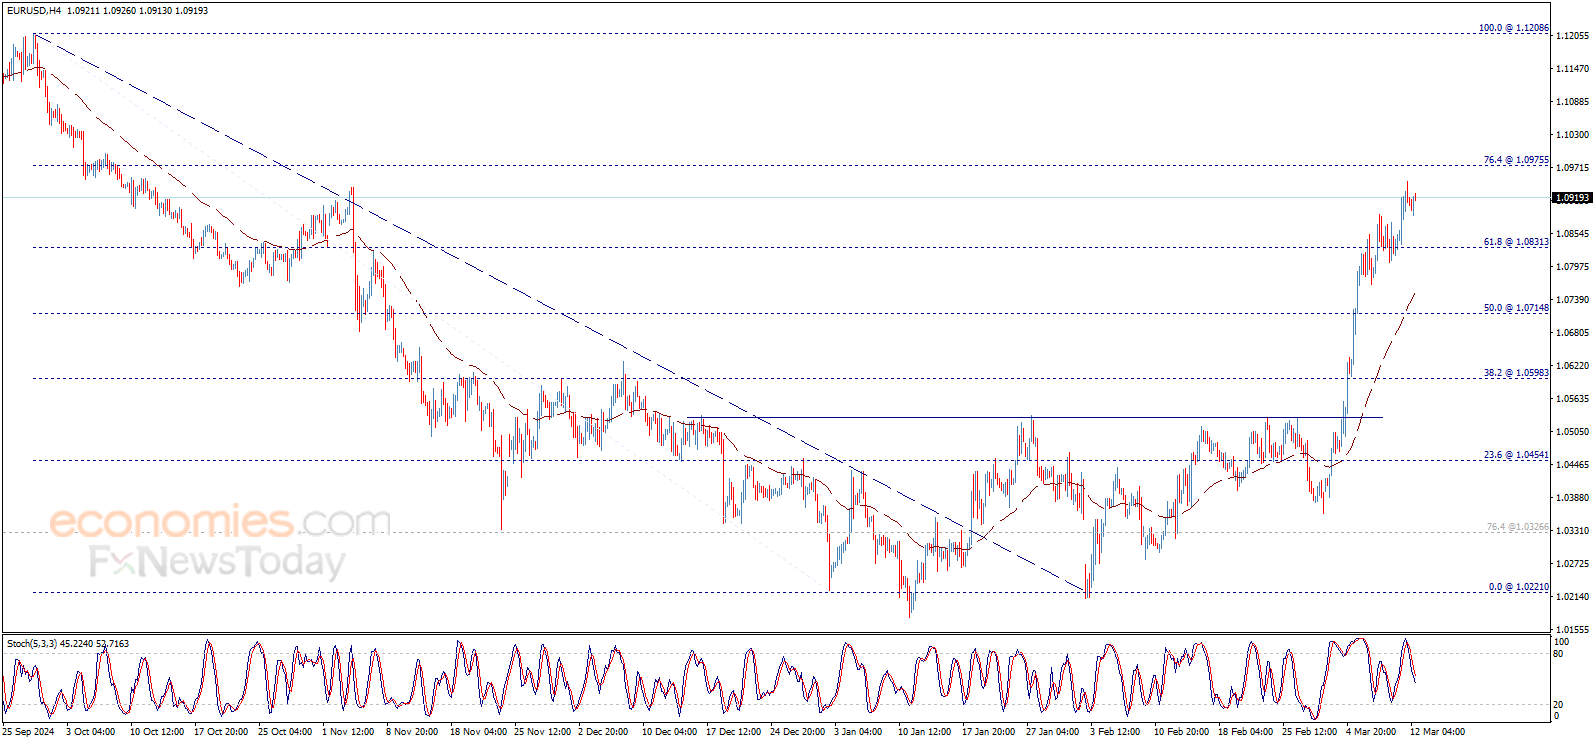
EUR/USD seems to have entered a consolidation phase near 1.0900 after rising to its strongest level since mid-October near 1.0950. The pair’s technical outlook suggests that the bullish bias remains intact but investors could refrain from committing to another leg higher in the near term.
The table below shows the percentage change of Euro (EUR) against listed major currencies this week. Euro was the strongest against the Canadian Dollar.
| USD | EUR | GBP | JPY | CAD | AUD | NZD | CHF | |
|---|---|---|---|---|---|---|---|---|
| USD | -0.80% | -0.15% | 0.40% | 0.48% | 0.13% | 0.00% | 0.32% | |
| EUR | 0.80% | 0.61% | 1.18% | 1.29% | 1.02% | 0.78% | 1.01% | |
| GBP | 0.15% | -0.61% | 0.52% | 0.65% | 0.41% | 0.12% | 0.46% | |
| JPY | -0.40% | -1.18% | -0.52% | 0.08% | -0.20% | -0.46% | 0.00% | |
| CAD | -0.48% | -1.29% | -0.65% | -0.08% | -0.39% | -0.47% | -0.18% | |
| AUD | -0.13% | -1.02% | -0.41% | 0.20% | 0.39% | -0.23% | 0.05% | |
| NZD | -0.01% | -0.78% | -0.12% | 0.46% | 0.47% | 0.23% | 0.39% | |
| CHF | -0.32% | -1.01% | -0.46% | -0.00% | 0.18% | -0.05% | -0.39% |
The heat map shows percentage changes of major currencies against each other. The base currency is picked from the left column, while the quote currency is picked from the top row. For example, if you pick the Euro from the left column and move along the horizontal line to the US Dollar, the percentage change displayed in the box will represent EUR (base)/USD (quote).
The White House announced that 25% tariffs on steel and aluminum products from Canada and all other countries went into effect, with no exceptions or exemptions. In response, European Commission President Ursula von der Leyen said on Wednesday that the European Union (EU) has launched “swift and proportionate” countermeasures worth 26 billion Euros.
Meanwhile, European Central Bank (ECB) President Christine Lagarde said on Wednesday that trade fragmentation could lead to “larger, more disruptive relative price changes.”
In the second half of the day, the US Bureau of Labor Statistics will release the Consumer Price Index (CPI) data for February.
On a monthly basis, the core CPI is forecast to rise 0.3% following the 0.4% increase recorded in January. According to the CME FedWatch Tool, markets currently see virtually no chance of the Federal Reserve (Fed) cutting its policy rate after next week’s meeting. A soft monthly core CPI print, however, could feed into expectations of a rate reduction in May and weigh on the US Dollar (USD) with the immediate reaction. On the flip side, a stronger-than-forecast reading could support the USD. Nevertheless, a hot inflation report is likely to revive concerns over an economic downturn in the US and make it difficult for the USD to stage a decisive rebound.
EUR/USD remains within the ascending regression channel and the Relative Strength Index (RSI) indicator on the 4-hour chart stays near 70, reflecting the bullish stance. On the upside, 1.0940 (static level) aligns as interim resistance before 1.1000 (static level, round level, mid-point of the ascending channel).
In case EUR/USD drops below 1.0870 (lower limit of the ascending channel) and starts using this level as resistance, technical buyers could be discouraged. In this scenario, 1.0800 (static level, round level) could be seen as next support before 1.0730, where the 200-day Simple Moving Average is located.
Tariffs are customs duties levied on certain merchandise imports or a category of products. Tariffs are designed to help local producers and manufacturers be more competitive in the market by providing a price advantage over similar goods that can be imported. Tariffs are widely used as tools of protectionism, along with trade barriers and import quotas.
Although tariffs and taxes both generate government revenue to fund public goods and services, they have several distinctions. Tariffs are prepaid at the port of entry, while taxes are paid at the time of purchase. Taxes are imposed on individual taxpayers and businesses, while tariffs are paid by importers.
There are two schools of thought among economists regarding the usage of tariffs. While some argue that tariffs are necessary to protect domestic industries and address trade imbalances, others see them as a harmful tool that could potentially drive prices higher over the long term and lead to a damaging trade war by encouraging tit-for-tat tariffs.
During the run-up to the presidential election in November 2024, Donald Trump made it clear that he intends to use tariffs to support the US economy and American producers. In 2024, Mexico, China and Canada accounted for 42% of total US imports. In this period, Mexico stood out as the top exporter with $466.6 billion, according to the US Census Bureau. Hence, Trump wants to focus on these three nations when imposing tariffs. He also plans to use the revenue generated through tariffs to lower personal income taxes.
The EURGBP price succeeded to regain the bullish bias by surpassing 0.8315 resistance line, forming many bullish waves to notice achieving big gains by settling near 0.8430 now.
We expect to form additional support at 0.8400, along with getting continuous positive momentum by the major indicators, to increase the chances of targeting 0.8460 level, while surpassing it will extend trades towards the second target at 0.8485.
The expected trading range for today is between 0.8410 and 0.8460
Trend forecast: Bullish
The GBPJPY pair took advantage of the stability of 188.50 support line to activate the bullish track and start achieving many gains by rallying towards 191.70, to approach the target mentioned in our previous report.
We notice stochastic attempt to provide the additional positive momentum to increase the efficiency of the bullish track, to expect attacking 192.10 obstacle, while surpassing it might extend trades towards 50% Fibonacci correction level at 193.25.
The expected trading range for today is between 190.80 and 193.25
Trend forecast: Bullish
Bitcoin price (BTCUSD) ended yesterday above 80474.40$ level, to hint the attempt to stop the bearish correction that dominated the recent trades, but we notice that the technical indicators show clear negative signals now, as stochastic shows overbought signals, while the EMA50 forms continuous negative pressure against the price.
To review the full report, and to get our more detailed analysis and 100% accurate signals provided by Best Trading Signal, subscribe to Economies.com VIP Club through the link below!
The EURJPY pair formed strong bullish rally yesterday, confirming its surrender to the domination of the bullish bias, to notice its fluctuation near the second target at 161.65, taking advantage of its stability above the MA55.
We expect to form additional support at 160.10, beside stochastic additional positive momentum, to continue forming the bullish waves and attempt to press on 162.40 resistance line, followed by monitoring its behavior due to the importance of this level to detect the next trend.
The expected trading range for today is between 160.80 and 162.40
Trend forecast: Bullish