The main category of Forex News.
You can use the search box below to find what you need.
[wd_asp id=1]
The main category of Forex News.
You can use the search box below to find what you need.
[wd_asp id=1]
Silver price (XAG/USD) continues its upward momentum for the third consecutive session, hovering around $33.30 per troy ounce during Asian trading hours on Thursday. The precious metal benefits from growing safe-haven demand amid escalating trade tensions and mounting concerns over a potential United States (US) recession.
Trade tensions intensified after US President Donald Trump imposed higher tariffs on steel and aluminum imports, heightening economic uncertainty and boosting Silver’s appeal as a safe-haven asset. Trump also described the economy as being in a “transition period,” signaling a possible slowdown. Investors interpreted his comments as an early warning of potential economic turbulence ahead.
The non-interest-bearing commodities including Silver gained traction as the US inflation cooled more than anticipated in February, raising speculation that the Federal Reserve (Fed) might cut interest rates sooner than expected.
US monthly headline inflation slowed to 0.2% in February from 0.5% in January, while core inflation eased to 0.2%, below the forecasted 0.3%. On an annual basis, headline inflation declined to 2.8% from 3.0%, while core inflation slipped to 3.1% from 3.3%. Market participants are now awaiting Thursday’s US Producer Price Index (PPI) data and weekly jobless claims for further economic cues.
Additionally, demand for dollar-denominated Silver could rise as the US Dollar (USD) remains under pressure due to cooling inflation. A weaker Greenback makes commodities more affordable for foreign buyers. At the time of writing, the US Dollar Index (DXY), which measures the USD against six major currencies, remains steady around 103.50.
Silver is a precious metal highly traded among investors. It has been historically used as a store of value and a medium of exchange. Although less popular than Gold, traders may turn to Silver to diversify their investment portfolio, for its intrinsic value or as a potential hedge during high-inflation periods. Investors can buy physical Silver, in coins or in bars, or trade it through vehicles such as Exchange Traded Funds, which track its price on international markets.
Silver prices can move due to a wide range of factors. Geopolitical instability or fears of a deep recession can make Silver price escalate due to its safe-haven status, although to a lesser extent than Gold’s. As a yieldless asset, Silver tends to rise with lower interest rates. Its moves also depend on how the US Dollar (USD) behaves as the asset is priced in dollars (XAG/USD). A strong Dollar tends to keep the price of Silver at bay, whereas a weaker Dollar is likely to propel prices up. Other factors such as investment demand, mining supply – Silver is much more abundant than Gold – and recycling rates can also affect prices.
Silver is widely used in industry, particularly in sectors such as electronics or solar energy, as it has one of the highest electric conductivity of all metals – more than Copper and Gold. A surge in demand can increase prices, while a decline tends to lower them. Dynamics in the US, Chinese and Indian economies can also contribute to price swings: for the US and particularly China, their big industrial sectors use Silver in various processes; in India, consumers’ demand for the precious metal for jewellery also plays a key role in setting prices.
Silver prices tend to follow Gold’s moves. When Gold prices rise, Silver typically follows suit, as their status as safe-haven assets is similar. The Gold/Silver ratio, which shows the number of ounces of Silver needed to equal the value of one ounce of Gold, may help to determine the relative valuation between both metals. Some investors may consider a high ratio as an indicator that Silver is undervalued, or Gold is overvalued. On the contrary, a low ratio might suggest that Gold is undervalued relative to Silver.
The GBPUSD price trades positively to attempt to move away form 1.2925$ level, reinforcing the expectations of continuing the bullish trend in the upcoming sessions, which gets continuous support by the EMA50.
To review the full report, and to get our more detailed analysis and 100% accurate signals provided by Best Trading Signal, subscribe to Economies.com VIP Club through the link below!
Silver price settles near the ne waited target at 33.35$, and we suggest the continuation of the bullish bias to surpass this level and achieve more gains in the upcoming sessions, reminding you that the next station reaches 33.75$.
To review the full report, and to get our more detailed analysis and 100% accurate signals provided by Best Trading Signal, subscribe to Economies.com VIP Club through the link below!
Inflation in the United States (US), as measured by the change in the Consumer Price Index (CPI), declined to 2.8% on a yearly basis in February from 3% in January, the US Bureau of Labor Statistics (BLS) reported on Wednesday. This reading came in below the market expectation of 2.9%. On a monthly basis, the CPI rose 0.2% following the 0.5% increase recorded in January.
Follow our live coverage of the US inflation data and the market reaction.
The core CPI, which excludes volatile food and energy prices, rose 3.1% on a yearly basis. This print followed the 3.3% increase in January and came in below analysts’ estimate of 3.2%. On a monthly basis, the core CPI rose 0.2%.
The US Dollar (USD) Index, which tracks the USD’s performance against a basket of six major currencies, retreated from session highs following the CPI data. At the time of press, the index was up 0.1% on the day at 103.50.
The table below shows the percentage change of US Dollar (USD) against listed major currencies this week. US Dollar was the weakest against the Euro.
| USD | EUR | GBP | JPY | CAD | AUD | NZD | CHF | |
|---|---|---|---|---|---|---|---|---|
| USD | -0.66% | -0.31% | 0.42% | 0.11% | 0.05% | -0.02% | 0.21% | |
| EUR | 0.66% | 0.32% | 1.13% | 0.79% | 0.83% | 0.63% | 0.78% | |
| GBP | 0.31% | -0.32% | 0.71% | 0.44% | 0.51% | 0.26% | 0.53% | |
| JPY | -0.42% | -1.13% | -0.71% | -0.34% | -0.33% | -0.55% | -0.15% | |
| CAD | -0.11% | -0.79% | -0.44% | 0.34% | -0.09% | -0.12% | 0.08% | |
| AUD | -0.05% | -0.83% | -0.51% | 0.33% | 0.09% | -0.19% | -0.01% | |
| NZD | 0.02% | -0.63% | -0.26% | 0.55% | 0.12% | 0.19% | 0.31% | |
| CHF | -0.21% | -0.78% | -0.53% | 0.15% | -0.08% | 0.00% | -0.31% |
The heat map shows percentage changes of major currencies against each other. The base currency is picked from the left column, while the quote currency is picked from the top row. For example, if you pick the US Dollar from the left column and move along the horizontal line to the Japanese Yen, the percentage change displayed in the box will represent USD (base)/JPY (quote).
This section below was published as a preview of the US Consumer Price Index (CPI) data at 03:00 GMT.
The United States (US) Bureau of Labor Statistics (BLS) is set to publish the high-impact Consumer Price Index (CPI) inflation report for February on Wednesday at 12:30 GMT.
The CPI figures could notably impact the US Dollar (USD) and the Federal Reserve’s (Fed) cautious monetary policy stance.
As measured by CPI, inflation in the US is set to rise at an annual pace of 2.9% in February, down slightly from 3.0% reported in January. Core CPI inflation, which excludes the volatile food and energy categories, is expected to ease to 3.2% in the same period from a year earlier, compared to a 3.3% growth in January.
On a monthly basis, a 0.3% increase is projected for the headline CPI and the core CPI inflation figures.
Previewing the report, analysts at TD Securities noted: “We expect core CPI inflation to cool down in February following the January jump to 0.45%, as price resets came in firmer than expected in the services segment. We look for slowing in both the goods and services segments, with owners’ equivalent rent (OER) inflation dropping to a 3-month low.”
“On a year-over-year (YoY) basis, headline and core CPI inflation are likely to drop by a tenth each to 2.9% and 3.2%, respectively,” TDS analysts said.
Against mounting US economic slowdown concerns and President Donald Trump-led global tariff war, markets are now pricing in 85 basis points (bps) of easing from the Fed this year, compared to 75 bps on Monday, per the LSEG Fed interest rate probabilities.
The recent slew of US data releases has been quite discouraging, especially with the February Nonfarm Payrolls (NFP) report on Friday showing that the US economy added 151,000 jobs in February, compared with an expected rise of 160,000 and a previous downward revision of 125,000. The Unemployment Rate climbed to 4.1% versus expectations of 4%. The Labor Force Participation Rate ticked a tad lower to 62.4% in the same period from January’s 62.6%.
On the other hand, Fed Chair Jerome Powell stated on Friday that the US central bank would take a cautious approach to monetary policy easing, adding that the economy currently “continues to be in a good place”.
Therefore, stakes are high heading into the US CPI showdown as the inflation report could shed fresh light on the direction of the Fed’s interest rates and the USD.
A bigger-than-expected cooldown in the annual headline and core inflation prints could shake off concerns over risks to the disinflation path, compelling Fed to resume rate cuts while exacerbating the Greenback’s pain.
Conversely, the US dollar would find renewed demand if the US CPI data surprises the upside. This scenario would justify the Fed’s prudence on inflation and policy outlooks, reviving hawkish Fed expectations.
Dhwani Mehta, Asian Session Lead Analyst at FXStreet, offers a brief technical outlook for EUR/USD and explains: “EUR/USD’s near-term technical picture points to a likely buyer exhaustion as the Relative Strength Index (RSI) indicator on the daily chart sits within the overbought territory above 70. However, any pullback could be quickly bought into as a 21-day Simple Moving Average (SMA) and 100-day SMA Bull Cross remains in play.”
“EUR/USD needs acceptance above the November 6 2024 high of 1.0937 to extend the uptrend toward the 1.1000 psychological level. The next relevant bullish targe is seen at the 1.1050 mark. Conversely, the immediate support is at the 200-day SMA at 1.0721, below which the March 5 low of 1.0602 will be tested. The 21-day SMA at 1.0546 will be buyers’ last defence.”
Tariffs are customs duties levied on certain merchandise imports or a category of products. Tariffs are designed to help local producers and manufacturers be more competitive in the market by providing a price advantage over similar goods that can be imported. Tariffs are widely used as tools of protectionism, along with trade barriers and import quotas.
Although tariffs and taxes both generate government revenue to fund public goods and services, they have several distinctions. Tariffs are prepaid at the port of entry, while taxes are paid at the time of purchase. Taxes are imposed on individual taxpayers and businesses, while tariffs are paid by importers.
There are two schools of thought among economists regarding the usage of tariffs. While some argue that tariffs are necessary to protect domestic industries and address trade imbalances, others see them as a harmful tool that could potentially drive prices higher over the long term and lead to a damaging trade war by encouraging tit-for-tat tariffs.
During the run-up to the presidential election in November 2024, Donald Trump made it clear that he intends to use tariffs to support the US economy and American producers. In 2024, Mexico, China and Canada accounted for 42% of total US imports. In this period, Mexico stood out as the top exporter with $466.6 billion, according to the US Census Bureau. Hence, Trump wants to focus on these three nations when imposing tariffs. He also plans to use the revenue generated through tariffs to lower personal income taxes.
A decisive breakout above today’s high would trigger a one-day bullish reversal breakout and put crude in a position to challenge higher trend resistance areas. The potentially more significant resistance zone is first around the 20-Day MA, now at $71.11.
For crude to have a shot of going higher and potentially reversing the bearish trend it needs to first get above and stay above the 20-Day line. That moving average can be viewed along with the downtrend line marking dynamic resistance for the decline. A decisive breakout above the line would put crude in a position to challenge potential resistance around the 50-Day MA, which is $73.23 currently.
It is important to consider several key factors when addressing support at the daily low point. Support was seen near an interim swing low of $66.86 from mid-November, and near the lower channel line for the current decline. That November support level was also a monthly low. Although the lower line was not hit specifically, the correction got close enough given the subsequent bullish reaction.
Moreover, a measured move for the correction shows a $13.79 or 17.1% decline from the most recent swing high at $80.76. The four prior bearish corrections in crude oil ranged from a decline of 14.8% to 18.3%. Since the current decline was close to matching the largest recent drop on a percentage basis, it provides another piece of evidence to support the likely completion of the correction. The fact that a sharp intraday bullish reversal followed further supports this thesis.
For a look at all of today’s economic events, check out our economic calendar.
Following a swing low of $2.99 from late-January, natural gas reclaimed its 20-Day MA on February 13. Shortly thereafter, the advance accelerated and subsequently encountered resistance around the top trendline of a large rising parallel trend channel. That led to a decline and an eventual higher swing low at $3.74. Support around the 20-Day MA and the 50-Day MA (orange) were successfully tested around the swing low as it was followed by a bullish key reversal day. The current decline is testing support around the 20-Day line for the first time it was tested in mid-February.
Initial dynamic trend support for the current bearish pullback is around the 20-Day MA and internal uptrend line. If support is maintained around those lines, then the structure of the uptrend from $2.99 remains intact. But a decisive drop below both lines will indicate the potential for a deeper retracement. But further signs of weakening would be needed to further confirm the breakdown.
There is always the possibility of a false breakdown that quickly reclaims the trend support lines. The 38.2% Fibonacci retracement level at $4.17 failed to show support on the way down today. This opens the possibility of an eventual test of support around the 50% retracement level at $3.95. Of course, the 20-Day line and trendline would be broken before then.
Resistance has been encountered around the top line of a rising channel multiple times since the December interim swing high. On Monday, a bullish breakout of the channel led to a new trend high of $4.90 and then a failure of the breakout given the quick bearish reversal and subsequent downside continuation. Therefore, it is possible that a bearish correction could test lower support levels, below the trendline, before it is done.
For a look at all of today’s economic events, check out our economic calendar.
March 12, 2025 – Written by Frank Davies
STORY LINK GBP/USD Forecast: Pound Sterling Subdued as US Inflation Cools
The British Pound Sterling (GBP) remained largely static versus the U.S. Dollar (USD) on Wednesday, as fresh US inflation figures failed to generate significant movement in the pairing.
At the time of writing, the Pound US Dollar exchange rate (GBP/USD)was trading at $1.2934, showing minimal change from the morning’s opening levels.
The US Dollar (USD) saw limited movement on Wednesday as fears of an economic slowdown continued to weigh on the currency.
USD remained pressured as concerns over US tariffs and potential retaliatory measures from other nations fuelled recession worries.
With tariffs on steel and aluminium imports coming into force, the European Union announced countermeasures set to take effect from 1 April.
In the afternoon, the latest US consumer price index revealed that inflation eased from 3% to 2.8% in February.
While this reinforced expectations that the Federal Reserve could cut interest rates more aggressively, the report did little to shift market sentiment.

Despite inflationary pressures cooling, fears of an economic downturn kept the ‘Greenback’ subdued. However, safe-haven demand limited any significant losses.
Meanwhile, the Pound (GBP) traded in a narrow range on Wednesday as a lack of UK economic data left the currency without clear direction.
As an increasingly risk-sensitive currency, Sterling faced mixed influences.
Market caution over escalating trade tensions limited GBP gains.
However, a temporary ceasefire agreement between Ukraine and Russia helped to improve overall sentiment, preventing Sterling from sliding lower.
Looking ahead, the GBP/USD exchange rate may experience volatility if the White House announces further tariff measures.
Should Donald Trump escalate trade tensions in response to EU countermeasures, market jitters could weigh on USD.
However, increased safe-haven demand could provide some support for the currency.
On the data front, USD traders will be eyeing the latest producer price index (PPI) release for further clues on inflation trends.
A softer PPI reading could reinforce expectations of Fed rate cuts, potentially weakening the US Dollar.
Meanwhile, UK economic data remains limited until Friday’s GDP release. With expectations of a slowdown in January, Sterling could face headwinds at the end of the week if growth figures disappoint.
International Money Transfer? Ask our resident FX expert a money transfer question or try John’s new, free, no-obligation personal service! ,where he helps every step of the way,
ensuring you get the best exchange rates on your currency requirements.
TAGS: Pound Dollar Forecasts
Silver price (XAG/USD) loses ground after registering gains in the previous session, trading around $32.80 during the Asian hours on Wednesday. Technical analysis on the daily chart indicates a weakening bullish bias, with the grey metal remaining below an ascending channel pattern.
However, the Silver price remains above the nine-day and 50-day Exponential Moving Averages (EMAs), signaling that short-term momentum is stronger and further upward movement. Additionally, the 14-day Relative Strength Index (RSI) is positioned above the 50 mark, reinforcing the bullish bias.
On the upside, the primary barrier appears at the four-month high of $33.40, recorded on February 14, which is aligned with the lower boundary of the ascending channel. A successful return to the ascending channel would strengthen the bullish outlook and drive the metal price toward the channel’s upper boundary at $35.10.
To the downside, the XAG/USD pair may find initial support at the nine-day EMA of $32.41, followed by the 50-day EMA at $31.65 level. A break below this level could weaken short- and medium-term price momentum, pushing Silver’s price toward the two-month low of $30.70, recorded on February 3.
Silver is a precious metal highly traded among investors. It has been historically used as a store of value and a medium of exchange. Although less popular than Gold, traders may turn to Silver to diversify their investment portfolio, for its intrinsic value or as a potential hedge during high-inflation periods. Investors can buy physical Silver, in coins or in bars, or trade it through vehicles such as Exchange Traded Funds, which track its price on international markets.
Silver prices can move due to a wide range of factors. Geopolitical instability or fears of a deep recession can make Silver price escalate due to its safe-haven status, although to a lesser extent than Gold’s. As a yieldless asset, Silver tends to rise with lower interest rates. Its moves also depend on how the US Dollar (USD) behaves as the asset is priced in dollars (XAG/USD). A strong Dollar tends to keep the price of Silver at bay, whereas a weaker Dollar is likely to propel prices up. Other factors such as investment demand, mining supply – Silver is much more abundant than Gold – and recycling rates can also affect prices.
Silver is widely used in industry, particularly in sectors such as electronics or solar energy, as it has one of the highest electric conductivity of all metals – more than Copper and Gold. A surge in demand can increase prices, while a decline tends to lower them. Dynamics in the US, Chinese and Indian economies can also contribute to price swings: for the US and particularly China, their big industrial sectors use Silver in various processes; in India, consumers’ demand for the precious metal for jewellery also plays a key role in setting prices.
Silver prices tend to follow Gold’s moves. When Gold prices rise, Silver typically follows suit, as their status as safe-haven assets is similar. The Gold/Silver ratio, which shows the number of ounces of Silver needed to equal the value of one ounce of Gold, may help to determine the relative valuation between both metals. Some investors may consider a high ratio as an indicator that Silver is undervalued, or Gold is overvalued. On the contrary, a low ratio might suggest that Gold is undervalued relative to Silver.
The USD/JPY forecast shows a pullback in the yen as the focus shifts to the impact of Trump’s tariffs on Japan’s export-reliant economy. At the same time, fears of the US recession kept the dollar under pressure. However, the greenback rebounded ahead of the US CPI report to gauge the outlook for Fed rate cuts.
–Are you interested to learn more about forex options trading? Check our detailed guide-
The yen pulled back from recent highs as Trump maintained his aggressive stance on tariffs. On Wednesday, his tariff on steel and aluminium imports came into effect, igniting a trade war with the Eurozone. This has also shone a light on the looming reciprocal tariff.
Trump’s tariffs will significantly impact the global economy. This includes Japan’s export-reliant economy. As a result, demand for the yen eased on Wednesday. Investors are seeking safety in other assets like gold.
Meanwhile, the Bank of Japan remains hawkish on policy. Companies in Japan agreed to more wage hikes on Wednesday, setting in place the right conditions for rate hikes. As a result, market participants expect more rate hikes this year. However, the next move might come in May.
Meanwhile, traders are looking forward to the US CPI report. Economists expect inflation to increase by 0.3%, lower than the previous reading of 0.5%. Meanwhile, the annual figure might ease to 2.9%.
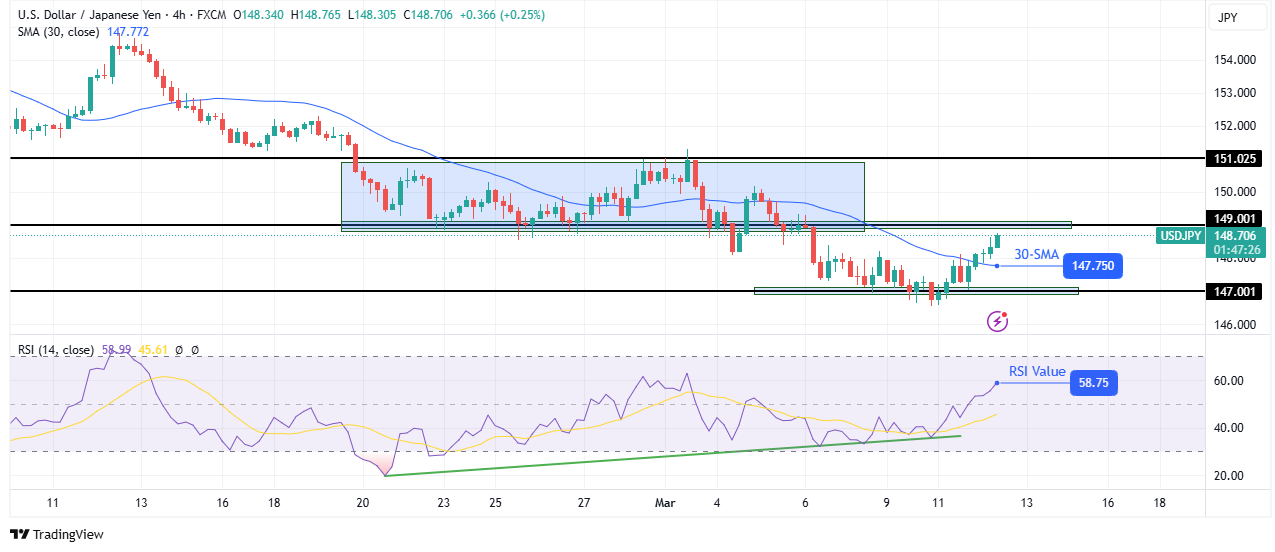
On the technical side, the USD/JPY price has broken above the 30-SMA, indicating a bullish shift in sentiment. At the same time, the RSI has broken above 50, indicating stronger bullish momentum. This shift came after the RSI made a bullish divergence. While the price made a lower low, the RSI made a higher one, showing weaker momentum. This allowed bulls to return to the market.
–Are you interested to learn more about Thailand forex brokers? Check our detailed guide-
However, the price has to break above the 149.00 resistance level to confirm a new bullish trend. Moreover, it must start making higher highs and lows. On the other hand, if the 149.00 resistance holds firm, USD/JPY will return to retest the 147.00 support. A break below this level will make a lower low, confirming a continuation of the previous downtrend.
Looking to trade forex now? Invest at eToro!
67% of retail investor accounts lose money when trading CFDs with this provider. You should consider whether you can afford to take the high risk of losing your money.
Spot Gold kept trading within familiar levels throughout the first half of Wednesday, finding buyers on approaches to the $2,900 mark yet meeting sellers ahead of the $2,930 level. The US Dollar (USD) broad weakness maintained the bright metal afloat yet fell short of boosting demand.
Wall Street opened with a positive tone but quickly turned into the red after the United States (US) reported softer-than-expected February inflation figures. The US Consumer Price Index (CPI) was up 0.2% MoM in February, while the annual figure printed at 2.8%. Finally, core annual inflation rose 3.1%, with all figures coming below expected.
Easing price pressures temporarily boosted speculation the American economy was doing good enough to skip President Donald Trump’s inspired chaos. However, trade-war-related concerns weighed more. The US Dollar came under renewed selling pressure after the American opening, pushing XAU/USD to the upper end of its recent range.
Market participants, however, maintain the focus on trade tensions. Levies on all steel and aluminium imports into the US pay levies of 25% as of today, with Canada and Europe announcing retaliatory measures. Canada announced new trade duties on some $21 billion worth of US goods, while the European Commission launched levies worth around $29 billion on US industrial and agricultural products starting April 1.
The daily chart for the XAU/USD pair shows it is pressuring the upper end of the aforementioned range, albeit with limited bullish strength. The pair rests above a flat 20 Simple Moving Average (SMA), which provides support at around $2,912.50. The same chart shows, however, that the Momentum indicator remains stuck around its 100 line. At the same time, the 100 and 200 SMAs head firmly north far below the current level, in line with the dominant bullish trend. Finally, the Relative Strength Index (RSI) indicator advances at around 60, also supportive of a bullish continuation.
In the near term, and according to the 4-hour chart, XAU/USD bullish momentum increased. The pair is developing above all its moving averages, with converging 20 and 100 SMAs providing support around the daily low. The 200 SMA keeps heading north far below the shorter ones, while technical indicators aim north well above their midlines, in line with an upcoming leg higher.
Support levels:2,912.50 2,893.35 2,881.80
Resistance levels: 2,929.90 2,941.40 2,956.10